Transcription
Accuracy of Claims-Based RiskScoring ModelsOctober 2016
2Accuracy of Claims-Based Risk Scoring ModelsSPONSORHealth Section Research AUTHORSCommitteeGeof Hileman, FSA, MAAASpenser SteeleCaveat and DisclaimerThe Society of Actuaries does not endorse, explicitly or implicitly for any purposes,software packages evaluated in the study. The opinions expressed and conclusionsreached by the authors are their own and do not represent any official position oropinion of the Society of Actuaries or its members. The Society of Actuaries makesno representation or warranty to the accuracy of the information.Copyright 2016 All rights reserved by the Society of Actuaries 2016 Society of Actuaries
3TABLE OF CONTENTSSection 1:Acknowledgements . 4Section 2:2.12.22.3Background and Scope . 5MOTIVATION FOR THE STUDY. 5STUDY SCOPE AND COMPARISON TO PRIOR STUDIES. 5OVERVIEW OF TERMINOLOGY . 6Section 3:3.1Study Design .7INCLUDED MODELS . 73.1.1ACG System (Vendor: Johns Hopkins University) . 93.1.2Chronic Illness & Disability Payment System and MedicaidRx (Vendor: University of California atSan Diego) . 93.1.3Clinical Risk Groups (Vendor: 3M Health Information Systems) . 93.1.4DxCG Intelligence (Vendor: Verisk Health) .103.1.5HHS-HCC (Vendor: Centers for Medicare and Medicaid Services) .103.1.6Impact Pro (Vendor: Optum) .103.1.7Milliman Advanced Risk Adjusters (Vendor: Milliman) .103.1.8SCIO Cost of Care Model (Vendor: SCIO Health Analytics ) .113.1.9Truven Cost of Care Model (Vendor: Truven Health Analytics, an IBM Company) .113.1.10 Wakely Risk Assessment Model (Vendor: Wakely Consulting Group) .11DATA SOURCE .11MEASURES OF FIT .12MODEL RECALIBRATION .143.23.33.4Section 4:4.14.24.34.44.54.64.7Results . 16CHARACTERISTICS OF SAMPLED POPULATION .16R-SQUARED AND MEAN ABSOLUTE ERROR .17GROUP-LEVEL MEASURES OF FIT .21PREDICTIVE RATIOS.244.4.1Predictive Ratios by Health Condition.254.4.2Predictive Ratios by Age and Sex.284.4.3Predictive Ratios by Cost Range .314.4.4Predictive Ratios by Benefit Richness .334.4.5Predictive Ratios by Geographic Area .37TOLERANCE CURVES .39IDENTIFICATION OF HIGHEST EXPENDITURE INDIVIDUALS .43ACCURACY IN PREDICTING BIASED GROUPS .46Section 5:5.15.25.3Additional Analyses . 49COMPARISON TO HHS-HCC MODEL .49ENSEMBLE MODELS .52EXPLORATION OF A MACHINE LEARNING IMPLEMENTATION (Assisted by: Forecast Health) .54Section 6:Concluding Statements . 56Section 7:Reliances and Limitations . 57References . 58Appendix II.AI.BI.CI.DPredictive Ratios . 59Concurrent Models, No Censoring .59Concurrent Models, 250,000 Censoring .66Prospective Models, No Censoring .73Prospective Models, 250,000 Censoring .80Appendix II Tolerance Curves . 87II.A Tolerance Curves, Concurrent Models .87II.B Tolerance Curves, Prospective Models.89 2016 Society of Actuaries
4Accuracy of Claims-Based Risk Scoring ModelsThis paper presents the results of a study comparing the accuracy of over 40 risk scoring models from 11different vendors / sources. The study builds on prior studies with a similar objective published by theSociety of Actuaries in 1996, 2002, and 2007. (Dunn, et al., 1996) (Cumming, Knutson, Cameron, &Derrick, 2002) (Winkelman & Mehmud, 2007)Section 1:AcknowledgementsWe are grateful to the Society of Actuaries and the Health Section Research Committee in particular fortheir funding of this research effort. We are also very appreciative of Steven Siegel and Barbara Scott ofthe Society of Actuaries for their administration of the project and the associated oversight group.The Project Oversight Group provided valuable feedback and dialogue throughout the course of theproject. The POG included the following individuals:-(Chair) Ian Duncan, FSA, FIA, FCIA, FCA, MAAABrandon Barber, MSChristopher Coulter, FSA, MAAAHsinTing Tina Liu, CPA, MBABill O’Brien, FSA, MAAARebecca Owen, FSA, MAAADan Pribe, FSA, MAAAWe also wish to recognize Casey Kangas of Kennell & Associates for his peer review of our SAS code andRandall Brown, Ph.D., of Mathematica Policy Research for consulting support and peer review throughoutthe project. We are also indebted to the previous research teams that laid a foundation for this study.The 1996 study was conducted by researchers from the Harvard University School of Public Health andCoopers & Lybrand, LLP, and included Daniel Dunn, Alice Rosenblatt, Deborah Taira, Eric Latimer, JohnBertko, Thomas Stoiber, Peter Braun, and Susan Busch. The 2002 study was conducted by RobertCumming and Brian Cameron of Milliman and David Knutson and Brian Derrick of the Park NicolletInstitute Health Research Center. The 2007 study was conducted by Ross Winkelman and Syed Mehmudof Milliman.Finally, each of the vendors participating in the study worked extensively with us to ensure that theirmodels were properly installed and functioning in our environment. Results of the study were sharedwith them prior to publication in order to provide an opportunity for comments. Each vendor alsoprovided us with the use of their software on a no-cost basis, which was essential for the completion ofthis project. We are grateful for the collaborative and helpful spirit exhibited by all of the vendorsthroughout the research effort. 2016 Society of Actuaries
5Section 2:Background and Scope2.1 MOTIVATION FOR THE STUDYSince the publication of the most recent SOA study comparing risk scoring models, the field of suchmodels has become considerably more crowded. In the 2007 study, twelve models were compared froma total of six distinct vendors (Winkelman & Mehmud, 2007). Since then, commercially available modelsare now being marketed from additional vendors - we have included such newer offerings from Milliman,SCIO Health Analytics, Truven Health Analytics, and the Wakely Consulting Group. Also, some of theexisting vendors have expanded their suite of available products. The Johns Hopkins ACG System is nowavailable in a pharmacy-only, diagnosis-only, and combined version, where only two versions had beenincluded in the 2007 study.In addition to new commercially-available models, risk scoring has taken on a much more prominent rolewithin the U.S. healthcare system through the implementation of the Affordable Care Act’s reforms.Specifically, all individual and small group health insurance plans (both on- and off-exchange) are subjectto financial transfers governed by a risk adjustment program. This program is designed to ensure thatcarriers attracting higher-risk individuals within each community-rated market are compensated by theplans attracting lower-risk individuals. Risk adjustment has essentially replaced medical underwriting asthe primary mechanism for normalizing revenue for health risk in the individual and small groupsegments. While risk adjustment has been prominent in Medicare and Medicaid managed care financingfor years, this new focus in the commercial marketplace supports a fresh look at the various models thatcan be used for this purpose. We have also included the model that governs most of these financialtransfers (the HHS-HCC model) in our comparison study.2.2 STUDY SCOPE AND COMPARISON TO PRIOR STUDIESThe primary objective of this research effort remains unchanged from prior studies – to evaluate thepredictive accuracy of the current set of commercial risk scoring models available in the marketplace.Although some vendors have ventured into related predictive modeling efforts such as the risk ofhospitalization, we have kept our focus on the traditional "risk score" value. The models that are includedin this study are based on data elements found in claim encounter records, such as diagnoses, proceduresand prescription drugs. These models do not include information from medical records such as clinicalindicators of severity, measures of prior use, lifestyle or supplemental demographic information, orsurvey-based data.While the number of risk scoring models and vendors has increased considerably from the prior study, wehave reduced the number of variations in the comparison. For example, the prior study comparedmodels with health care costs censored at two different levels; we have reduced this to one level. Wehave also not reproduced the prior study's evaluation of data with and without a lag in the data periodsbetween the diagnosis and evaluation period. These topics were treated thoroughly in the previous studyand their exclusion permitted time to be spent on new areas of focus.We have introduced new comparisons among the models. First, we have developed a measure toindicate the likelihood that a model's predicted risk score is accurate at the individual level within aspecified tolerance. We have also evaluated the binary prediction of the top one percent of healthcarespenders. Finally, we have also included a comparison of the accuracy of each model when predictingbiased samples of groups of individuals. This is particularly relevant to the current commercialmarketplace, where risk scoring methods are being called upon to serve as a substitute for underwriting. 2016 Society of Actuaries
6We have attempted to provide a variety of methods for comparisons across models, so that modelselection can be guided by metrics that match up more closely with the business problem at hand for agiven application.We have found that this variety of means of comparison is essential to understanding differences amongmodels and the areas in which risk scoring models excel. One of the key points stressed throughout thepaper is the observation that R-Squared values alone are not sufficient to explain the predictive abilitiesof a risk scoring model. We have found that R-Squared values are particularly susceptible to the influenceof outlier observations and that other measures are needed to fully evaluate a set of models.2.3 OVERVIEW OF TERMINOLOGYThroughout this paper, we have referred to the category of models that we evaluated as risk scoringmodels. While perhaps more commonly referred to as “risk adjustment” models, we feel that the latterterm connotes a specific purpose for which these models are typically used – that is, the normalization ofplan premiums or claims experience across a covered population or market to account for differences inrisk. Risk scoring is the first step of that process – the means by which each individual is assigned aspecific risk score. The second step of risk adjustment, the payment transfer, is not within the scope ofthis study, as it is typically not coupled with a particular model.In all of the model comparisons, we have categorized the models as prospective or concurrent models.This is a critical distinction for any approach to risk scoring. A prospective model uses information fromone year to predict medical expenditures for the following year. A concurrent model, by contrast, usesinformation from one year to explain medical expenditures in that same year. For the purpose of thiscomparison of statistical power, the most important distinction between the two approaches is thatconcurrent models are far more accurate in their predictions. This is due to the fact that the claimsexperience being predicted is more closely associated with the data period from which the independentvariables have been drawn. A full discussion of the differences between these two approaches and theirapplication can be found in a recent report published by the Society of Actuaries (Hileman, Rosenberg, &Mehmud, 2016).Another important difference between the tested models is the type of inputs, or independent variables,that are used in determining the predictions. We have classified models according to their use ofdiagnosis data, pharmacy data and, for prospective models, prior year cost data. While there may beother minor differences in the types of input data used (such as the inclusion of procedure codes as aninput), we have categorized models into the following groups: diagnosis-only (DX), pharmacy-only (RX),diagnosis-and-pharmacy (DX RX), and diagnosis-and-pharmacy with prior year costs (DX RX ). 2016 Society of Actuaries
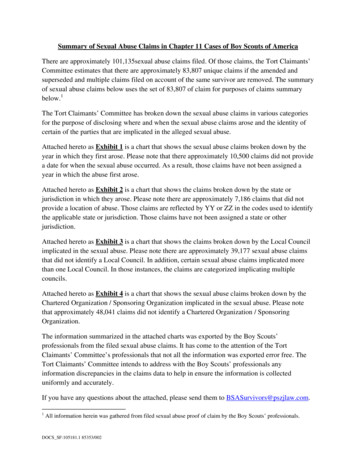
7Section 3:Study DesignIn this section we provide a summary of the models that were selected for inclusion in the study, the datasource used in the statistical evaluation, and the methods used for comparing the predictive power of thevarious models.3.1 INCLUDED MODELSSince the release of the 2007 study (Winkelman & Mehmud, 2007), there have been notable new entriesinto the risk scoring model market. Several existing vendors have also increased the variety of modelsoffered. One new development over the past decade has been the introduction of predictive models thataim to predict more than simple relative risk. For example, some models now produce probabilities ofhospitalization as an additional dependent variable. The evaluation of these predictive variables isbeyond the scope of this study, which focused solely on the traditional risk score measure of relative risk.We have included 23 prospective models and 19 concurrent models from a total of ten distinct sources /vendors in this study. For all comparisons, we have grouped the models by their prospective orconcurrent design but also by the type of input data used in the risk score generation. These groupingsincluded diagnosis-only (DX), pharmacy-only (RX), diagnosis-and-pharmacy (DX RX), and diagnosis-andpharmacy plus prior cost (DX RX ; prospective applications only). Table 3.1.1 summarizes the modelsthat were included in the study. 2016 Society of Actuaries
8Table 3.1.1: Included ModelsSourceJohns HopkinsUniversityUniversity ofCalifornia at SanDiegoModel Name /VersionModel TypesJohns Hopkins ACGSystem, v11.0.1Concurrent (DX;DX RX)Prospective (DX; RX;DX RX; DX RX )Chronic Illness &Disability PaymentSystem, v5.5Concurrent (DX; RX;DX RX)MedicaidRx, v5.5Prospective (DX; RX;DX RX)3M HealthInformationSystems3M Clinical RiskGroups (CRG), v2.0Verisk HealthDxCG Intelligence,v4.3.1Centers forMedicare andMedicaid ServicesHHS-HCC Model, v3Concurrent (DX)OptumImpactProProspective (DX; RX;DX RX)MillimanMilliman AdvancedRisk Adjusters(MARA), v3.6SCIO HealthAnalyticsProspective Cost ofCare ModelProspective (DX RX )Truven Health, anIBM CompanyCost of Care Model,v2.0Concurrent (DX)Prospective (DX)Wakely ConsultingGroupWakely RiskAssessment Model,v5.01Concurrent (DX RX)Prospective (DX RX)Concurrent (DX; RX)Prospective (DX; RX;DX RX )Concurrent (DX; RX;DX RX)Prospective (DX; RX;DX RX; DX RX )Concurrent (DX; RX;DX RX)Prospective (DX; RX;DX RX)We excluded the Medicare Advantage CMS-HCC model, because it is specifically tailored for a Medicarepopulation and would not be appropriate to compare alongside the models focused on commercial-agedpopulations, particularly given the inclusion of the HHS-HCC model now used in the commercial sector. 2016 Society of Actuaries
9We have provided brief summaries of each of the models that were provided for this study. Thesesummaries are drawn from the background materials and documentation provided by each of thevendors, where available.3.1.1 ACG System (Vendor: Johns Hopkins University)The ACG System concurrent and prospective cost models measure the morbidity burden of patientpopulations based on disease patterns derived from the diagnostic and/or pharmaceutical codeinformation found in insurance claims or other electronic medical records. A distinguishing feature of theACG System is its "person-focused" approach emphasizing the constellation of morbidities rather thanindividual disease categories or stages allowing the System to capture the multidimensional nature of anindividual's health over time. The program offers a suite of risk models (e.g likelihood of hospitalization,unexpected high pharmacy use, continuous high utilizer) as well as a range of clinical markers (e.g. tocoordination of care, active treatment for specific disease categories, frailty ) that provide additionalcontext to the interpretation of generated risk scores.3.1.2 Chronic Illness & Disability Payment System and MedicaidRx (Vendor: University ofCalifornia at San Diego)The Chronic Illness and Disability Payment System (CDPS) is a classification system for Medicaid programsto use to make health-based capitated payments for TANF and disabled Medicaid beneficiaries. Thereare both concurrent and prospective weights provided along with diagnosis and pharmacy weights for allflags the model creates. The provided weights are summed across the flags on a member level.3.1.3 Clinical Risk Groups (Vendor: 3M Health Information Systems)CRGs are a classification system for describing the health status and burden of illness of individuals in anidentified population. CRG relates the historical clinical and demographic characteristics of the enrollee(claim based diagnosis, procedure, pharmaceutical, and functional health status) to the amount and typeof healthcare resource that enrollee will consume in the future. In addition, CRGs can be linked to criticaloutcomes such as rates of potentially Preventable Readmissions and Emergency Department Visits.The CRG system is a categorical clinical model that classifies each member of the population based on hisor her burden of chronic medical conditions, assigning each individual into one of over 1,400 mutuallyexclusive risk categories. Individuals without a chronic condition are assigned to groups for healthy orsignificant acute illness. CRGs offer the user the choice of two models for both prospective andconcurrent applications. The prospective model has 346 base categories and a total of 1,434 risk groupswith severity level breakouts. These are also aggregated to three tiers with 618, 206, and 44 risk groupsin each tier, respectively. The concurrent model is similar but with slightly more risk groups.Although only the diagnosis-plus-pharmacy version of the CRG model weights were provided and tested,CRGs can also be run with diagnosis data only.For this study, a pre-release working version of the V2.0 CRG software from August 2015 was used. Thefully updated V2.0 CRG software released by 3M in May 2016 contained additional updates to itscategories and logic, but was not available in time to be used for this study. 2016 Society of Actuaries
103.1.4 DxCG Intelligence (Vendor: Verisk Health)Using predictive models, DxCG Intelligence turns healthcare data into risk scores for individual patients.Scores correlate with the cost of the underlying illness burden that individuals carry. Aggregating thescores of individuals with key attributes generates group-level predictive results that can be applied toanswer questions fundamental to the ability to manage clinical and financial risks.Consisting of more than 100 models, DxCG Intelligence includes both concurrent and prospectivevariants. Models are grouped into three primary functional bundles—budgeting and underwriting,medical management, and performance assessment—that can be tailored for commercial, Medicare, andMedicaid populations.3.1.5 HHS-HCC (Centers for Medicare and Medicaid Services)The HHS-HCC model was developed by CMS to fulfil the need for risk normalization in the post-ACAcommercial marketplace. The HHS-HCC model uses diagnoses and demographics to assign a risk score toeach individual. There are separate models provided for infants, children, and adults, each of whichreflect the specific contribution of particular conditions to risk for these groups. One unique aspect of theHHS-HCC model is that the model does not predict allowed costs, but rather predicts plan liability at eachof the five ACA metal levels: platinum, gold, silver, bronze, and catastrophic. Because in this study we aremeasuring accuracy in predicting total allowed costs, we have used the HHS-HCC platinum model as itrepresents the closest available proxy for allowed costs.It is also very important to note in the context of this comparison study that the maximization of RSquared and other measures of predictive accuracy was not a primary goal in the development of theHHS-HCC model. According to Kautter et al. (2004), “the HHS-HCC models are intended to balance highpredictive ability with lower sensitivity to discretionary diagnostic coding.”3.1.6 Impact Pro (Vendor: Optum)Optum ImpactPro is a clinical, episode-based predictive model. It: Uses information readily available from medical and pharmacy claims, as well as memberenrollment files.Uses a member's clinical episodes of care, prior use of health care services, prescription drugs,and lab results as markers of their future health care use.Creates markers of use that can be both predictive and provide clinical insights into why a patientis high risk.Predicts both future expenditures and calculates the probability of one or more hospitalizations.Produces outputs that can be used to design and implement effective care and case managementstrategies and to support actuaries and underwriters.Includes a reporting application that allows users to explore model results to better understandpatients of highest risk and their most important diseases and conditions.3.1.7 Milliman Advanced Risk Adjusters (Vendor: Milliman)Milliman Advanced Risk Adjusters (MARA) release 3.6 was used for this study. MARA uses demographicand claim data in conjunction with its library of risk adjusters to estimate morbidity and healthcareresource use. One of the distinguishing features of the MARA model is the calculation of six servicespecific risk scores in addition to the total risk score. Risk scores are calculated separately forpharmaceutical, inpatient facility, outpatient facility, emergency room, physician, and other medical 2016 Society of Actuaries
11services. MARA output includes clinical condition flags as well as risk scores. The MARA library of modelsincludes prospective and concurrent models calibrated for commercial and Medicare populations, as wellas an implementation of the HHS-HCC risk adjustment model specification published by the federalgovernment.3.1.8 Prospective Cost of Care Model (Vendor: SCIO Health Analytics )The SCIO Prospective Cost of Care Model is a commercial risk assessment model developed by SCIOHealth Analytics . The model aims at predicting the total costs and financial risk per member using theirhealth care utilization, prior year’s total health expenditures, and demographics. The modelwas developed using two years of commercial claims data. In addition, the model leverages enrollmentdata, demographic details, medical claims, and pharmacy claims data. The intent is to better align the riskfactors with more recent treatment patterns and heath care costs.The Prospective Cost of Care Model assigns each member to one or more of the 75 SCIO proprietarycondition categories and/or CCS diagnosis groupers based on medical and pharmacy claims. This helpsgenerate a member risk profile that is based on age, gender, and condition categories. Member'sprospective risk cost is then assigned based on age, gender, utilization, prior year costs, and conditioncategories.3.1.9 Cost of Care Model (Vendor: Truven Health Analytics, an IBM Company)Truven’s Cost of Care Model estimates both retrospective and future expected healthcare payments for acommercially insured population. The models were created using the Truven MarketScan researchdatabase, and apply both linear and non-linear modeling methods to predict cost of care. Bothconcurrent and prospective models were developed for total cost of care (medical and prescriptiondrugs) and medical costs alone. The models predict relative costs under three alternative high-cost outliertruncation criteria: None, 100,000, and 250,000.3.1.10 Wakely Risk Assessment Model (Vendor: Wakely Consulting Group)The Wakely Risk Assessment (WRA) model was developed with the goal of keeping the model designsimple and transparent. To this end, the WRA model includes fewer than 90 medical markers and lessthan 60 pharmacy markers in a simple linear-additive model. The required model inputs are also designedto use a minimum amount of information (to reduce administrative burden of running a model). Anothermotivation for the model was to anticipate what the HHS-HHS model may look like. Towards this, themodel explicitly disallows a substantial number of diagnosis codes and pharmacy NDC codes that may bevague, discretionary, or otherwise susceptible to ‘gaming’. The model includes an implementation of theHHS-HHS model as an option.3.2 DATA SOURCEThe primary data source for this study was Truven Health Analytics’ MarketScan Commercial Claims andEncounters database for calendar years 2012 and 2013. The MarketScan database contains experiencecovering nearly 50 million lives, including demographics, medical, and prescription drug encounter data.In order to keep the computational requirements manageable, we selected a sample of one millionindividuals for the calculation of measures of predictive accuracy. We sampled these individuals in twostages: first, we excluded individuals with inadequate da
- Brandon Barber, MS - Christopher Coulter, FSA, MAAA - HsinTing Tina Liu, CPA, MBA - ill Orien, FS A, MAAA - Rebecca Owen, FSA, MAAA - Dan Pribe, FSA, MAAA . We also wish to recognize Casey Kangas of Kennell & Associates for his peer review of our SAS code and