Transcription
ESMAP Technical Paper 122/09Study of Equipment Prices in the Power SectorStudy of Equipment Pricesin the Power SectorESMAP Technical Paper 122/09Energy Sector Management Assistance Program
ESMAP Technical Paper 122/09Study of EquipmentPrices in thePower SectorDirk PauschertEnergy Sector Management Assistance Program
Copyright 2009The International Bank for Reconstructionand Development/THE WORLD BANK GROUP1818 H Street, NWWashington, D.C. 20433, U.S.A.All rights reservedProduced in the United States of America.First Printing December 2009ESMAP Reports are published to communicate the results of ESMAP’s work to the development community.Some sources cited in this paper may be informal documents that are not readily available.The findings, interpretations, and conclusions expressed in this report are entirely those of the author(s) andshould not be attributed in any manner to the World Bank, or its affiliated organizations, or to members of itsboard of executive directors or the countries they represent. The World Bank does not guarantee the accuracyof the data included in this publication and accepts no responsibility whatsoever for any consequence of theiruse. The boundaries, colors, denominations, other information shown on any map in this volume do not implyon the part of the World Bank Group any judgment on the legal status of any territory or the endorsement oracceptance of such boundaries.The material in this publication is copyrighted. Requests for permission to reproduce portions of it should besent to the ESMAP manager at the address shown in the copyright notice. ESMAP encourages disseminationof its work and will normally give permission promptly and, when the reproduction is for noncommercialpurposes, without asking a fee.The prices in the report are estimates and may not be an accurate reflection of market prices, which may changedepending on the evolving manufacturer supply and market demand conditions for such equipment. Thereforethe report should not be used as a basis for bidding or bid evaluation. Papers in the ESMAP Technical Seriesare discussion documents, not final project reports. They are subject to the same copyright as other ESMAPPublications.
ContentsAbbreviations and AcronymsviiUnits of MeasureixExecutive SummaryxiBackgroundStudy Findings—Escalation and Market PricingStudy Findings—Plant Cost EstimatesStudy Findings—Global Marketplacexixixiiixiv1. Project Approach Methodology12. Price Escalation, Cost Factors, and Market Pricing3Worldwide Growth and Its Influence on Escalation from 2004 to 2007Projections of Escalation in the United States, India, and RomaniaCost Increases Not Explained by Escalation IndexesImpacts of the International MarketplaceImpact of Plant Size on Technology Cost3. Assessment of Price Trends for Generation Plant EquipmentImpacts of Increase in Heavy Construction Projects in the United States and OverseasU.S. Trends in Cost Indexes for Power Plant Equipment and MaterialsTrends in Escalation for Power Plant-Related Items in India and RomaniaOther Assessments and Items Related to EscalationEvolution of the International Marketplace—Major Equipment Suppliers4. Impact of Plant Size on CostImpact of Size on Cost for Simple Cycle Gas TurbinesImpact of Size on Cost for Gas Turbine/Combined CycleImpact of Size on Cost for Wind Farms3678913131516181923232427iii
CONTENTS5. Cost Estimates for Power Plants in the United States, India, and RomaniaGas Turbine Simple CycleGas Turbine Combined CycleCoal-Fired Steam PlantOil-Fired Steam PlantNatural Gas-Fired Steam PlantDiesel-Generator PlantOnshore Wind FarmsPhotovoltaic ArraySolar Thermal ArrayAnnex 1. Design BasisBrief Descriptions of Major Generation OptionsGeneration Plant Cost EstimatesCost Estimate Breakdown for the Generation TechnologiesSize Classification of Generation PlantsSummary of Sizes for Generation Plant Cost EstimatesOther Generation-Related CriteriaAnnex 2. Cost Indexes from U.S. Bureau of Labor Statistics(Graphs of Cost Indexes for Equipment and Materials)Cost Indexes for Power Plant Equipment and Materials in the United StatesAnnex 3. OEMs in RomaniaCoal-Fired BoilersSteam TurbinesCombustion TurbinesStationary Diesel Engine 909292Annex 4. OEMs in India95List of Technical age Price of Crude Oil WorldwideEffect of Size on Cost of Gas Turbine Combined Cycle UnitsEffect of Size on Cost of Pulverized Coal-Fired PlantsCost Indexes for 316 Stainless Steel, Nickel, and ChromeImpact of Size on OEM Cost for Simple Cycle UnitsChange in OEM Prices for Simple Cycle Aeroderivative Gas Turbine UnitsChange in OEM Prices for Simple Cycle Heavy-Frame Gas Turbine UnitsImpact of Size on OEM Costs for Combined Cycle UnitsChange in OEM Prices for Combined Cycle UnitsInstalled Cost of Wind Projects as a Function of Project Size: U.S. Projects 2003–2006Year-to-Year Change in Average Price of Heavy-Frame Simple Cycle UnitsYear-to-Year Change in Average Price of Aero and Heavy Simple Cycle UnitsYear-to-Year Change in Average Price of Combined Cycle UnitsProfile of Worldwide Stationary Reciprocating Engine SalesManufacturing Experience and Average Turbine SizeProjections of Long-Term Trends in Wind Turbine Costs in EuropeReported U.S. Wind Turbine Transaction PricesCost Index for Ready-Mix ConcreteCost Index for Large Centrifugal Pumps4101119232425252627343439495256577676
19:Cost Index for Large Centrifugal FansCost Index for Bulk Material Handling ConveyorsCost Index for Pneumatic ConveyorsCost Index for Crushing, Pulverizing, and Screening MachinesCost Index for Integral Horsepower MotorsCost Index for Fabricated Steel PlatesCost Index for Structural SteelCost Index for Carbon Steel Pipe and TubingCost Index for Field Erected Steel TanksCost Index for Heat Exchangers and CondensersCost Index for Fin-Tube Heat ExchangersCost Index for Industrial Mineral WoolCost Index for Refractories, Non-ClayCost Index for Power and Distribution TransformersCost Index for Electric Wire and CableCost Index for Copper Wire and CableCost Index for Industrial Process Control 5.14:5.15:5.16:Historical Average Annual Compound EscalationxiiProjected Future Average Annual Compound EscalationxiiiClass 5 Pricing Estimates for Selected Generation TechnologiesxivHistorical Average Annual Compound Escalation5Projected Average Annual Compound Escalation for Plant Equipment and Materials,2008–20126Estimated Costs of Major Equipment12Class 5 Plant Pricing Estimates for Generation Technologies12Average Annual Compound Escalation for Plant Equipment and Materials—United States 15Power Plant Equipment and Materials Included in the India and Romania Escalation Data 17India—Average Annual Compound Escalation for Plant Equipment and Materials17Romania—Average Annual Compound Escalation for Plant Equipment and Materials185-MW Simple Cycle Plant—Aeroderivative Gas Turbine3125-MW Simple Cycle Plant—Aeroderivative Gas Turbine32150-MW Simple Cycle Plant—Heavy-Frame Gas Turbine33140-MW Combined Cycle Plant—Heavy-Frame Gas Turbine37580-MW Combined Cycle Plant—Heavy-Frame Gas Turbine38300-MW Pulverized Coal Power Plant—Costs for 1 300 MW Subcritical PulverizedCoal-Fired Plant41500-MW Pulverized Coal Power Plant—Costs for 1 500 MW Subcritical PulverizedCoal-Fired Plant42800-MW Pulverized Coal Power Plant—Costs for 1 800 MW Subcritical PulverizedCoal-Fired Plant43300-MW Oil-Fired Power Plant—Costs for 1 300 MW Subcritical Oil-Fired Plant46300-MW Natural Gas-Fired Power Plant—Costs for 1 300 MW Subcritical NaturalGas-Fired Plant48Diesel Engine Information50Total Plant Prices for Diesel Engine-Generator Plants in India, Romania,and the United States50Wind Farm—Cost Estimate Summary, United States54Cost Estimate Summary per 1-MW Wind Turbine 100-MW Wind Farm in India,Romania, and the United States55Cost Breakdown for a Small PV Grid-Connected System59Cost Estimate for a 5-MW Photovoltaic System in India, Romania, and the United States59v
.9:A4.1viBritish to Metric Conversion FactorsSize Classifications for Cost EstimateEmission Standards or GuidelinesEmission Standards for Large Combustion Plant Directive (LCPD)—Applicableto RomaniaAnticipated Emission Control ProcessesRomanian Coal Analysis—Romanian LigniteIndian Coal Analysis—Australian CoalU.S. Coal Analysis—Powder River Basin (PRB) Subbituminous CoalCost and Site Criteria Applicable to Cost EstimatesPartial List of OEMs in India63707171727272737395
Abbreviationsand /kWhHHVHPHRSGHZI&CIDin. HgAmerican Association of Cost EngineersAmerican Boiler Manufacturers Associationalternating currentaluminum conductor with aluminum alloy reinforced strandsactual cubic feetactual cubic feet per minutealuminum conductor with steel reinforced strandsannual energy productionAmerican Society for Testing and Materials (now known as ASTM International)Bureau of Labor StatisticsBritish thermal units per kilowatt-hourbalance of plantdegrees Centigradecapacity factorcombustion turbinedirect currentdry standard cubic footEnvironmental Protection Agencyelectrostatic precipitatorEuropean Uniondegrees Fahrenheitflue gas desulfurizationat point of productiongross domestic productGeneral Electricgas turbinegas turbine combined cycleGas Turbine Worldgigawattgrams per kilowatt-hourhigher heating valuehorsepowerheat recovery steam generatorHertzinstruments and controlsinduced draftinches of mercuryvii
STUDY OF EQUIPMENT PRICES IN THE POWER SECTORISCCSISOJKcmilKgkVkWkWhLHVMCRMils (measure)Mils UKUS/USAw.g.Wpviiiintegrated solar combined cycle systeminternational Standards Organizationjoulethousand circular milskilogramkilovoltkilowattkilowatt-hourlower heating valuemaximum continuous ratingone-thousandth of one inchone-thousandth of one dollarmilligrams per normal cubic metermillion British thermal unitsmegapascalmegawattpeak megawatt outputnot AvailableNational Energy Technology Laboratorynanograms per joulenormal cubic meternitrogen oxidesNew Source Performance Standardsoriginal equipment manufacturerpulverized coalProduce Price IndexPowder River Basin Coal Wyomingproduction tax creditphotovoltaicresearch and developmentright-of-wayrupeesselective catalytic reductionsulfur dioxidestainless steelsteam turbinesteam turbine-generatorsouthwestto be determinedtotal capital requirementtotal plant cost (also known as total installed cost)tons per yearUnited KingdomUnited States of Americawater gaugeWatts peak
Units of MeasureFGWKgkVkWkWhMWRsUS -hourmegawattrupeesU.S. dollarix
Executive SummaryBackgroundGlobal economic growth, particularly from2004 to 20071, has fueled an expansion in theconstruction of industrial, power plant, andmanufacturing facilities in the United Statesand a dramatic escalation in the constructionof these types of heavy construction projectsoverseas. In addition, the increase in demand foroil by rapidly growing countries such as Chinaand India and the falling value of the dollar hasresulted in an unprecedented rise in the priceof oil. This has significantly accelerated oilexploration and resulted in capacity-expansionprojects at existing oil refineries. The combinationof power plant, infrastructure, and oil-relatedprojects has resulted in significant growth indemand for boilers, rotating equipment, piping,structural steel, concrete, electrical components,and electric wiring.In the past four years, global demand hasled to substantial increases in equipment andmaterial prices in the power sector. This is mainlydue to significant increases in the demand forraw materials and labor associated with themanufacture and fabrication of equipment. From2006 to 2008 alone, energy projects financedby the World Bank experienced 30–50 percentincreases above the original cost estimates,requiring additional financing, a reduction inscope of the project, or schedule delays. Thesedelays are costly to the Bank’s clients becausethey depend on timely completion of projectsto meet growing demands for energy.Against this backdrop, this report wasdeveloped with the following objectives: Identify the current costs of generationoptions;Define the most significant contributors toprice increases;Provide projections of future escalation rates;andIdentify the underlying factors “driving” thesignificant increase in project prices.Understanding of these factors will allow theBank to better anticipate the price increases itcan expect in the near future.Study Findings—Escalationand Market PricingTable 1 provides a summary of the historicalannual average compound escalation for specificpower plant-related equipment and materialsfor the United States, India, and Romania. Thetable shows two periods: January 1996 through December 2003; andJanuary 2004 through December 2007.These periods roughly reflect the timebefore and the time after: (1) the significantincrease in heavy construction projects; and(2) the accelerated increase in the price of oil.A comparison of the two time periods showsthat the spike in escalation is common to all1The work preceding the publishing of this report was completed in 2008. Internal, as well as external reviews were conducted throughthe end of 2009, prior to final clearance by the author and the publishing unit. It is the intention of the author that you find this materialinteresting and insightful.xi
STUDY OF EQUIPMENT PRICES IN THE POWER SECTORTable ES1RankingHistorical Average Annual Compound EscalationPlant Equipment and MaterialsJan. 1996–Dec. 2003, Jan. 2004–Dec. 2007,% per year% per yearUnited StatesFabricated Steel Plates0.310.1Steel Pipe and TubingNA7.0Centrifugal Pumps2.04.7Copper Wire and Cable–0.818.7Power and Distribution TransformersNA13.8Fabricated Metal (Structural Steel/Plate)NA7Steel Pipe and TubingNA6Mechanical EquipmentNA6Electric Wire and CableNA20Electric EquipmentNA7Fabricated Metal (Structural Steel/Plate)NA7Steel Pipe and TubingNA5Mechanical EquipmentNA3IndiaRomaniaSource: U.S. Bureau of Labor Statistics Producers Price Indexes.NA—Not available.of the power-plant-related equipment andmaterials.Using the escalation rates from January 2004through December 2007 and calculating thecumulative increase, the most important driversof power plant cost have been: Fabricated steel shapes: steel plates—47 percent of the cost; structural steel—36 percent; and steel pipe—31 percent;Centrifugal pumps—20 percent; andElectrical items: copper wire—69 percent;transformers—68 percent.The tabulation in chapter 3 provides additionalcategories and further details on escalation ofequipment and materials.Table 2 provides the projections of escalationfrom 2008 to 2012. The projected escalation ratesare lower than they were for the past three yearsdue to the slowdown in the U.S. economy. Thisslowdown is forecast to continue through 2010,and during this period the economy will bexiicharacterized by reduced consumer spending,impacting the import of overseas goods andservices into the United States. This in turn willtranslate into lower rates of escalation in theoverseas countries that supply the United States.In addition to the escalation in the cost ofequipment and materials, increases in the costof craft labor are contributing to the overall priceincreases for constructing generating facilities inthe United States. It should be noted that in thelast four to five years, labor has been escalatingat about 5 percent per year, compared to about3 percent per year prior to 2003. Proportionately,labor does not contribute as much to the plantcost increases as equipment and materials, sincelabor is typically responsible for only 30–40percent of the total installed cost of power plants.However, the escalation of equipment andmaterials costs is not the only contributor to thesignificant increases in power plant costs. Theother aspect responsible for price increases ismarket demand pricing. In other words, in the lastfew years the global market has been in a situation
Executive SummaryTable ES2Projected Future Average Annual Compound EscalationProjected, 2008–2012,% per yearPlant Equipment and MaterialsUnited StatesFabricated Steel Plates0 to 2Structural Steel2 to 3Steel Pipe and Tubing2 to 4Centrifugal Fans1 to 3Electric Wire and Cable–1 to 2Power and Distribution Transformers1 to 3IndiaFabricated Metal (Structural Steel and Plate)6 to 8Steel Pipe and Tubing8 to 9Mechanical Equipment3 to 4Electric Wire and Cable1 to 3Electric Equipment2 to 4RomaniaFabricated Metal (Structural Steel and Plate)2 to 3Mechanical Equipment2 to 3Steel Pipe and Tubing2 to 4Source: URS Washington Division.Note: Values based on a variety of URS Washington Division in-house sources and analyses.where demand for power plant equipment andservices (and infrastructure in general) has beenhigher than the manufacturing and engineeringfirm capacity. Under these conditions, the pricingof equipment and services is often based on whatthe market will bear rather than on the actualcost of production plus industry profit margins.In response to the unprecedented demand,original equipment manufacturers (OEMs) arepricing equipment above the increase in costs ofraw materials and labor costs, and above their“typical” profit margins.An important statement that supports thisfinding came in March 2008 from a large companythat produces mining equipment, when a companyspokesperson asserted “Favorable mining fundamentalscontinue to drive order growth, while stretched leadtimes afford considerable pricing power.” (Joy Global,Bloomberg.com, March 6, 2008)In light of this finding, this study compared thecost of power plants without market demand to theactual costs incurred in constructing power plants.The results indicate that owners are purchasingplants in a sellers’ market, where unprecedenteddemand has resulted in market price premiums inthe range of 15 percentage points above material,equipment, and labor escalation.Study Findings—PlantCost EstimatesThe country-level generation technology costestimates were based on installations locatedin the United States, India, and Romania. TheUnited States was included as the benchmark.India was selected as representative of Asia andbecause it is second only to China in additionof new power plants and growth of grossdomestic product (GDP). Romania was selectedas representative of Eastern Europe.The plant cost estimates are based on budgetquotes for major equipment from OEMs and aproject cost database of recent projects. Majorxiii
STUDY OF EQUIPMENT PRICES IN THE POWER SECTORTable ES3Class 5 Pricing Estimates for Selected Generation Technologies (2008 US ), US /kW netGeneration Plant—Total Plant CostU.S.IndiaRomaniaGas Turbine Combined Cycle Plant, 140 MW1,4101,1701,140Gas Turbine Simple Cycle Plant, 580 MW860720710Coal-Fired Steam Plant (sub), 300 MW net2,7301,6902,920Coal-Fired Steam Plant (sub), 500 MW net2,2901,4402,530Coal-Fired Steam Plant (super), 800 MW net1,9601,2902,250Oil-Fired Steam Plant (sub), 300 MW net1,5401,1801,420Gas-Fired Steam Plant (sub), 300 MW net1,3601,0401,110Diesel Engine-Generator Plant, 1 MW540470490Diesel Engine-Generator Plant, 5 MW630590600Source: Author’s calculations.equipment costs reflect market pricing conditionsas of January 2008. In addition, piping, electrical,concrete, and all other items reflect market pricingbecause they were based on the in-house biddatabases for actual recent projects. All plantcost estimates are based on grid-connectedconfigurations. Moreover, the equipment,structural steel, piping, concrete, labor, and otherplant items reflect costs specific to the respectivecountries. Table 3 provides the total plant marketbased pricing for selected generation technologiesin the United States, India, and Romania.A summary of total plant pricing for all ofthe study technologies is provided in Chapter 3.In addition, a complete list of the items includedin and excluded from the cost estimates for eachgeneration technology can be found later on inthis report.Study Findings—Global MarketplaceRegardless of the country’s location, power plantequipment is now being purchased in the globalmarketplace. While regional markets still retainsome unique characteristics, regional differencesare being reduced or eliminated. For example,most large Japanese suppliers have establishedoffices in the United States and are getting asignificant market share of new power plantequipment. Another aspect of the internationalpower plant market is the entry of new suppliers,in particular suppliers from China.xivWithin China power plants are being builtfor one-third to one-half of the internationalprices for similar plants. It is not clear whetherthese prices are being subsidized or whetherthere are other unique market factors. The factthat these prices have stayed at the same levelwhile international commodity prices haveexperienced substantial increases in the lasttwo to four years raises questions regardingtheir pricing structure. It is certain that laborcosts alone provide China with a competitiveadvantage, which may be reflected in its 20–40percent lower production costs.The most likely focus of Chinese suppliers inthe next two to five years is Asia and Africa. Recentprojects in these regions suggest that the Chinesesuppliers are bidding lower than internationalprices, but not as low as their domestic market.In India, their pricing is more aggressive (biddinglower than suppliers from other countries). TheChinese market entry strategy is most likelyinfluenced by a strong domestic supplier with anear monopoly in the market.In general, the potential impact of Chinesesuppliers on global power plant prices is likely tobe positive, potentially resulting in moderate-tosubstantial price reduction in some markets andless in others. Over the long term, the price gapbetween Chinese suppliers and other suppliersis likely to reach pricing equilibrium (below thelevel without their presence, but at some pricelevel between their prices and the prices of allother competitors).
1Project ApproachMethodologyThis study was focused on selected generationtechnologies options located in three countries.The objectives were to: (1) collect and updateexisting price data on equipment in the powersector; and (2) analyze and report on theunderlying reasons and correlations for currentprice fluctuations. These data were assembledto provide a better understanding of pricefluctuations for energy equipment withinspecific country contexts.For this study, data on prices for energygeneration technologies were collected accordingto the cost classification system defined insubsequent chapters of this document. In orderto collect the necessary data, project documentswere reviewed, and major equipment suppliers(OEMs) in the United States, Eastern Europe,and India were contacted. As part of the datacollection process, major suppliers around theworld were identified. The amount of dataobtained from suppliers was subject to thedegree of their cooperation. Past experience wasfound to prevail on this project—many suppliersdid not provide data for this study due to theircurrent workloads.The price of equipment depends, in part,on the backlogs of suppliers’ productionfacilities. The study considers the impactof the respective backlogs of gas turbine,steam turbine, boiler, diesel generator, windturbine, solar technology, and major electricalequipment manufacturers. Assessments of theimpact of industry backlogs on escalation andplant pricing were based on market reportsand generalized conclusions. All plant costsreflect market-based pricing.1
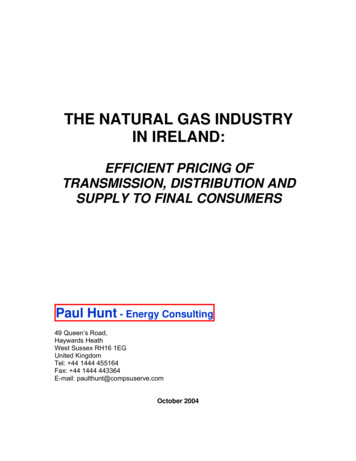
2Price Escalation, CostFactors, and Market PricingWorldwide Growth and ItsInfluence on Escalationfrom 2004 to 2007In the period from 2004 through 2007, therewere substantial increases in escalation of theraw materials used to manufacture equipmentfor power plants. This includes raw materialsor intermediate products used to manufactureboilers, gas turbines, steam turbines, windturbines, and motors and generators. FromJanuary 2005 to December 2006, some significantexamples of price increases are the following:condensers and heat exchangers, 18 percent;electric wire and cable, 23 percent; powertransformers, 32 percent; and copper wire andcable, 84 percent.Global economic growth in the past threeyears, particularly in China and India, hascontributed to a worldwide increase in theconstruction of industrial, power plant, andmanufacturing facilities and the resultingincrease in demand for raw materials andintermediate manufacturing products. This hasled to a significant increase in demand for suchitems as industrial equipment, power plantequipment, piping, structural steel, concrete,electrical components, and electric wiring. Inaddition, the economic growth has resultedin a substantial increase in the demand foroil, significantly accelerating exploration andthe expansion of the existing capacity of oilrefineries.The dramatic scale of overseas activity istypified by the significant number of heavyconstruction projects in India and China. Ofall overseas countries, China has seen the mostsubstantial growth. The scale of constructionof coal-fired electric generating stations is justone indicator: currently, China is building theequivalent of two 500-MW coal-fired electricgenerating units each week, which is roughlyequivalent to building the entire electricalproduction capacity of the United Kingdomeach year! Another indicator of China’s growthis GDP. China experienced increases in GDP ofabout 10 percent in 2004, 2005, and 2006, andabout 11 percent in 2007.From 2004 to 2007, the combination ofsignificant increases in demand for materials forheavy construction and the historic accelerationin demand and resulting high price of oil hasfurther contributed to dramatic increases in theescalation of costs of major equipment and plantconstruction materials. As shown in Figure 2.1,the price of oil ranged from US 10/barrel toUS 30/barrel from January 1989 to January2004 and then began climbing at accelerated andhistoric rates to US 106/barrel in March 2008.Table 2.1 shows the historical annual averagecompound escalation for specific power-plantrelated equipment and materials for the UnitedStates, India, and Romania. The table showstwo periods: January 1996 through December 2003; andJanuary 2004 through December 2007.These periods reflect the time beforeand after the significant increase in heavyconstruction projects and the acceleratedescalation in the prices of crude oil and refinedpetroleum products. A comparison of the two3
STUDY OF EQUIPMENT PRICES IN THE POWER SECTORFigure 2.1Average Price of Crude Oil Worldwide100Price, US /barrel (Nominal US )9080706050403020100Jan Jan Jan Jan Jan Jan Jan Jan Jan Jan Jan Jan Jan Jan Jan Jan Jan Jan Jan Jan Jan Jan88 89 90 91 92 93 94 95 96 97 98 99 00 01 02 03 04 05 06 07 08 09dateSource: U.S. Energy Information Administration.periods shows the striking difference in annualescalation.The rightmost column in the table shows thecumulative percentage increase in the cost ofequipment and materials over the period fromJanuary 2004 through December 2007.The increase in escalation rates fromJanuary 2004 through December 2007 providesquantitative explanation for the 30–50 percentincrease between original project estimatesto bids actually received. The other driverof price increases is market-demand pricing.In other words, in the last few years, theglobal market has been in a situation wheredemand for power plant and infrastructureequipment and services has been higherthan the manufacturers’ capability to meetthe demand. The situation has resulted inequipment and engineering service pricingbased on what the market will bear rather thanon the actual cost of production (which consistsof materials and labor costs).The project team was not able to locate orobtain publicly available information on specificmanufacturer facility loading because in almostall cases this is proprietary information. Researchfirms sell publications that contain informationon overall shop capacity and lead times, butthis information is copyrighted and cannot bepublished in any publicly available reports.4However, even without benefit of thesepublications, there is enough evidence thatOEMs are pricing their equipment abovethe increase in the costs of raw materialsand labor costs, and above their “typical”profit margins. OEMs appear to be increasingtheir prices because of the overall increasein demand and the heavy loading of theirproduction lines.Although not specific to individualmanufacturers, industry news articles andpublications provide market projections thatindicate that price increases in commodities andmaterials will continue. The following are someexamples of contributing factors: It is predicted that Chinese and Indiandemand for commodities including coal andiron ore will continue at an annual rate of5 percent for the next 10 years.Chinese oil demand in 2007 was about 1.9 timesits domestic supply. By 2011, it is projectedthat demand will be 2.3 times domesticsupply. This will put increasing demandon the world’s oil supply, contributing tocontinued high prices for refined petroleumproducts. High costs of oil will put upwardpressures on commodities such as iron ore,nickel, and so forth, because of increasedmining and transportation costs.
Price Escalation, Cost Factors, and Market PricingTable 2.1RankingHistorical Average Annual Compound EscalationJan. 19
ºF degrees Fahrenheit FGD fl ue gas desulfurization FOB at point of production GDP gross domestic product GE General Electric GT gas turbine GTCC gas turbine combined cycle GTW Gas Turbine World GW gigawatt g/kWh grams per kilowatt-hour HHV higher heating value HP horsepower HRSG heat recovery steam generator