Transcription
Functions and Their GraphsJackie NicholasJanet HunterJacqui HargreavesMathematics Learning CentreUniversity of SydneyNSW 2006c 1999University of Sydney
Mathematics Learning Centre, University of SydneyiContents1 Functions1.121What is a function? . . . . . . . . . . . . . . . . . . . . . . . . . . . . . . .11.1.1Definition of a function . . . . . . . . . . . . . . . . . . . . . . . . .11.1.2The Vertical Line Test . . . . . . . . . . . . . . . . . . . . . . . . .21.1.3Domain of a function . . . . . . . . . . . . . . . . . . . . . . . . . .21.1.4Range of a function . . . . . . . . . . . . . . . . . . . . . . . . . . .21.2Specifying or restricting the domain of a function . . . . . . . . . . . . . .61.3The absolute value function . . . . . . . . . . . . . . . . . . . . . . . . . .71.4Exercises . . . . . . . . . . . . . . . . . . . . . . . . . . . . . . . . . . . . .8More about functions2.111Modifying functions by shifting . . . . . . . . . . . . . . . . . . . . . . . . 112.1.1Vertical shift . . . . . . . . . . . . . . . . . . . . . . . . . . . . . . 112.1.2Horizontal shift . . . . . . . . . . . . . . . . . . . . . . . . . . . . . 112.2Modifying functions by stretching . . . . . . . . . . . . . . . . . . . . . . . 122.3Modifying functions by reflections . . . . . . . . . . . . . . . . . . . . . . . 132.3.1Reflection in the x-axis . . . . . . . . . . . . . . . . . . . . . . . . . 132.3.2Reflection in the y-axis . . . . . . . . . . . . . . . . . . . . . . . . . 132.4Other effects . . . . . . . . . . . . . . . . . . . . . . . . . . . . . . . . . . . 142.5Combining effects . . . . . . . . . . . . . . . . . . . . . . . . . . . . . . . . 142.6Graphing by addition of ordinates . . . . . . . . . . . . . . . . . . . . . . . 162.7Using graphs to solve equations . . . . . . . . . . . . . . . . . . . . . . . . 172.8Exercises . . . . . . . . . . . . . . . . . . . . . . . . . . . . . . . . . . . . . 192.9Even and odd functions. . . . . . . . . . . . . . . . . . . . . . . . . . . . 212.10 Increasing and decreasing functions . . . . . . . . . . . . . . . . . . . . . . 232.11 Exercises . . . . . . . . . . . . . . . . . . . . . . . . . . . . . . . . . . . . . 243 Piecewise functions and solving inequalities3.127Piecewise functions . . . . . . . . . . . . . . . . . . . . . . . . . . . . . . . 273.1.1Restricting the domain . . . . . . . . . . . . . . . . . . . . . . . . . 273.2Exercises . . . . . . . . . . . . . . . . . . . . . . . . . . . . . . . . . . . . . 293.3Inequalities . . . . . . . . . . . . . . . . . . . . . . . . . . . . . . . . . . . 323.4Exercises . . . . . . . . . . . . . . . . . . . . . . . . . . . . . . . . . . . . . 35
Mathematics Learning Centre, University of Sydney4 Polynomials4.1ii36Graphs of polynomials and their zeros . . . . . . . . . . . . . . . . . . . . 364.1.1Behaviour of polynomials when x is large . . . . . . . . . . . . . . 364.1.2Polynomial equations and their roots . . . . . . . . . . . . . . . . . 374.1.3Zeros of the quadratic polynomial . . . . . . . . . . . . . . . . . . . 374.1.4Zeros of cubic polynomials . . . . . . . . . . . . . . . . . . . . . . . 394.2Polynomials of higher degree . . . . . . . . . . . . . . . . . . . . . . . . . . 414.3Exercises . . . . . . . . . . . . . . . . . . . . . . . . . . . . . . . . . . . . . 424.4Factorising polynomials . . . . . . . . . . . . . . . . . . . . . . . . . . . . . 444.54.4.1Dividing polynomials . . . . . . . . . . . . . . . . . . . . . . . . . . 444.4.2The Remainder Theorem . . . . . . . . . . . . . . . . . . . . . . . . 454.4.3The Factor Theorem . . . . . . . . . . . . . . . . . . . . . . . . . . 46Exercises . . . . . . . . . . . . . . . . . . . . . . . . . . . . . . . . . . . . . 495 Solutions to exercises50
1Mathematics Learning Centre, University of Sydney1FunctionsIn this Chapter we will cover various aspects of functions. We will look at the definition ofa function, the domain and range of a function, what we mean by specifying the domainof a function and absolute value function.1.1What is a function?1.1.1Definition of a functionA function f from a set of elements X to a set of elements Y is a rule thatassigns to each element x in X exactly one element y in Y .One way to demonstrate the meaning of this definition is by using arrow diagrams.X1YfX521Yg52633334242f : X Y is a function. Every elementin X has associated with it exactly oneelement of Y .g : X Y is not a function. The element 1 in set X is assigned two elements,5 and 6 in set Y .A function can also be described as a set of ordered pairs (x, y) such that for any x-value inthe set, there is only one y-value. This means that there cannot be any repeated x-valueswith different y-values.The examples above can be described by the following sets of ordered pairs.F {(1,5),(3,3),(2,3),(4,2)} is a function.G {(1,5),(4,2),(2,3),(3,3),(1,6)} is nota function.The definition we have given is a general one. While in the examples we have used numbersas elements of X and Y , there is no reason why this must be so. However, in these noteswe will only consider functions where X and Y are subsets of the real numbers.In this setting, we often describe a function using the rule, y f (x), and create a graphof that function by plotting the ordered pairs (x, f (x)) on the Cartesian Plane. Thisgraphical representation allows us to use a test to decide whether or not we have thegraph of a function: The Vertical Line Test.
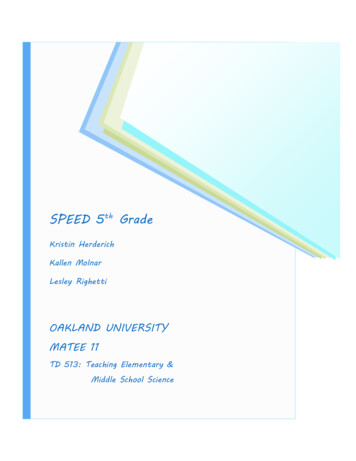
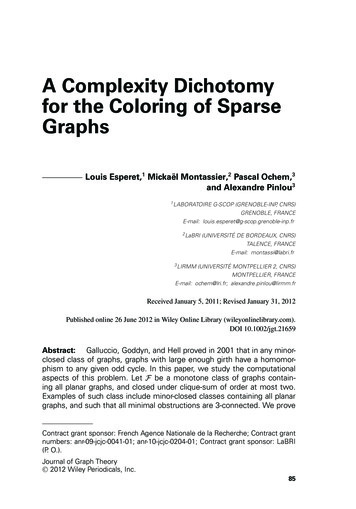
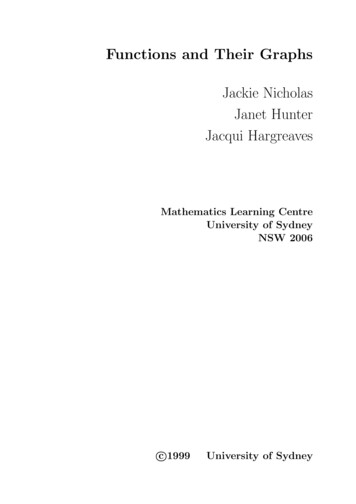
2Mathematics Learning Centre, University of Sydney1.1.2The Vertical Line TestThe Vertical Line Test states that if it is not possible to draw a vertical line through agraph so that it cuts the graph in more than one point, then the graph is a function.yyx0x0This is the graph of a function. All possible vertical lines will cut this graph onlyonce.1.1.3This is not the graph of a function. Thevertical line we have drawn cuts thegraph twice.Domain of a functionFor a function f : X Y the domain of f is the set X.This also corresponds to the set of x-values when we describe a function as a set of orderedpairs (x, y).If only the rule y f (x) is given, then the domain is taken to be the set of all real x forwhich the function is defined. For example, y x has domain; all real x 0. This issometimes referred to as the natural domain of the function.1.1.4Range of a functionFor a function f : X Y the range of f is the set of y-values such that y f (x) forsome x in X.This corresponds to the set of y-values when we describe a function as a set of orderedpairs (x, y). The function y x has range; all real y 0.Examplea. State the domain and range of y x 4.b. Sketch, showing significant features, the graph of y x 4.
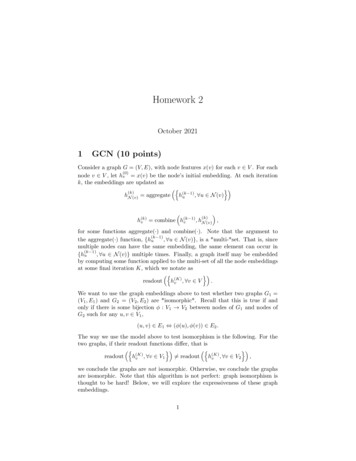
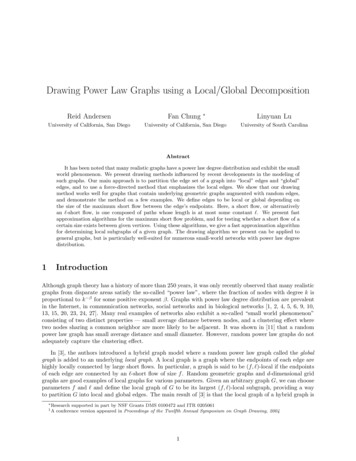
3Mathematics Learning Centre, University of SydneySolution a. The domain of y x 4 is all real x 4. We know that square root functions areonly defined for positive numbers so we require that x 4 0, ie x 4. We alsoknow that the square root functions are always positive so the range of y x 4 isall real y 0.b.y31x–4–3–2–1The graph of y 01x 4.Examplea. State the equation of the parabola sketched below, which has vertex (3, 3).y1x–202468–1–2–3b. Find the domain and range of this function.Solutiona. The equation of the parabola is y x2 6x.3b. The domain of this parabola is all real x. The range is all real y 3.ExampleSketch x2 y 2 16 and explain why it is not the graph of a function.Solutionx2 y 2 16 is not a function as it fails the vertical line test. For example, when x 0y 4.
4Mathematics Learning Centre, University of Sydneyy42x–2–4024–2–4The graph of x2 y 2 16.ExampleSketch the graph of f (x) 3x x2 and finda. the domain and rangeb. f (q)c. f (x2 )d.f (2 h) f (2),hh 0.Solutiony21x–10123The graph of f (x) 3x x2 .a. The domain is all real x. The range is all real y where y 2.25.b. f (q) 3q q 2
5Mathematics Learning Centre, University of Sydney2c. f (x2 ) 3(x2 ) (x2 ) 3x2 x4d.f (2 h) f (2)(3(2 h) (2 h)2 ) (3(2) (2)2 ) hh 6 3h (h2 4h 4) 2h h2 hh h 1ExampleSketch the graph of the function f (x) (x 1)2 1 and show that f (p) f (2 p).Illustrate this result on your graph by choosing one value of p.Solution6y42x–2024The graph of f (x) (x 1)2 1.f (2 p) ((2 p) 1)2 1 (1 p)2 1 (p 1)2 1 f (p)
6Mathematics Learning Centre, University of Sydney6y42x–2024The sketch illustrates the relationship f (p) f (2 p) for p 1. If p 1 then2 p 2 ( 1) 3, and f ( 1) f (3).1.2Specifying or restricting the domain of a functionWe sometimes give the rule y f (x) along with the domain of definition. This domainmay not necessarily be the natural domain. For example, if we have the functiony x2for0 x 2then the domain is given as 0 x 2. The natural domain has been restricted to thesubinterval 0 x 2.Consequently, the range of this function is all real y where 0 y 4. We can bestillustrate this by sketching the graph.4y2x–1012The graph of y x2 for 0 x 2.
7Mathematics Learning Centre, University of Sydney1.3The absolute value functionBefore we define the absolute value function we will review the definition of the absolutevalue of a number.The Absolute value of a number x is written x and is defined as x x if x 0 x x if x 0.orThat is, 4 4 since 4 is positive, but 2 2 since 2 is negative.We can also think of x geometrically as the distance of x from 0 on the number line. –2 2–2 4 404More generally, x a can be thought of as the distance of x from a on the numberline. a – x x – a axNote that a x x a .The absolute value function is written as y x .We define this function as y x if x 0 x if x 0From this definition we can graph the function by taking each part separately. The graphof y x is given below.y2y –xx 01y xx 0x–2–101The graph of y x .2
8Mathematics Learning Centre, University of SydneyExampleSketch the graph of y x 2 .SolutionFor y x 2 we havey (x 2) when x 2 0orx 2 (x 2) when x 2 0orx 2That is,y x 2 x 2 for x 2for x 2Hence we can draw the graph in two parts.y21y –x 2 x 2y x–2 x 2x01234The graph of y x 2 .We could have sketched this graph by first of all sketching the graph of y x 2 andthen reflecting the negative part in the x-axis. We will use this fact to sketch graphs ofthis type in Chapter 2.1.4Exercises1. a. State the domain and range of f (x) b. Sketch the graph of y 9 x2 . 2. Given ψ(x) x2 5, find, in simplest form,9 x2 .ψ(x h) ψ(x)hh 0.3. Sketch the following functions stating the domain and range of each:
Mathematics Learning Centre, University of Sydneya. y 9x 1b. y 2x c. y 1x 4d. y 2x 1.4. a. Find the perpendicular distance from (0, 0) to the line x y k 0b. If the line x y k 0 cuts the circle x2 y 2 4 in two distinct points, find therestrictions on k.5. Sketch the following, showing their important features.a. y x12b. y 2 x2 .6. Explain the meanings of function, domain and range. Discuss whether or not y 2 x3is a function.7. Sketch the following relations, showing all intercepts and features. State which onesare functions giving their domain and range. a. y 4 x2b. x y 0c. y x3d. y x,x x 0e. y x.8. If A(x) x2 2 1,x2x 0, prove that A(p) A( p1 ) for all p 0.9. Write down the values of x which are not in the domain of the following functions: a. f (x) x2 4xb. g(x) xx2 110. If φ(x) log xx 1 , find in simplest form:a. φ(3) φ(4) φ(5)b. φ(3) φ(4) φ(5) · · · φ(n)11. a. If y x2 2x and x (z 2)2 , find y when z 3.b. Given L(x) 2x 1 and M (x) x2 x, findi.L(M (x))ii. M (L(x))
10Mathematics Learning Centre, University of Sydney12. Using the sketches, find the value(s) of the constants in the given equations:y5y2x–101(–2,1)(2,1)1–2x–2y ax2 by 13. a. Define a , the absolute value of a, where a is real.b. Sketch the relation x y 1.14. Given that S(n) n,2n 1find an expression for S(n 1).Hence show that S(n) S(n 1) 01.(2n 1)(2n 1)abx2 12
11Mathematics Learning Centre, University of Sydney2More about functionsIn this Chapter we will look at the effects of stretching, shifting and reflecting the basicfunctions, y x2 , y x3 , y x1 , y x , y ax , x2 y 2 r2 . We will introduce theconcepts of even and odd functions, increasing and decreasing functions and will solveequations using graphs.2.12.1.1Modifying functions by shiftingVertical shiftWe can draw the graph of y f (x) k from the graph of y f (x) as the addition ofthe constant k produces a vertical shift. That is, adding a constant to a function movesthe graph up k units if k 0 or down k units if k 0. For example, we can sketch thefunction y x2 3 from our knowledge of y x2 by shifting the graph of y x2 downby 3 units. That is, if f (x) x2 then f (x) 3 x2 3.3yy x2(1,1)y x 2– 3x–2–1012(1,–2)–3We can also write y f (x) 3 as y 3 f (x), so replacing y by y 3 in y f (x) alsoshifts the graph down by 3 units.2.1.2Horizontal shiftWe can draw the graph of y f (x a) if we know the graph of y f (x) as placing theconstant a inside the brackets produces a horizontal shift. If we replace x by x a insidethe function then the graph will shift to the left by a units if a 0 and to the right by aunits if a 0.
12Mathematics Learning Centre, University of Sydney1For example we can sketch the graph of y x 2from our knowledge of y x1 by shifting1.this graph to the right by 2 units. That is, if f (x) x1 then f (x 2) x Note that the function y to (1, 3).2.21x 2is not defined at x 2. The point (1, 1) has been shiftedModifying functions by stretchingWe can sketch the graph of a function y bf (x) (b 0) if we know the graph of y f (x)as multiplying by the constant b will have the effect of stretching the graph in the ydirection by a factor of b. That is, multiplying f (x) by b will change all of the y-valuesproportionally.For example, we can sketch y 2x2 from our knowledge of y x2 as follows:yy2(1,2)2(1,1)11x–10The graph of y x2 .1x–101The graph of y 2x2 . Note, all the yvalues have been multiplied by 2, but thex-values are unchanged.We can sketch the graph of y 12 x2 from our knowledge of y x2 as follows:
13Mathematics Learning Centre, University of Sydneyyy22(1,1)11(1,1/2)x–101–1The graph of y x2 .2.32.3.1x01The graph of y 12 x2 . Note, all they-values have been multiplied by 12 , butthe x-values are unchanged.Modifying functions by reflectionsReflection in the x-axisWe can sketch the function y f (x) if we know the graph of y f (x), as a minus signin front of f (x) has the effect of reflecting the whole graph in the x-axis. (Think of thex-axis as a mirror.) For example, we can sketch y x from our knowledge of y x .yyx2–1011x–101The graph of y x .2.3.2The graph of y x . It is the reflection of y x in the x-axis.Reflection in the y-axisWe can sketch the graph of y f ( x) if we know the graph of y f (x) as the graph ofy f ( x) is the reflection of y f (x) in the y-axis.
14Mathematics Learning Centre, University of SydneyFor example, we can sketch y 3 x from our knowledge of y 3x .yy2211x–101–1The graph of y 3x .2.4x01The graph of y 3 x . It is the reflectionof y 3x in the y-axis.Other effectsWe can sketch the graph of y f (x) if we know the graph of y f (x) as the effect of theabsolute value is to reflect all of the negative values of f (x) in the x-axis. For example,we can sketch the graph of y x2 3 from our knowledge of the graph of y x2 3.yy24x–1012x–3The graph of y x2 3.2.5–101The graph of y x2 3 . The negativevalues of y x2 3 have been reflectedin the x-axis.Combining effectsWe can use all the above techniques to graph more complex functions. For example, wecan sketch the graph of y 2 (x 1)2 from the graph of y x2 provided we can analysethe combined effects of the modifications. Replacing x by x 1 (or x ( 1)) moves the
15Mathematics Learning Centre, University of Sydneygraph to the left by 1 unit. The effect of the sign in front of the brackets turns thegraph up side down. The effect of adding 2 moves the graph up 2 units. We can illustratethese effects in the following diagrams.yy2211x–101The graph of y x2 .–1–10The graph of y (x 1)2 . The graphof y x2 has been shifted 1 unit to theleft.y–2x–2y2x01–1–2The graph of y (x 1)2 . The graphof y (x 1)2 has been reflected in thex-axis.x–2–10The graph of y 2 (x 1)2 . The graphof y (x 1)2 has been shifted up by2 units.Similarly, we can sketch the graph of (x h)2 (y k)2 r2 from the graph of x2 y 2 r2 .Replacing x by x h shifts the graph sideways h units. Replacing y by y k shifts thegraph up or down k units. (We remarked before that y f (x) k could be written asy k f (x).)For example, we can use the graph of the circle of radius 3, x2 y 2 9, to sketch thegraph of (x 2)2 (y 4)2 9.
16Mathematics Learning Centre, University of Sydneyy42x–4–2024–2–4The graph of x2 y 2 9.This is a circle centre (0, 0), radius ��4)(2,–7)The graph of (x 2)2 (y 4)2 9.This is a circle centre (2, 4), radius 3.Replacing x by x 2 has the effect of shifting the graph of x2 y 2 9 two units to theright. Replacing y by y 4 shifts it down 4 units.2.6Graphing by addition of ordinatesWe can sketch the graph of functions such as y x x 2 by drawing the graphs ofboth y x and y x 2 on the same axes then adding the corresponding y-values.
17Mathematics Learning Centre, University of Sydneyy4y x – 2 2y x –2024x64x6y42–202The graph of y x x 2 .At each point of x the y-values of y x and y x 2 have been added. This allowsus to sketch the graph of y x x 2 .This technique for sketching graphs is very useful for sketching the graph of the sum oftwo trigonometric functions.2.7Using graphs to solve equationsWe can solve equations of the form f (x) k by sketching y f (x) and the horizontal liney k on the same axes. The solution to the equation f (x) k is found by determiningthe x-values of any points of intersection of the two graphs.
18Mathematics Learning Centre, University of SydneyFor example, to solve x 3 2 we sketch y x 3 and y 2 on the same axes.y4(1,2)2(5,2)x–20246The x-values of the points of intersection are 1 and 5. Therefore x 3 2 when x 1or x 5.ExampleThe graph of y f (x) is sketched below.y2–101234x–2–4(3,–4)For what values of k does the equation f (x) k have1. 1 solution2. 2 solutions3. 3 solutions?SolutionIf we draw a horizontal line y k across the graph y f (x), it will intersect once whenk 0 or k 4, twice when k 0 or k 4 and three times when 4 k 0.Therefore the equation f (x) k will have
19Mathematics Learning Centre, University of Sydney1. 1 solution if k 0 or k 42. 2 solutions if k 0 or k 43. 3 solutions if 4 k 0.2.8Exercises1. Sketch the following:a.y x2b.y 13 x2c.y x2d.y (x 1)22. Sketch the following:a.y 1xb.y 2xy x3 2 c.y 3 (x 1)3y 2 x 2 c.y 4 x y 1x 2c.d.y 1x 1 23. Sketch the following:a.y x3b.4. Sketch the following:a.y x b.5. Sketch the following:a.x2 y 2 166. Sketch the following: a. y 9 x27. Show thatb.x2 (y 2)2 16b.y x 11 1.x 2x 2Hence sketch the graph of y 8. Sketch y 9 (x 1)2c.(x 1)2 (y 3)2 16c.y 9 x2 3x 1.x 2x 1.x 19. Graph the following relations in the given interval:a. y x x 1 for 2 x 2 [Hint: Sketch by adding ordinates]b. y x x 1 for 2 x 3c. y 2x 2 x for 2 x 2d. x y 1 for 1 x 3.10. Sketch the function f (x) x2 1 1.
20Mathematics Learning Centre, University of Sydney11. Given y f (x) as sketched below, sketcha. y 2f (x)b. y f (x)c. y f ( x)d. y f (x) 4e. y f (x 3)f. y f (x 1) 2g. y 3 2f (x 3)h. y f (x) yx–301.5–212. By sketching graphs solve the following equations:a. 2x 4b.1x 23 1c. x x2d. x2 1x13. Solve x 2 3.a. algebraicallyb. geometrically.14. The parabolas y (x 1)2 and y (x 3)2 intersect at a point P . Find thecoordinates of P .15. Sketch the circle x2 y 2 2x 14y 25 0. [Hint: Complete the squares.] Findthe values of k, so that the line y k intersects the circle in two distinct points.16. Solve45 x 1, using a graph.17. Find all real numbers x for which x 2 x 2 .18. Given that Q(p) p2 p, find possible values of n if Q(n) 2.19. Solve x 4 2x.a. algebraicallyb. geometrically.
21Mathematics Learning Centre, University of Sydney2.9Even and odd functionsDefinition:A function, y f (x), is even if f (x) f ( x) for all x in the domain of f .Geometrically, an even function is symmetrical about the y-axis (it has line symmetry).The function f (x) x2 is an even function as f ( x) ( x)2 x2 f (x) for all valuesof x. We illustrate this on the following graph.y42x–2–x–101x2The graph of y x2 .Definition:A function, y f (x), is odd if f ( x) f (x) for all x in the domain of f .Geometrically, an odd function is symmetrical about the origin (it has rotational symmetry).The function f (x) x is an odd function as f ( x) x f (x) for all values of x.This is illustrated on the following graph.yy1x–x–2–101–1–yThe graph of y x.x2
22Mathematics Learning Centre, University of SydneyExampleDecide whether the following functions are even, odd or neither.1. f (x) 3x2 42. g(x) 12x3. f (x) x3 x2 .Solution1.f ( x) 3( x)2 4 3x2 4 f (x)The function f (x) 3x2 4 is even.2.g( x) 111 g(x)2( x) 2x2xTherefore, the function g is odd.3.f ( x) ( x)3 ( x)2 x3 x2This function is neither even (since x3 x2 x3 x2 ) nor odd (since x3 x2 (x3 x2 )).ExampleSketched below is part of the graph of y f (x).yx0Complete the graph if y f (x) is1. odd2. even.
23Mathematics Learning Centre, University of SydneySolutionyx0y f (x) is an odd function.yx0y f (x) is an even function.2.10Increasing and decreasing functionsHere we will introduce the concepts of increasing and decreasing functions. In Chapter 5we will relate these concepts to the derivative of a function.Definition:A function is increasing on an interval I, if for all a and b in I such that a b,f (a) f (b).The function y 2x is an example of a function that is increasing over its domain. Thefunction y x2 is increasing for all real x 0.
24Mathematics Learning Centre, University of Sydneyyy24f(b)12f(a)xx0–11The graph of y 2x . This function isincreasing for all real x.a01 bThe graph of y x2 . This function isincreasing on the interval x 0.Notice that when a function is increasing it has a positive slope.Definition:A graph is decreasing on an interval I, if for all a and b in I such that a b,f (a) f (b).The function y 2 x is decreasing over its domain. The function y x2 is decreasing onthe interval x 0.yy22f(a)11f(b)x–101The graph of y 2 x . This function isdecreasing for all real x.xa –1 b0The graph of y x2 . This function isdecreasing on the interval x 0.Notice that if a function is decreasing then it has negative slope.2.11Exercises1. Given the graph below of y f (x):a. State the domain and range.b. Where is the graph1
25Mathematics Learning Centre, University of Sydneyi. increasing?ii. decreasing?c. if ki.ii.iii.iv.v.is a constant, find the values of k such that f (x) k hasno solutions1 solution2 solutions3 solutions4 solutions.d. Is y f (x) even, odd or neither?yx–40–242–22. Complete the following functions if they are defined to be (a) eveny(b) odd.yx0x0y f (x)y g(x)3. Determine whether the following functions are odd, even or neither. b. y 4 x2c. y 2xd. y x3 3xa. y x4 2e. y i.xx2y 2x 2 x1 4g.f.y j.y x 1 x 1 x2y 4. Given y f (x) is even and y g(x) is odd, provea. if h(x) f (x) · g(x) then h(x) is oddb. if h(x) (g(x))2 then h(x) is evenx21 4h. y x3x 3
Mathematics Learning Centre, University of Sydneyc. if h(x) 26f (x), g(x) 0, then h(x) is oddg(x)d. if h(x) f (x) · (g(x))2 then h(x) is even.5. Consider the set of all odd functions which are defined at x 0. Can you prove thatfor every odd function in this set f (0) 0? If not, give a counter-example.
27Mathematics Learning Centre, University of Sydney3Piecewise functions and solving inequalitiesIn this Chapter we will discuss functions that are defined piecewise (sometimes calledpiecemeal functions) and look at solving inequalities using both algebraic and graphicaltechniques.3.13.1.1Piecewise functionsRestricting the domainIn Chapter 1 we saw how functions could be defined on a subinterval of their naturaldomain. This is frequently called restricting the domain of the function. In this Chapterwe will extend this idea to define functions piecewise.Sketch the graph of y 1 x2 for x 0.2 y1x–101–1The graph of y 1 x2 for x 0.Sketch the graph of y 1 x for x 0.y21x–101The graph of y 1 x for x 0.
28Mathematics Learning Centre, University of SydneyWe can now put these pieces together to define a function of the formf (x) 1 x2 for x 0 1 xfor x 0We say that this function is defined piecewise. First note that it is a function; each valueof x in the domain is assigned exactly one value of y. This is easy to see if we graph thefunction and use the vertical line test. We graph this function by graphing each piece ofit in turn.2 y1x0–11–1The graph shows that f defined in this way is a function. The two pieces of y f (x)meet so f is a continuous function.The absolute value function x x for x 0f (x) for x 0is another example of a piecewise function.ExampleSketch the function x2 1 for x 0 2f (x) for x 0
29Mathematics Learning Centre, University of SydneySolutiony21x–20–112This function is not continuous at x 0 as the two branches of the graph do not meet.Notice that we have put an open square (or circle) around the point (0, 2) and a solidsquare (or circle) around the point (0, 1). This is to make it absolutely clear that f (0) 1and not 2. When defining a function piecewise, we must be extremely careful to assignto each x exactly one value of y.3.2Exercises1. For the function 1 x2 for x 0 1 xf (x) for x 0evaluatea. 2f ( 1) f (2)b. f (a2 )2. For the function given in 1, solve f (x) 2.3. Below is the graph of y g(x). Write down the rules which define g(x) given thatits pieces are hyperbolic, circular and linear.
30Mathematics Learning Centre, University of Sydneyy1x–3–2–11–1–24. a. Sketch the graph of y f (x) if 4 x2 for 2 x 0 x2 4f (x) for x 0b. State the range of f .c. Solvei. f (x) 0ii. f (x) 3.d. Find k if f (x) k hasi. 0ii. 1iii. 2 solutions.5. Sketch the graph of y f (x) iff (x) 1 x 1 for x 0 x 1 for x 06. Sketch the graph of y g(x) if 2 x 2g(x) 2 2xfor x 1for 1 x 1for x 123
31Mathematics Learning Centre, University of Sydney7. McMaths burgers are to modernise their logo as shown below.y3x–6–3036Write down a piecewise function that represents this function using (a) 4 (b) 3 (c) 2pieces (i.e. rules that define the function).8. a. The following piecewise function is of the form ax2 b for 0 x 2 cx df (x) 4for x 2y(4,4)2x–4–2024–2–4Determine the values of a, b, c and d.b. Complete the graph so that f (x) is an odd function defined for all real x, x 0.c. Write down the equations that now define f (x), x 0.
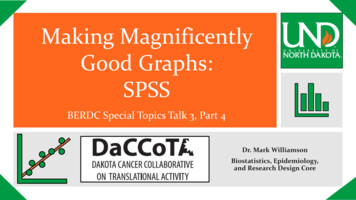
32Mathematics Learning Centre, University of Sydney3.3InequalitiesWe can solve inequalities using both algebraic and graphical methods. Sometimes it iseasier to use an algebraic method and sometimes a graphical one. For the followingexamples we will use both, as this allows us to make the connections between the algebraand the graphs.Algebraic methodGraphical method1. Solve 3 2x 1.This is a (2 Unit) linear inequality.Remember to reverse the inequalitysign when multiplying or dividingby a negative number.3 2x 1 2x 2x 13y(1,1)x012When is the line y 3 2x above oron the horizontal line y 1 ? From thegraph, we see that this is true for x 1.2. Solve x2 4x 3 0.This is a (2 Unit) quadratic inequality. Factorise and use a number line.Let y x2 4x 3.y3x2 4x 3 0(x 3)(x 1) 01The critical values are 1 and 3,which divide the number line intothree intervals. We take points ineach interval to determine the signof the inequality; eg use x 0,x 2 and x 4 as test values.positive–10negative12positive34Thus, the solution is 1 x 3.x013When does the parabola have negativey-values? OR When is the parabola under the x-axis? From the graph, we seethat this happens when 1 x 3.
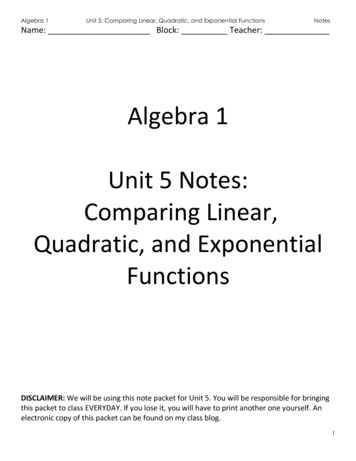
33Mathematics Learning Centre, University of Sydney13. Solve x 4 1.This is a 3 Unit inequality. Thereis a variable in the denominator.Remember that a denominator cannever be zero, so in this case x 4.First multiply by the square of thedenominatorx 4x 400 12345y–2(5,1)26x–1neg positivepositive1.x 41(x 4)2 , x 4x2 8x 16x2 9x 20(x 4)(x 5)Mark the critical values on the number line and test x 0, x 4.5 andx 6.0Let y 61is not defined for x 4. Ity x 4is a hyperbola with vertical asymptoteat x 4. To solve our inequality weneed to find the values of x for whichthe hyperbola lies on or under the liney 1. (5, 1) is the point of intersection.1So, from the graph we see that x 4 1when x 4 or x 5.Therefore, x 4 or x 5.4. Solve x 3 10.xConsider x 3 10,xMultiply by x we getx 0.Sketch y x 3 and then y 10. Notexthat second of these functions is not defined for x 0.yx2 3x 10x2 3x 10 0(x 5)(x 2) 0Therefore, the critical values
0 x y y 0 x Mathematics Learning Centre, University of Sydney 2 1.1.2 The Vertical Line Test The Vertical Line Test states that if it is not possible to draw a vertical line through a graph so that it cuts the graph in more than one point, then the graph is a function. Thisisthegraphofafunction.