Transcription
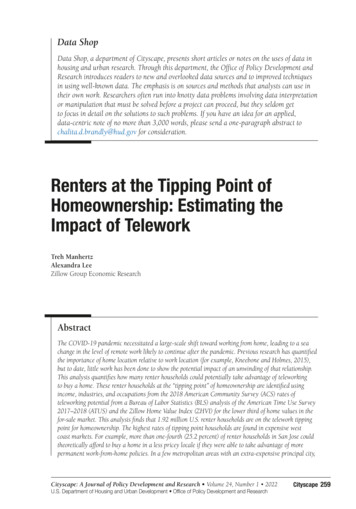
Data Shopby Treh Manhertz and Alexandra LeeData Shop, a department of Cityscape, presents short articles or notes on the uses of data inhousing and urban research. Through this department, the Office of Policy Development andResearch introduces readers to new and overlooked data sources and to improved techniquesin using well-known data. The emphasis is on sources and methods that analysts can use intheir own work. Researchers often run into knotty data problems involving data interpretationor manipulation that must be solved before a project can proceed, but they seldom getto focus in detail on the solutions to such problems. If you have an idea for an applied,data-centric note of no more than 3,000 words, please send a one-paragraph abstract tochalita.d.brandly@hud.gov for consideration.Renters at the Tipping Point ofHomeownership: Estimating theImpact of TeleworkTreh ManhertzAlexandra LeeZillow Group Economic ResearchAbstractThe COVID-19 pandemic necessitated a large-scale shift toward working from home, leading to a seachange in the level of remote work likely to continue after the pandemic. Previous research has quantifiedthe importance of home location relative to work location (for example, Kneebone and Holmes, 2015),but to date, little work has been done to show the potential impact of an unwinding of that relationship.This analysis quantifies how many renter households could potentially take advantage of teleworkingto buy a home. These renter households at the “tipping point” of homeownership are identified usingincome, industries, and occupations from the 2018 American Community Survey (ACS) rates ofteleworking potential from a Bureau of Labor Statistics (BLS) analysis of the American Time Use Survey2017–2018 (ATUS) and the Zillow Home Value Index (ZHVI) for the lower third of home values in thefor-sale market. This analysis finds that 1.92 million U.S. renter households are on the telework tippingpoint for homeownership. The highest rates of tipping point households are found in expensive westcoast markets. For example, more than one-fourth (25.2 percent) of renter households in San Jose couldtheoretically afford to buy a home in a less pricey locale if they were able to take advantage of morepermanent work-from-home policies. In a few metropolitan areas with an extra-expensive principal city,Cityscape: A Journal of Policy Development and Research Volume 24, Number 1 2022U.S. Department of Housing and Urban Development Office of Policy Development and ResearchCityscape 259
Manhertz and LeeAbstract (continued)a sizable share of renter households would have an additional incentive to move to the suburbs—up to10.4 percent of renter households in the city of San Francisco. Nationwide, Asian renter households havethe highest share at the tipping point (9.0 percent), followed by Latinx (5.0 percent), White (4.1 percent),and Black (3.7 percent) renter households. This finding means that the Asian homeownership rate is mostlikely to have observable increases due to telework. Across metropolitan areas, Black renter householdsare typically more likely to be at the tipping point (29.0 percent more likely than other racial groups),and Latinx renter households are far less likely (26.2 percent less likely than other racial groups).IntroductionThis article estimates the number of renter households that are at the “telework tipping point” ofhomeownership—renter households with both high enough incomes to afford the typical starterhome outside their city or metropolitan area and employed in “remotable jobs”—jobs that can beperformed remotely, that would theoretically allow them to move outside their city or metropolitanarea. This analysis examines the magnitude of this set of renter households across metropolitanareas and race categories to determine the potential impact this shift to telework may have onhomeownership trends.A household’s choice in housing location has long been tied to employment—in fact, theboundaries of metropolitan areas, as delineated by the Office of Management and Budget (OMB),are determined by commuting patterns. According to OMB, metropolitan and micropolitanstatistical areas constitute densely urbanized areas plus “adjacent territory that has a high degree ofsocial and economic integration with the core as measured by commuting ties.”1 In a 2019 Zillowsurvey, renters, buyers, and sellers all said the longest (one-way) commute they would be willingto accept when considering a new home or job was 30 minutes.2 The close ties between housingand employment could be observed in the negative housing price gradient with respect to citycenters in many metropolitan areas—the closer to the urban core, the higher the price premium onhomes (Arribas-Bel and Sanz-Gracia, 2014; Fujita, 1989). Close access to employment, proximityto services and amenities, and access to cultural and social opportunities have made urban coresattractive (and more expensive) areas to live in many metropolitan areas relative to outlying areas.The COVID-19 pandemic suddenly and rapidly loosened those ties between home and work,however. Pew Research found that by October 2020, 71 percent of employed adults who workedin remotable jobs3 were working from home, compared with only 20 percent before the COVID-19For more information on metropolitan and micropolitan delineations see are this with the mean travel time to work of 27.6 minutes from the 2019 American Community Survey. Formore detail on Zillow’s survey on commute preferences, see: rkchtr-26506/.2Defined as “workers who say their job responsibilities can mainly be done from home”, totaling 38 percent ofworkers surveyed.3260 Data Shop
Renters at the Tipping Point of Homeownership: Estimating the Impact of Teleworkpandemic, with 54 percent saying they would still want to work from home after the pandemicends (Parker, Horowitz, and Minkin, 2020). An April 2021 poll from Gallup, Inc. found that amajority (51 percent) of U.S. workers overall were still working remotely. The incidence of remotework was concentrated in white-collar workers (72 percent)— particularly those employed incomputer/mathematical, media, life science, and financial/consulting fields, each of which hadmore than 80 percent of workers working remotely (Saad and Jones, 2021).It is no surprise, then, that metropolitan areas with high concentrations of these white-collarworkers experienced large shifts in housing demand throughout the pandemic. San Franciscoand New York experienced some of the largest declines in demand for for-sale homes in theirurban cores, and rents in urban areas fell steeply in these and other pricey metropolitan areas,including Seattle and Washington, D.C. (Casey, Lee, and Manhertz, 2021). The price premium fordense urban living in these areas evaporated as remote work rose and pandemic restrictions wereimposed on many amenities (Gupta et al., 2021; Ramani and Bloom, 2021).If work-from-home policies persist beyond the pandemic, scores of remote workers renting in thenation’s priciest metropolitan areas would theoretically be able to make the jump into homeownershipby moving to more affordable areas, taking advantage of the fact that they are no longer locationallytethered to a job. Not only could those renters move in theory, many of them seemingly did: duringthe past year, metropolitan areas, including Austin, Las Vegas, and Phoenix, that have long beenprime destinations for movers from pricey coastal markets have experienced unprecedented homeprice and rent appreciation (Bachaud and Lee, 2021). There was also a jump in demand for suburbanhomes within metropolitan areas with pricey urban cores, along with heightened demand for urbanhomes in metropolitan areas with cheaper urban cores (Casey, Lee, and Manhertz, 2021)DataOur objective is to estimate the population of renter households that can afford to buy a starterhome outside their metropolitan area but not within and who also work in occupations that areremotable, which theoretically allows them to move and become homeowners in more affordableareas. Our estimates rely on housing affordability data provided by Zillow, telework ability from theAmerican Time Use Survey, and income, race, industry, and occupation data from the AmericanCommunity Survey (ACS).Renter incomes, race, industry, and occupation came from the 2018 ACS 1-Year microdata,accessed via Integrated Public Use Microdata Series (IPUMS)-USA (Ruggles et al., 2019). TheACS is an annual survey providing insight into demographics, household structures, housingcharacteristics, community features, and more, which enables analysis of populations withinmetropolitan areas and city boundaries.Rates of teleworking potential came from a Bureau of Labor Statistics (BLS) analysis of theAmerican Time Use Survey (ATUS), which measures the time people spend doing various activities(Dey et al., 2020); a supplement to the 2017–2018 ATUS asked workers whether they could workat home. The authors used ability-to-telework rates by both industry and occupation to classifyrenter households in ACS by their industry and occupation.Cityscape 261
Manhertz and LeeHousing costs were provided by the Zillow Home Value Index (ZHVI),4 built from millions ofproperty-level estimates of home values—known as Zestimates5 —to provide a comprehensivemeasure of home values across various regions and price tiers. This analysis focuses onmetropolitan statistical area (MSA) and city-level, bottom-tier ZHVI, the typical value for homesthat fall within the 5th to 35th percentile of the empirical distribution for Zestimates in a givenregion—in other words, the median home value among homes with Zestimates in the 5th to 35thpercentile range. This bottom-tier measure was used to approximate the “starter home” segment ofhousing, which is likely the accessible price tier of homes for first-time homebuyers. The monthlypayment necessary to afford this bottom-tier ZHVI value is estimated assuming a 30-year, fixed-ratemortgage with a 3.0-percent interest rate and a 20-percent downpayment, plus estimated taxes,insurance, and homeowners association (HOA) dues. This estimation assumes property taxes of 0.8percent, insurance costs of 1,000 per year, and HOA as 1/1200th of the home’s value per month.MethodologyHousehold Telework AbilityThe ability to work from home in a given job was reported by the BLS at the individual leveland by broad industry classification and occupation classification separately. To estimate a givenhousehold’s ability to move, first an estimate of each earner’s individual probability of teleworkability is needed, based jointly on their industry and occupation. Using the distribution of jobs inthe ACS, the share of workers in each industry-occupation that could telework is estimated. First,the number of workers with remotable jobs in each industry was derived from the BLS estimatedindustry-level share who were able to telework and the count of workers in the ACS. That numberof jobs was then attributed to occupations within that industry based on the occupation-level shareable to telework, assuming conditional independence. By that method, those few working deskjobs in mostly onsite industries are still assigned a higher probability of being able to telework.A household’s ability to telework is assumed to be the income-weighted average of all earners’ability to telework, considering that a household may decide to move given only one member’schanging work situation and that the transition would likely be easier if the primary earnermaintained his or her job. In aggregate, those probabilities should sum to the total number ofhouseholds that could feasibly move if allowed to telework. For example, consider earners in atwo-earner renter household making 30,000 and 20,000 per year. The first earner is in a jobclassification (broad industry and occupation category) in which 50 percent of workers can workremotely, whereas the second earner is in a job classification in which only 10 percent can. Thisanalysis estimates that the household has a 34-percent chance of being able to take up teleworkto move and potentially buy—not that the less remotable earner is expected to be more able towork remotely, but the remotability of the higher earner would facilitate the move if the desire tomove were present. Although elements of household structure other than joint remotability of theearners’ jobs may have bearing on a household’s likelihood of moving, they are not factored in here.4See 019-deep-26226/ for detailed ZHVI methodology.5See https://www.zillow.com/z/zestimate/ for more information on Zestimates.262 Data Shop
Renters at the Tipping Point of Homeownership: Estimating the Impact of TeleworkAffordabilityThe population of interest in this study was renter households who, by virtue of income, are unableto buy a home in their current metropolitan area but could buy a home elsewhere. Householdswere categorized by their ability to afford a “starter home”—the average home value between the5th and 35th percentiles—in their metropolitan area and in the country at large. By that definition,the typical starter home nationally was worth about 131,700 in July 2020, and a starter homewas priced higher than that in 37 of the largest 50 metropolitan areas. In those metropolitanareas, a segment of renters exists who may be looking to buy but are precluded from buying intheir metropolitan area, although they could buy elsewhere. For example, a hypothetical renterhousehold in the Boston metropolitan area making 50,000 per year would be far short of thealmost 72,000 per year required to afford payments on the typical 352,000 starter home in themetropolitan area. The purchase of a starter home outside Boston would tend to cost the samehousehold only about 17 percent of its income, compared with 43 percent in the metropolitanarea. A starter home at the city level was also considered to determine the degree of ownershipbased outward movement that would be possible in America’s most expensive and concentratedcities. A household was considered able to afford a home if the monthly payments on that home’sestimated mortgage, insurance, taxes, and HOA or condo fees (given a 20-percent downpaymentand a 3-percent interest rate) totaled less than 30 percent of that household’s monthly income (thethreshold beyond which a household is considered “housing cost burdened”). Combining jobremotability and the affordability of buying a home, this analysis derives a number of householdson the telework tipping point of homeownership.RaceAlthough the ability to telework is doubtlessly intertwined with race, race was not used to estimateability to telework for the purposes of this study. The only channel for telework determination herewas a worker’s industry and occupation; thus, differences by race in the ability to telework shouldbe interpreted as differences in the propensity to be in remotable industries and occupations. Fourraces were considered in this evaluation, defined using general ACS race and ethnicity categories:Latinx/Hispanic and non-Hispanic Asian, Black, and White. Each household was assigned the raceof the household head. Renter households of different races were compared on the share of renterhouseholds on the telework tipping point for homeownership. Comparisons were made nationallyand at the metropolitan statistical area level.ResultsHousehold Telework AbilityIn the United States, the authors estimate that 32.6 percent of households are able to telework—asubstantially lower proportion than the 43.6 percent of individuals able to telework (Dey et al.,2020); a given individual’s ability to telework is counterbalanced at the household level by otherearners’ telework ability and income. Those households able to telework are theoretically freedto move if their remotable jobs continue to be remote indefinitely. Exhibit 1 illustrates that theshare of homeowners able to telework is uniformly higher than the share of renter householdsCityscape 263
Manhertz and Leeable to telework—across all racial groups. The rate is also higher among Asian and White renterhouseholds than among Black and Latinx renter households.Exhibit 1Households Able to Move if Allowed to Telework, by Renters and HomeownersRenter Households Able to TeleworkNationalAsianBlackLatinxWhiteHomeowner Households Able to TeleworkCount (#)Share (%)Count (#)Share 96,23420,554,48234.947.032.428.535.3Sources: American Community Survey; American Time Use SurveyThe ability to telework, income, and renter/homeownership status are all correlated, and thedifferences evident in exhibit 1 may be partly explained by differences in income for homeownersand renters. Among all households, only 14.4 percent earning less than 25,000 can telework,compared with a majority (51.1 percent) of households making more than 100,000 (exhibit 2).Exhibit 2Share of Renter Households that Could Telework, by Race and IncomeSources: American Community Survey; American Time Use SurveyAffordabilityAmong renters, 18.2 percent of households are unable to afford a monthly payment on a typicallocal starter home in their current metropolitan area but could afford the typical starter home pricedat or less than the national standard. For those households, the ability to telework might make thedifference between buying and continuing to rent. As shown in exhibit 3, many renter householdscan already afford the monthly payments on a home, but do not currently own. Possible reasonsthat renter households do not own a home although they can already afford to make the payments264 Data Shop
Renters at the Tipping Point of Homeownership: Estimating the Impact of Teleworkinclude insufficient down payment savings, a desire to enter at a higher price point, preference forrenting, or any number of other reasons.Exhibit 3Renter Households Able to Afford a Starter Home, Nationally and by RaceRenter Households Ableto Afford Buying in CurrentMetropolitan AreaNationalRenter Households Able toRenter Households Unable toAfford Buying Nationally but Not Afford Buying in Metropolitanin Current Metropolitan AreaArea or NationallyCount (#)Share (%)Count (#)Share (%)Count (#)Share .64,538,58127.31National figures exclude renter households in non-metropolitan areas.Sources: American Community Survey; Zillow1In the race breakout, a much higher share of Asian and Latinx renter households have incomesthat put them between the price points of their local starter homes and starter homes nationally.The share of renter households that can afford to buy a home nationally but not in their currentmetropolitan area is 24.8 percent and 26.1 percent among Asian and Latinx households,respectively, compared with only 18.2 percent among all renter households. This finding has alarge geographical component. More of these populations live in areas where local home prices arewell above national standards, thus there is more room to be in the middle (Manhertz, 2020)—that is to say, more of these populations live in areas where the bar to entry for homeownership isextremely high. For those households, the ability to telework has the largest potential impact.The Tipping Point6Looking at the intersection of renters that are (1) able to afford buying nationally but not in theircurrent metropolitan area and (2) able to telework, the authors find that a switch to more teleworkcould give 4.5 percent of renter households (1.92 million U.S. renters) the option to leave themetropolitan areas where they currently live and buy a starter home in a cheaper locale. That 18.2percent of renters—whose income would allow them to buy a starter home in the national marketbut not in their metropolitan area—have a lower rate of being able to telework than the nationalaverage, about 24.7 percent, yielding 4.5 percent on the telework tipping point.where p1is the national starter home value and p2 is the metropolitan area starter home value forrenter i.6See appendix A for full results of all metropolitan areas analyzed.Cityscape 265
Manhertz and LeeExhibit 4 shows that this share is higher, nationally, among Asian renter households (9.0 percent),followed by Latinx renter households (5.0 percent). Black renter households have the lowest shareon the tipping point nationally, at 3.7 percent. As discussed previously, geography plays a role. Thehigh share of Asian and Latinx renter households is attributable in large part to more membersof these communities living in more expensive markets, notably many California metropolitanareas. More than one third (35 percent) of the nation’s Asian households live in the New York, SanFrancisco, San Jose, or Los Angeles metropolitan areas—four markets that are home to only about12 percent of the nation’s total households (Lee, 2021). These groups are disproportionately unableto buy a home due to geography, which has historically been closely tied to work.At the metropolitan area level, Black renter households tend to have the highest share onthe telework tipping point for homeownership. This finding was true in 28 of the largest 50metropolitan areas that had any tipping point at all, and 8 of the largest 10.Exhibit 4Share of Renter Households at the Telework Tipping Point of Homeownership, by Race,Nationally and for the 10 Largest Metropolitan AreasAllAsianBlackLatinxWhiteUnited States4.5%9.0%3.7%5.0%4.1%New York, NY7.4%7.5%8.9%6.2%7.4%17.2%19.8%19.5%13.2%20.0%Los Angeles-Long BeachAnaheim, CAChicago, IL1.1%0.5%1.2%0.8%1.3%Dallas-Fort Worth, TX3.2%1.7%5.5%2.4%2.5%Philadelphia, PA1.2%1.3%1.6%0.7%1.2%Houston, TX1.6%1.2%2.5%0.9%1.7%Washington, D.C.8.6%7.0%10.0%6.7%8.3%Miami-Fort Lauderdale, FL3.1%3.0%3.7%2.7%3.2%Atlanta, GA2.2%1.4%2.5%2.0%2.1%Boston, MA10.3%11.1%12.5%7.3%10.6%Sources: American Community Survey; American Time Use Survey; ZillowThe share of a given group that is on the tipping point depends on both the job classificationand the incomes of renters; those renter households at the tipping point tend to hold lower- andmiddle-income desk jobs. Exhibit 5 shows that, more than any other race across metropolitanareas, Black renter households are the most likely to both earn an income that would allow themto achieve homeownership elsewhere and to earn that income in a job that is remotable. For eachrace, the plots separate the components of being on the tipping point in each metropolitan area.On the x-axis is the odds ratio of a worker of that race, relative to other races, being in the rightincome range to be at the tipping point, given that they are in a remotable job. On the y-axis isthe reverse, the odds ratio of a worker of that race, relative to other races, being in a remotablejob given that they are in the right income range to be at the tipping point. The graph showswhy certain races are more or less likely to be on the tipping point. White and Asian renters inremotable jobs clearly are less likely to be in the income range to have to move to buy a home—266 Data Shop
Renters at the Tipping Point of Homeownership: Estimating the Impact of Teleworkthat is, they have higher incomes. Also clear is that Latinx renters in the right income range are lesslikely to be working in remotable jobs and so less likely to be on the telework tipping point.Among large metropolitan areas, in fairly few did any group other than Black renter householdshave both a relatively high likelihood of telework given qualifying incomes and a high likelihood ofqualifying incomes given the ability to telework. At the median among the largest 50 metropolitanareas, Black renter households are 29 percent more likely than other renters to be able to buy theirfirst home in a less expensive area from which they could potentially telecommute to their currentjob. Asian, Latinx, and White renter households are 19 percent, 26.2 percent, and 0.6 percent lesslikely, respectively, than other renters to be able to telecommute and buy.Exhibit 5Likelihood of Qualifying Income (Remotable Jobs Only) and Likelihood of Remotable Job(Qualifying Incomes Only), Relative to Other RacesSources: American Community Survey; American Time Use Survey; ZillowNot all large metropolitan areas have entry-level price points higher than the United States. In thosemetropolitan areas (for example, Detroit, Kansas City, Memphis, Buffalo), no tipping point existsas defined in the study. Renter households there are generally no more likely to find an affordablefirst home to buy outside the metropolitan area than they are within it. Some of the densestmetropolitan areas, however, very clearly have two tipping points: one across the barrier to buyCityscape 267
Manhertz and Leea home in the metropolitan area overall and another across the barrier to buy a home specificallywithin the main job center of the metropolitan area (the reason for its density). A starter home isworth more in a metropolitan area’s namesake city than it is in the metropolitan area as a wholein 20 of the nation’s 50 largest metropolitan areas (and in 11 of the 27 metropolitan areas whereincome data were available on occupations at the city level). The degree of this principal city pricepremium varies greatly, and it is the relatively affordable starter homes (within the context of themetropolitan area) that separate Los Angeles and San Jose from San Francisco and Portland fromSeattle. Exhibit 6 shows the additional share of renter households in the city that are on the tippingpoint in their city, with a clear price incentive to move elsewhere in their metropolitan area. In SanFrancisco and Seattle, a large share of renter households currently living in the city could teleworkand buy a starter home outside the city but still within the metropolitan area (10.4 percent and 8.4percent, respectively). In Los Angeles and Portland, the share is much smaller (0.8 percent and 1.6percent, respectively). This steep gradient to homeownership can leave many more on the teleworktipping point in the most expensive cities; however, in many other cities—including Minneapolis,Phoenix, and Denver—a starter home within city limits is more affordable than in the largermetropolitan area, leaving city residents with no price incentive to leave for the suburbs.Exhibit 6Share of Renter Households at the Telework Tipping Point for a Typical Starter Home, byMetropolitan Area and City7Sources: American Community Survey; American Time Use Survey; ZillowExhibit 6 includes all of the largest 100 metropolitan areas for which city-level data were available for the principalcity. Groupings of metropolitan areas are based on tipping point outcomes and serve as an aid in intuition rather thana stringent classification.7268 Data Shop
Renters at the Tipping Point of Homeownership: Estimating the Impact of TeleworkLimitations and Potential for ExpansionThis study estimates the size of the subpopulation that is at a homeownership tipping point—able to take advantage of geographic flexibility from telework to pursue more affordablehomeownership opportunities. COVID-19 necessitated workplace flexibility, which willpotentially decouple employment and housing decisions. Remote work opens the possibilityof homeownership to a substantial number of households. Renters, who have fewer barriersto moving, could theoretically react faster to that change. Those on the cusp of buying a homehave also been given a new sense of urgency by the combination of historically low interest rates(which help keep monthly payments manageable, assuming an adequate downpayment has beensaved) and rising prices (which, for those saving for a downpayment, can feel like a moving target;today’s savings may be inadequate at tomorrow’s prices). In recent years, many people may havedecided to postpone homeownership to stay in or near a job center—a consideration that maybe less important today. This slice of data at the intersection of affordability and the new workenvironment is emblematic of the times, but it cannot reveal the whole picture, especially in thishighly controlled framework. The present research serves to identify the scale and direction ofincentives out of highly concentrated job and housing markets, but avenues to refine and expandon this work remain.One direction for future research is more complete use of the data. Both of the surveys used in thisresearch can be leveraged more fully to get a clearer picture of telework ability at the local level.The cited BLS article was the sole source used for identification of job remotability. More granularmapping of estimates from the ATUS to the ACS 5-year microdata would give a more precisepicture of local effects. The industry-occupation category mapping of remotability is insensitiveto age, income, geography, and race, which could all be informative. Job remotability was alsoconsidered to be binary, whether the individual worker “worked entirely at home on some days,”meaning that whether the employee could completely relocate or would still need or be required tobe physically present in an office with some regularity is uncertain. Further study could determinethe threshold of telework hours that implies fully remote work is possible at a finer level. Inaddition, as remote work and its adoption continue to evolve, the remotability of certain industriesand occupations may end up differing from the findings from the 2017–2018 ATUS supplementused; the pandemic likely spurred some industries and occupations in the direction of remotab
Renters at the Tipping Point of Homeownership: Estimating the Impact of Telework. Cityscape. 261. pandemic, with 54 percent saying they would still want to work from home after the pandemic ends (Parker, Horowitz, and Minkin, 2020). An April 2021 poll from Gallup, Inc. found that a majority (51 percent) of U.S. workers overall were still .