Transcription
SENIORSIN VANCOUVERa discussion paper prepared by the social policy Group, social developmentdepartment, city of VancouverOctober 2010
This report prepared by theSOCIAL POLICY DIVISIONCITY of VANCOUVEROur VisionThat all people in Vancouver are able to thrive in and contribute to a socially inclusive city.Our ValuesVancouver as a city within a liveable region; through the promotion of:AccessibilityLeadershipUrban CitizenshipEquity & FairnessSocial InclusionOur Operating onTeamworkPrimary Author: Anne Kloppenborg
executive summaryThe seniors’ population is growing locally and nation-wide.these seniors, along with ethno-cultural minority seniors, may faceCurrently at 13% of the population, seniors will representdiscrimination or added challenges in such programs as home25% of Canada’s population by 2036. Governments at all levelsneed to plan for this shift, and to develop increased servicesand supports for a growing number of older, more vulnerableseniors. With this context in mind, this report provides a snapshot of trends, services, and issues at the national, regional, andmunicipal levels, as well as possible future directions for policymakers and community stakeholders.support and residential care.The City of Vancouver has been active in providing services andsupports for seniors, including physical infrastructure initiatives tomake the city more age-friendly. The City also provides operatingfunding to Vancouver’s Community Centres, and annual grantsto assist Neighbourhood Houses and seniors’ groups. These threetypes of organizations have differing mandates and differentNationally, seniors’ incomes have been increasing and there arestrengths in their ability to engage and support seniors. Althoughfar fewer low income seniors now than 20 years ago. However,the City of Vancouver has not developed an overall seniors’ policy,unattached seniors, Aboriginal elders and older recent immi-its long term investment in these community resources, coupledgrants are much more likely to be low income than are otherwith the efforts of the non-profit groups themselves, has resultedseniors. Incidences of low income are highest among seniors inin a much more diverse array of outreach initiatives, peer counsel-Quebec and British Columbia.ing programs, and culturally inclusive programming than is avail-Life expectancy has also been improving nationwide, but thisalso means that there are more people – mainly older women –with chronic health conditions. The increase in older seniors hasalready meant increasing needs for help with personal care andincreasing pressures on family caregivers.While in many ways similar to the national picture, the trendssurrounding Vancouver’s seniors can differ markedly from bothable to seniors elsewhere in the Lower Mainland.A response to the future growth of Vancouver’s seniors’ population needs to take into account both the strengths and limitationsof our Community Centres, Neighbourhood Houses and seniors’groups. One significant limitation is the absence of any provincialfunding support for community-based seniors’ programs. Whilethe Province is a significant contributor to community programsthe national and the BC averages. The most marked differencefor children, families, at risk youth and other groups, its lack ofbetween Metro Vancouver and the rest of the country is in thesupport for seniors’ programs means that Neighbourhood Housespercentage of visible minority seniors who represent 7.2% of alland seniors’ groups in particular have a constant struggle to patchseniors in Canada; 13.4 % of BC seniors; and 25.9% of Vancouvertogether and maintain their services. While volunteers are key toarea seniors.seniors’ services, volunteers cannot do it all. Because much of theSeniors benefit from federal, provincial, and municipal policiesand programs but are also negatively affected by program deficiencies, lack of coordination among some programs, and cutbacks. Low income seniors are vulnerable to food insecurity andimpetus for existing seniors’ services has come from the community, and then been supported by the City, city neighbourhoodswhich historically have had less community capacity than othersmay have fewer resources for seniors.increased health risks. In Vancouver, the pressure on senior rent-The City has limited resources, but also has a strong basis in itsers is compounded by high rental costs and low vacancy rates.existing Community Centres, Neighbourhood Houses and seniors’Federal cutbacks in health transfers have lead to provincialgroups. The City can continue to support community organiza-cutbacks in acute care and restrictions in the availability of bothtions in their work to engage residents, help seniors to access gov-home support and residential care for seniors. While many non-ernment services/systems, and build programs which include andprofit community groups in Vancouver are supporting servicesbenefit from the contributions of all seniors. As the City has doneand programs which welcome culturally diverse seniors, govern-in the development of service “hubs” for children and youth, itment services have not developed the same degree of culturalcan play a role in working with the community to develop servicecompetence. There are relatively few programs in Vancouvermodels and governance structures to strengthen seniors’ servicesspecifically geared to Aboriginal Elders or to LGBTQ seniors andand the contributions of seniors to the community.
INTRODUCTION 11 seniors: a national context 331.2 health and well-being 41.3 retirement and volunteering 52.1 demographics 772.2 where seniors live 82.3 economic security 102.4 health 102.5 cultural diversity 112.6 aboriginal elders 113 issues 3.1 economic security 12123.2 health care system and services 133.3 home support and housing 143.4 transportation 163.5 other social issues 173.6 diversity 174 roles of upper level governments 195 current city of vancouver roles 215.1 the physical city: current initiatives 215.2 future city roles: issues for discussion 26CONTENTS2 seniors: the vancouver context TABLE OF1.1 seniors’ incomes
“The seniors’ populationis growing and it isimportant to understandthe demographic trendsand issues that affectolder people”
This paper provides: A snapshot of Vancouver seniors from local and nationalperspectives Demographic information on seniors in Vancouver: wherethey live, general health information, income, ethnicity An overview of issues that affect Vancouver seniors Notes on the roles of upper levels of government withrespect to planning for seniors A discussion of community services for seniors and currentmunicipal roles and possible future directionsThis paper provides information on seniorsfor municipal staff, community groups, andfor anyone with an interest in Vancouver’solder residents. As our seniors’ population growsand ages, it becomes particularly important to gainan understanding of the issues that affect olderpeople. Many of the services and systems thatare important to seniors are governed nationallyor provincially (for example, pensions and otherincome assistance programs, health services, andimmigration policy and settlement services, etc.),so it is important as well as to evaluate the effectiveness of government policies and programsdirected at this demographic. Though beneficialto seniors, some of these systems also have seriouslimitations.The City of Vancouver has done considerable workon the development of an age-friendly physicalrealm. This paper touches on this work, but thefocus remains on the City’s role in the social realm.Vancouver’s Community Centres, NeighbourhoodHouses, and a variety of non-profit seniors’ centresand groups provide the majority of public spacefor seniors’ activities and provide a broad mix ofservices, supports and opportunities for engagement. The City has varying roles and relationshipswith these groups.Also in this paper is a discussion of the roles ofcommunity-based groups and services, strengthsand challenges of Vancouver’s non-profit sector,and the City’s current and possible future roles withThe initiatives and choices municipalities make insupporting recreation and community serviceshave direct effects on the well-being of seniors.respect to these services.INTRODUCTION-1-
“In 2005 women accountedfor almost 75% of personsaged 90 or older.”-2-
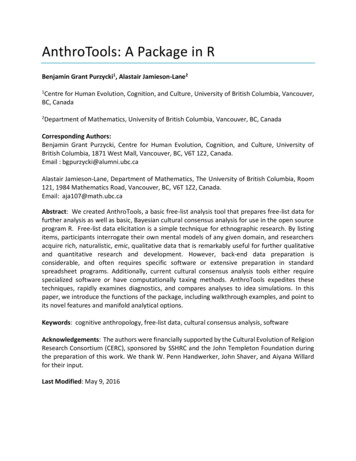
1seniors: a national contextSeniors have been a growing part of the population in Canada for decades. In the 1950s and 1960s theyaccounted for about 8% of the population1; today seniorsaccount for about 13% of the population, and this number isA Portrait of Seniors in Canada 2006increasing.2Canada’s over-85 population has also been growing rapidly over the lasttwo decades (from 0.8% of the total population in 1981 to 1.5% in 2005).3This growth pre-dates the aging of the baby boom, which will soon effect amarked increase in the percentage of the population that are senior.A number of trends have emerged for seniors across Canada, many ofwhich have clear implications for policy and services, particularly in social- and health-related realms. For example: the majority of Canadianseniors live in an urban centre; senior women outnumber senior men;more than one-quarter of people who are now seniors are immigrantsto Canada.4In many areas, the situation for Vancouver seniors follows that ofthe national picture; in others, trends for Vancouver’s seniors show amarked difference. Statistics Canada’s 2006 report, A Portrait of Seniors in Canada, provides a national snapshot which helps to contextualize census findings relating to the Province of BC and the City ofVancouver.1.1 seniors’ incomesThis Statistics Canada report provides anoverview of demographic trends, sectionson aboriginal and immigrant seniors, andinformation on such topics as health andwellness, learning, living arrangements, andleisure. Except where noted, information inthis section comes from this report.2005SENIORS13%NON SENIORS 87%2036SENIORS25%NON SENIORS 75%Projected Number of Canadian Seniors As aPerecentage of Total PopulationNationally, seniors’ incomes have been increasing, in large part beSource: A Portrait of Seniors in Canada, 2006. Statistics Canada,cause more seniors qualify for income from the Canada Pension PlanFebruary 2007 p. 12.and private pensions. In the past 20 years, the total percentage of seniors with low income has declined sharply. Of course, this is not trueacross the board: in Vancouver, for example, the incidence of poverty is higher for seniors who do not qualify for CPP or fullOld Age Security, have recently immigrated, Aboriginal seniors and seniors who live in Downtown, Grandview-Woodland,Strathcona, the Downtown East Side.Low Income SeniorsLow Income Cut-Offs (LICO) are frequently used in discussions of income. Looking at theCanadian seniors’ population between 1980 and 2003, the percentage of seniors in low income declined from 34.1% to 15.1% when measured using the before-tax LICO, and from21.3% to 6.8% when measured using the after-tax LICO.5 Incidences of low income amongseniors are highest in Quebec and BC.Government AssistanceGovernment income assistance is a lifeline for many seniors, particularly women. Over95% of seniors receive some income from Old Age Security (OAS), the Guaranteed IncomeSupplement (GIS) or Spouses Allowance (SPA).6 While the percentage of seniors whorely heavily on OAS/GIS has decreased over the years, the income gap between men andwomen has remained constant. 7In Canada,unattached seniorsare more likely tobe low income thanare seniors living infamilies.1 A Portrait of Seniors in Canada 2006, Statistics Canada, no. 89-519-XIE, February 2007, p 11.2 ibid. p 123 ibid. p 134 ibid. p 135 ibid, p 68. At last census, the before-tax LICO for a single person living in Vancouver was 20,778 (Statistics Canada, 2006).6 A Portrait of Seniors in Canada 2006. Statistics Canada, no. 89-519-XIE, February 2007, p 67.7 Well-Being Throughout the Senior Years: An Issues Paper on Key Events and Transitions in Later Life. Denton, M and Kusch, K. Social and EconomicDimensions of an Aging Population (SEDAP Research Paper No. 165). December 2006, p 29.-3-
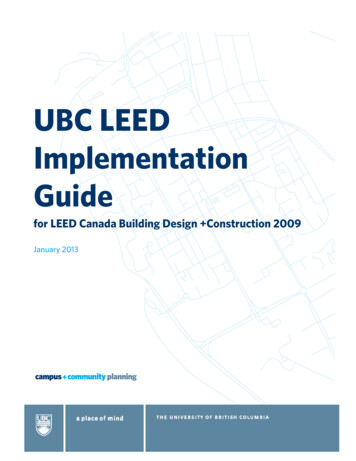
For seniors who have no Canada Pension Plan or otherincome, the maximum OAS and GIS as of January 2009is 1170 per month. Full OAS of 516.96/monthly isonly available to people who have lived in Canadafor 40 years prior to turning 65. The minimum tenureto qualify for any OAS is 10 years residency. The GISmaximum of 652.51 is available for those with annualincomes below 15,672.well below the amounts available to Canadian-bornseniors. For example, sponsored immigrants are noteligible for OAS or GIS until they have lived in Canadafor 10 years (the required length of the sponsor’s responsibility) regardless of age. Immigrants who are notsponsored can apply for OAS/GIS at age 65 and mightget only a small OAS amount (1/40th of a monthly rateof 516 per year of residence before turning 65).11In 2001, more Aboriginal Eldersthan one in ten Aboriginal elders aremore likely than anyAboriginal seniors other seniors to be livingwere living in in poverty. In 2001, morefamily households than one in ten Aboriginalelders were living in familythat fell below the households that fell belowLICO index. the LICO index. In this1.2 health andwell-beingThe life expectancy of Canadian seniors has risen since2000, but the prevalence of a number of chronic diseases is also increasing.12 The increasing number of seniorsand growing proportion of older seniors will affect theneed for community, acute and residential care.population as well, womenare particularly vulnerable. In the years between 19962001, the median income for male Aboriginal eldersseniors was 16,046 and for females, 13,185.8Care and SupportsRecent ImmigrantsSeniors who are recent immigrants represent a smallproportion of the seniors’ population, but are far morelikely to be low income than are Canadian-born seniorsor immigrants who arrived decades ago. Senior women appear to be particularly vulnerable: among femaleimmigrants aged 65 who lived alone and who landedin Canada after 1990, 71% were low-income (in contrast, 42% of Canadian-born women living alone werelow income).9 Also, 20.4% of recent immigrant maleseniors living in a family were in a low income situationin 2000, compared to just 4.6% of Canadian-born maleseniors living in a family.10The provision of community care-giving is an ongoingissue for both seniors and caregivers. Canada has seena shift in caregiving, as “increased numbers of individuals with complex health care needs [are] being caredfor at home” with a corresponding increase in the demands on family caregivers.13Health and Wellbeing For Canadian SeniorsIn many cases, immigrant seniors do not qualify for fullassistance amounts, and will therefore receive incomes 81% of seniors report at least onechronic condition. 7-8 % live in residential care. Nearly 1/3 of seniors aged 85 havedementia.Source: McMaster University’s Well-Being Throughout theSenior Years.% Immigrant Seniors arriving between1991 - 2001 by Income Status24%LOW INCOMEABOVE LOW INCOME 76%Source: A Portrait of Seniors in Canada. Statistics Canada,2007.8 A Portrait of Seniors in Canada 2006. p 238.9 ibid. p 281.10 ibid. p 282.Statistics on the numbers of seniors receiving care varyfrom source to source: as informal forms of care tendto predominate the field, this type of data is difficultto come by. Older seniors are most likely to seek or beplaced in formal care settings.11 Low-income seniors generally receive the full GIS amounts,regardless of whether other qualifications are met.12 Seniors in Canada 2006 Report Card. National AdvisoryCouncil on Aging, p 5-11.13 “Quality of Life for Family Caregivers of People with ChronicHealth Problems”. Canam, C and Acorn, S (1999). RehabilitationNursing, Journal of the Association of Rehabilitation Nurses.24(5), p 192-196, 200.-4-
Health Care CostsTrends in health care are interesting to note from acost perspective. A report from Urban Futures notesthat while health care spending is rising for all ageHealth Care CostsPer Capita Average, 2005Gender provides another marker for the differingneeds of seniors, as discussed in a recent report fromMcMasters University: 1,494 3,150Seniors who are recent immigrants are less likely thanothers to get support services they need from government, though they may be more likely than other seniors to need such supports.15T oday a 65 year old man could expect to live 16.1more years, 12.7 of them dependence-free. 1.5 ofthe other three years would be spent in moderatedependence needing help with tasks like mealpreparation and shopping, with 1.1 years spentin severe dependence relying on assistance withtasks like moving about the house or personalcare, and .8 years in an institution. A 65 year oldwoman could expect to live another 19.4 yearsbut the last 6 years of her life, she will spend2.7, 1.6 and 2.1 years, respectively, in statesof increased dependence. Therefore, womenlive longer, but spend more time in a state ofdependence. [This is because while] men aremore likely to be victims of acute illnesses suchas heart disease[,] women are more likely tosuffer from chronic debilitating but not fataldiseases.1625-29Family Caregivers: National Findings*Recent research shows that 77% of family caregivers are female 31% are retired and 16% homemakers 22% are employed full time and 19% selfemployed part time 35% reported household incomes of 45,000 or more. 23% received formal home care servicesto assist themSource: National Profile of Family Caregivers in Canada2002. Health Canada.14 A Portrait of Seniors in Canada 2006. p 48.15 National Profile of Family Caregivers in Canada 2002. DecimaResearch, Health Canada. 2002. p 3.16 National Profile of Family Caregivers in Canada - 2002.Decima Research, Health Canada. September 2002, p 3. 1,700Older seniors in particular have increasing needs forhelp with personal care. In 2003, one in ten seniorsaged 75 living in a private household needed someone else to help with their personal care such as washing, dressing, eating or taking medication. Only one ina hundred individuals aged 25 to 54 were in the samesituation”.1445-4960-64AGESource: A Perfect Storm. Urban Futures Institute, 2006.groups at approximately the same rate, per capitacosts for seniors are significantly higher than for otherdemographics. The report estimates a real increase inprovincial health spending from 85 billion in 2005 to 245 billion in 2055, a 186 % increase in spending. 75%of this is estimated as increased spending on the 65 population.171.3 retirement andvolunteeringAnother Urban Futures report discusses workforceparticipation and retirement trends among seniors.There have been two general trends: the median ageof retirement is declining over time; and labour forceparticipation for older workers is increasing.18 However, despite the increase in labour force participation, about half the labour force will continue to retirebefore 65, a figure that amounts to almost 1.4 millionpeople 50 and older retiring in the five years following2006.19 To what degree the current economic situationwill affect retirement or continuation/return to work,is unknown. The fact that retirement in BC is no longermandatory at 65 may also have an effect.A Portrait of Seniors in Canada 2006 documentsseniors’ contributions to their communities. Many17 A Perfect Storm: Sustaining Canada’s Economy During OurNext Demographic Transformation. Ramlo, A and Berlin, R. TheUrban Futures Institute, 2006. Report 66.18 Freedom 65.55.65.An Exploration of Recent RetirementTrends in Canada. Ramlo, A and Baxter, D. The Urban FuturesInstitute, 2004.19 A Portrait of Seniors in Canada 2006. p 160.-5-
provide help to others who need care or volunteer in their communities. In a national survey, almost 12 millionCanadians, or 45% of the population aged 15 and older, said they volunteered. For seniors aged 65 to 74 in 2004,39% volunteered, and on average contributed a greater number of hours to their activities than other age group20.20 A Portrait of Seniors in Canada. p 174-175.Canada has seen a shift incaregiving -- namely an increasein the demands on familycaregivers.-6-
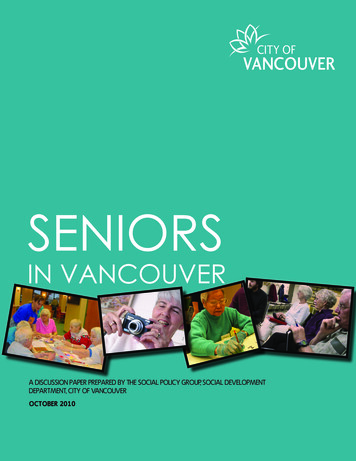
2 seniors: the VancouvercontextThis section provides information on Vancouver residents aged 65 , including demographics and key population trends.2.1 80,00060,00040,00020,00016 %In Metro Vancouver, the most significantpopulation growth has been witnessed intwo age groups: 55-59 years and 90 years.The increases in this latter age group areespecially important to note since, as theyage, older seniors tend to require greateramounts of home support, adult daycare,supportive housing and complex care.Vancouver Seniors as a Percentage of Total Population13 %The number of seniors in Vancouver is projected to grow significantly in the comingyears.21 In 2006, 76,215 people (13.1% ofthe population) were over 65, representing a growth of almost 6000 seniors in just5 years.22 By 2021, that number will be closeto 100,000, or 15.6% of the projected totalpopulation. It is anticipated that by 2036,seniors will represent one-fifth (21%) of thetotal population.230200620212031Sources : Social Indicators Report 2009, Social Development, City of Vancouver. pg. 42.Population Estimates and Forecasts. BC Stats. P.E.O.P.L.E. 33.It is also significant to note that there are currently twice as many women as men over the age of 80 in MetroVancouver. As women tend to live longer than men, female seniors represent a greater number of reportedchronic health conditions and health needs in the last years of life. As women also tend to receive lowerincomes than men across the lifespan, the question of accessibility to and affordability of adequate health careand supports becomes even more important for this section of the population. Although there may be a smallincrease in men’s average life span, older women will likely continue to outnumber older men for years to come.By 2021 Vancouver will be home to some 3,600 additional over-85 seniors, and in Metro Vancouver the proportionof senior residents is projected to rise from 1 in 8 today to 1 in 4 by 2031. These facts are sobering given the timerequired to build additional supportive housing and care facilities and the resources required to augment acuteand other forms of health care, as well as the implications on future needs in the areas of health, recreation,transportation, housing, and community design.2.2 where seniors liveThe seniors’ population can vary greatly from neighbourhood to neighbourhood. Areas with the highest percentage of seniors include Strathcona, Arbutus Ridge, Oakridge, and Shaughnessy. However, the neighbourhoods with21 The rate of growth in the seniors population is anticipated to be even faster in several other municipalities in the metropolitan region.22 Social Indicators Report 2009, Social Development, City of Vancouver. pg. 42.23 Population Estimates and Forecasts. BC Stats. P.E.O.P.L.E. 33 (Revised, March 2009)-7-
the greatest number of seniors are Renfrew-Collingwood, Kensington-Cedar Cottage, Hastings-Sunrise, and theWest End.Map 1 shows the number of seniors in all local areas. 8800 (11%) seniors live on the Downtown peninsula; over39,000 (51%) east of Main Street; and 29,000 (39%) west of Main.The four local areas with the highest percentage of seniors (2006 census) are noted below:Local areaTotal population % over 65StrathconaArbutus 19.7%19.6%18.0%Number ofseniors2,8653,1802,4901,615The four local areas with the largest seniors populations are:Local AreaTotal populationRenfrew-Collingwood 48,885Kensington CedarCottageHastings SunriseWest End% over 65 Numberof 11.4%5,3555,100Another factor of interest is the degree to which the seniors’ population has increased over time.Map 2 shows the percentage change in different local areas in the 10 years between the 1996 and 2006 censuses.Downtown has had more than a 100% increase in seniors corresponding to a general increase in total population.The next highest growth rate is in the south-east corner of the city. Renfrew-Collingwood, Victoria-Fraserview andKillarney all had over 30% increases in their seniors’ population between 2001 and 2006. The local area with thelargest absolute increase in seniors’ population was Renfrew-Collingwood, with 1,900 more seniors for a total of6,755 (or a 39.4% increase since 1996.)The distribution of older seniors is important for the planning of health, social and transportation services. Forolder seniors in particular, access to groceries, health services, community services and transportation are crucial. These resources may not be present or easily accessible, either via walking or transit. It is also noted that forresidents of the Downtown Eastside/Strathcona area and urban Aboriginals, people in their late 40s and 50s mayexperience similar problems with income, health and access to community supports as do older residents in otherareas of the City.Based on 2006 Census data, there are 10,635 seniors over 85 in the City of Vancouver. Map 3 shows that Fairview,Arbutus-Ridge and Victoria-Fraserview have the highest numbers of seniors aged 85 , followed by Renfrew-Collingwood and the West End.In 2001, there were 20,030 people over 65 (or 28.5% of all seniors) living alone in Vancouver.24 For 2006, thisnumber has increased slightly, to 20,570. This number is lower than figures for the 1996 census, which recorded20,935 seniors living alone. Seniors who live alone may or may not be at risk, depending on an individual’s income,health, age, and support systems. Currently available information shows where older seniors live, but does notprovide a correlation to income or health data.Map 4 shows the distribution of the 20,570 seniors who live alone.24 The Social Indicators Report: 2001 Census. Social Planning Department, City of Vancouver. December 2003, p 13.-8-
2.3 economic securityAlthough the Metro Vancouver’s Vital Signs 2007 report notes that seniors’ poverty rates have been falling in thepast 20 years, there is still a significantly higher proportion of low-income seniors living in the Lower Mainlandthan elsewhere in the province.25 About 12,000 of Vancouver’s 77,000 seniors have before-tax income below LICO.Map 1. Seniors in VancouverPopulation aged 65 and up by neighbourhood, 2006Map 2 Percentage Change in Seniors’ Population1996 to 2006, aged 65 and up, by neighbourhood.(Total number of seniors over 65 76, 215)Map 3 Older Seniors in VancouverPopulation aged 85 and up, 2006Map 4 Isolation: Seniors aged 65 living alone, 2006(Total number of seniors over 85 10,635)(Total number of seniors living alone 20,570)25 Metro Vancouver’s Vital Signs 2007: Our Region’s Check-Up. The Vancouver Foundation, 2007.-9-
2.4 healthSeniors who have no CPP or other pension may qualifyfor Old Age Security (OAS) and a Guaranteed IncomeSupplement (GIS) totalling 1,117 per month ( 14,000per year).27The health status of Vancouver seniors appears generally similar to the national picture, including leadingcauses of death and overall life expectancy. For Vancouver females who are currently 65-69 years old areexpected to live an additional 21.6 years; males 65-69years are expected to live an additional17.1 years.28Incidence of low income varies widely across Vancouver. For instance, the 2006 Census shows that 72.5% ofseniors in the Downtown Eastside are low income, whileother areas with high concentrations of low income seniors include Gastown, Strathcona, Mount Pleasant, andparts of Grandview-Woodlands. Downtown South, theWest End, Kitsilano, Fairview and Marpole also have census tracts with 15-20% of seniors with low alls often have serious consequences for seniors.From 1991-1997, 449 people in Vancouver/Richmonddied as a result of a fall: 359 were over 65.29 In one yearin Canada (1995-96), when only 12% of the populationLow income is one factor that puts people at risk ofwas over the age of 65, seniors accounted for one-thirdhomelessness. A report of the Greater Vancouver Reof all hospital injurygional Steering Comadmissions.30 AboutPercentage of Population that Own their Homes, by Age Group (2006 Census)mittee on Homeless84% of seniors’ injuryness notes that in 2001related admissions arethere were almost 10,000due to accidental falls.people aged 55-64 andMobility difficulties are12,755 people in Metroalso a problem and inVancouver aged 65 whocrease with age.were at risk of homeAbout 8% of the 65 lessness, or 12% of thepopulation experitotal seniors populaenced dementia in25-3435-4445-5455-6465-7475 15-24tion.26 However, the acAGE1992, roughly thetual number of homelessREST OF CENSUS METROPOLITAN AREAVANCOUVERsame as the nationseniors recorded in theal average.31 As life2008 Metro Vancouverexpectancy increases, the probability of dementia inHomeless Count was very small. Of 2500 people identicreases from 2.4% for those 65-74, to 11.1% for 75-84fied as on the street or in shelters, only 32 were over 65.27year olds, to 34.5% for those 85 .32The effects of income levels differ depending on whether seniors rent or own their home. The city has a higherproportion of renters than in Metro Vancouver as awhole, and a much higher proportion than the nationalaverage.It is expected that in the future the overall fitnessand health of seniors will improve; however increasing numbers of older seniors will also mean increasesin chronic health conditions, dementia and mobilityproblems.The graph below on home ownership illustrates the difference between the city and region. Based on these figures, about 50,000 Vancouver seniors own their homesand ap
1 A Portrait of Seniors in Canada 2006, Statistics Canada, no. 89-519-XIE, February 2007, p 11. 2 ibid. p 12 3 ibid. p 13 4 ibid. p 13 5 ibid, p 68. At last census, the before-tax LICO for a single person living in Vancouver was 20,778 (Statistics Canada, 2006). 6 A Portrait of Seniors in Canada 2006. Statistics Canada, no. 89-519-XIE .