Transcription
6 Finance & Development June 2011
COSTS OF AGINGThe priceof maturityAging populations mean countries have to find newways to support their elderlyRonald Lee and Andrew MasonMan carrying grandmother off Yangtze River ferry boat at Chaotianmen Docks, China.THE WORLD’S POPULATION will reach 7 billion this year and is projectedto exceed 9 billion in 2050. But despite the overall increase, hidden behindthese headline numbers are important changes in the age distribution of thepopulation. In the rich industrial nations as well as some middle- and lowerincome countries, populations will age as the proportion of elderly people within themix rises dramatically.Surprisingly, this population aging is driven more by low fertility than by longerlife. Low fertility means fewer children to grow up and enter the workforce, whilethe number of elderly keeps rising. But people are also living longer, which reinforces the effects of low fertility. Between now and 2050, about 1 billion workingage adults and 1.25 billion members of the age 60 population will be added to theglobal population, while the number of people younger than 25 is projected to holdsteady at 3 billion (UN, 2009).These changes have worrisome implications for both policymakers and individuals, since most elderly people are no longer part of the labor force and their consumption must be funded by their younger family members, by public or private pensions,or by their accumulated asset holdings. As the ratio of elderly to working-age peoplerises, it becomes more difficult to fund them through public or private transfers, andasset accumulation is often inadequate.We examine how the elderly are supported in different countries and discuss howthese support systems will be affected by population aging. The ways populations havesupported the elderly in the past won’t always work in the new demographic reality.More eldersWhy will the number of elderly people grow faster than the number of working-agepeople? Countries around the world had unusually large cohorts of children during the second half of the 20th century. Many high-income countries experienced ababy boom after World War II, while in low-income countries the driving force wasFinance & Development June 2011 7
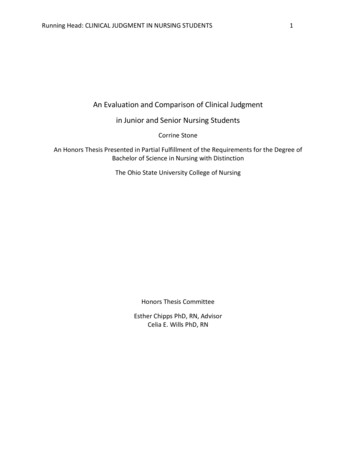
a rapid decline in infant and child mortality, leading to muchlarger numbers of surviving children. Over time these largecohorts are aging, adding first to the working-age populationand later to the population of seniors. The oldest baby boomers are just reaching retirement age.Population aging is most advancedin the rich industrial nations, butit will also start soon and proceedrapidly in east Asia.The baby boom ended in the 1960s, and fertility rates arenow at low levels—in some cases, very low—in east Asia andEurope. The situation in the developing world is highly varied.Fertility rates have declined almost everywhere, but there areexceptions. In Africa the total fertility rate is just below 5 birthsper woman. In Asia, Pakistan’s fertility rate is 4, while in Indiaand Bangladesh the rate is approaching 2. In China, by contrast, the fertility rate has declined to very low levels—about1.5 births per woman.Countries are aging at different rates: In lower-income countries, the dominant demographictrend is growth in the working-age population, while totalF&D June 2011dependencyratios are falling. This will continue to be theLeecase Lastfor updatedseveral6/6 more decades in countries like India andthose in sub-Saharan Africa. In the richest countries, the dominant trend is growthin the older population. Although these populations havealready aged considerably, the most challenging phase ofpopulation aging is yet to come, when the ratio of old peopleto those of working age—the so-called old-age dependencyratio—nearly doubles by 2050. In many emerging economies, the share of the workingage population is just now reaching a peak. In the comingdecades, these countries will experience the population agingthat high-income countries are already confronting. Ignoringthese long-term trends may be tempting, but failing to respondnow may take countries down an unwelcome and avoidablepath of economic decline. Population aging is most advanced in the rich industrialnations, but it will also start soon and proceed rapidly in eastAsia because of that region’s early and deep fertility declines.In south and southeast Asia, aging will come considerablylater. The same is generally true in Latin America, but insome countries fertility is already low and population aginghas begun. Fertility is still high in most of Africa and theMiddle East, where population aging is still far in the future.Economic life cyclesPer capita annual value,rupeesPer capita annual value,eurosAggregate total annualvalue, ten million rupeesAggregate total annualvalue, million eurosChanges in population age structure matter because economic activity varies in important and fundamental waysover a person’s life cycle. We consume from birth until death,but we only work for a limited portion of our lives, and overextended periods we consume much more than we produce.In most low- and middle-income countries, consumption is relatively low during childhood and rises to a plateauacross all adult ages (see Chart 1, top panels).In contrast, in many rich countrieswith well-developed welfare states,consumption rises strongly at olderChart 1ages and increases particularly rapidlyRicher countries spend more on elderlyabove age 85, but less so in GermanyThe age profiles of per capita consumption and labor income are similar. But thethan in many other high-income counaggregate profiles, such as those of India and Germany, are very different, because oftries. High consumption at older agescountries’ age structures.is largely driven by public and privateIndiaGermany40,00035,000spending on health and long-termLabor income35,00030,000Labor incomecare. Low labor income compounds30,00025,000Consumptionthe effects of high consumption by25,00020,000Consumption20,000the elderly in rich countries. Workers15,00015,000tend to retire earlier in high-income10,00010,000nations partly because they can afford5,0005,00000to but also because of the incentives0 10 20 30 40 50 60 70 80 900 10 20 30 40 50 60 70 80 90and disincentives built into public andAgeAge50,00050,000private pension plans, tax systems, andLabor incomeLabor income40,00040,000employment practices (Gruber andConsumptionWise, 1999).30,00030,000In middle-income countries with20,00020,000Consumptiongenerous public pension programs—10,00010,000such as Uruguay and Brazil—the elderly00also have high consumption levels.0 10 20 30 40 50 60 70 80 900 10 20 30 40 50 60 70 80 90AgeAgeThe aggregate life cycle depends on percapita consumption and labor incomeSources: Lee and Mason (forthcoming); and National Transfer Accounts database.profiles combined with a population’s8 Finance & Development June 2011
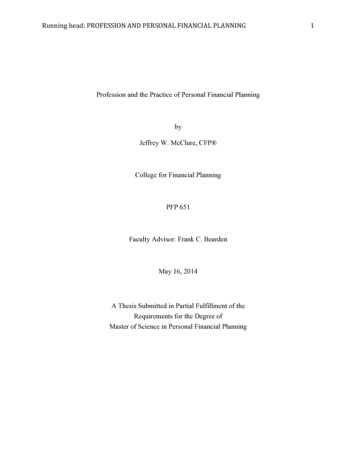
age distribution. It shows the total amounts consumed and produced by age in the national economy. The aggregate life cycleprofile for a young country like India is very different from thatof an older country like Germany (see Chart 1, lower panels).The Indian profile is dominated by the life cycle deficit ofchildren—the gap between what they consume and what theyproduce—while the deficit at older ages is relatively small, primarily because that population is a relatively small share of theIn many poor countries . . . wherefertility began to decline laterand has not proceeded as far,support ratios are rising and raisingeconomic growth.Until recently, support ratios were rising in most lowand high-income countries, which added to their economicgrowth. But population aging means support ratios are nowdeclining in high-income countries (see Chart 2). In thecoming decades, many poorer countries will also begin toexperience declining support ratios.Between 2010 and 2050 declining support ratios areexpected to depress economic growth by 0.7 percent a yearin Japan, Germany, and Spain and by 0.8 percent a year inTaiwan Province of China. In the United States, which isaging more slowly due to higher fertility, large net inflows ofF&D 6-11immigrants,and lower life expectancy, economic growth willLeeLast updated 5/13be depressedby only 0.3 percent a year.Changes in the support ratio may also curtail economicgrowth in China. Between 1972 and 2012 the support ratio isChart 2Supporting rolesAging is leading to declining support ratios in high-incomeeconomies. In low-income economies support ratios will rise forsome time.total. Germany’s life cycle deficit at older ages is much larger,while children claim a smaller share of total resources thanolder Germans. The per capita life cycle profile plays a rolehere, but Germany’s population age structure is the real driver.The transformation of the aggregate economic life cycleis fundamental to understanding the economic implicationsof the demographic transition. The enormous life cycle deficit for children in India leads to a very large downward flowfrom older age groups to younger age groups. In principle,children could borrow to pay for the gap between consumption and labor income. In practice, however, children rely ona combination of familial transfers from parents and grandparents and public transfers from taxpayers. In low- andmiddle-income countries, familial transfers are much greaterthan public transfers, so families directly bear the large coststhat arise from such young populations.The end of the demographic transition is marked byvery large flows to older populations. These flows are verydifferent from the downward flows to children, however. First, the family plays a much diminished role andthe public sector plays a much more important role inupward transfers. Second, the life cycle deficit at old agescan be funded by the accumulation of assets—a retirement plan, personal savings, a home, consumer durables,a business, and so forth. While children are overwhelmingly dependent on older generations, older generationsare not necessarily dependent on younger generations.projected to increase by 0.8 percent a year, but is projected todecline by 0.4 percent a year between 2012 and 2050.In many poor countries, however, where fertility began todecline later and has not proceeded as far, support ratios arerising and raising economic growth. In India, for example,the support ratio will continue to rise until 2040, and the neteffect through 2050 will be to raise per capita income growthby 0.2 percent a year.Getting helpWho will pay the price?Living standards are directly influenced by changes in a population’s age structure. If the number of workers (those who arecontributing to national income) grows faster than the totalpopulation (those who are consuming), living standards go up.Demographers refer to the number of workers dividedby the total population as the support ratio. The more people there are of working age in a population, the higher theincome per person, other things equal.Changes in the support ratio capture the first-round effectsof population aging. But the full economic consequencesdepend on how a nation’s individuals, families, and governments plan for and respond to population aging.One of the most important choices societies make is howto fund old-age consumption—by delaying retirement, byrelying more on the family, by increasing public transfers tothe elderly, or by accumulating more assets.Support ratio, annual growth rate,2010–50 –1.01,000BRACHLSWEUSAHUNFINESP AUTKORDEUJPNSVNTWN10,000100,000GDP per capita, 2009 (log scale)Source: Lee and Mason (forthcoming).Note: AUT Austria; BRA Brazil; CHL Chile; CHN China; CRI Costa Rica; DEU Germany;ESP Spain; FIN Finland; HUN Hungary; IDN Indonesia; IND India; JPN Japan; KEN Kenya; KOR Korea; MEX Mexico; NGA Nigeria; PHL Philippines; SVN Slovenia; SWE Sweden; THA Thailand; TWN Taiwan Province of China; URY Uruguay; USA United States.Finance & Development June 2011 9
The life cycle deficit of the elderly—that is, the difference between what they consume and what they produce—is funded in a variety of ways (see Chart 3). The elderly incountries such as the Philippines near the apex labeled“Assets” fund the deficit almost entirely using assets. Thosein countries such as Austria, Hungary, Slovenia, and Swedennear the vertex labeled “Public Transfers” fund their deficitsthrough public pensions, public health care, and public long-Older populations mean fewerchildren to share the cost, so eachchild has a greater support burdenon average.term care. It is perhaps surprising that there are no countriesnear the “Family Transfers” vertex, since it is a common viewthat the elderly in poor traditional societies are supportedby their adult children. As data become available for morethan the 18 countries shown in the chart, it is possible thatthis picture will change. In any event, the figure shows thatin some Asian economies such as Taiwan Province of China,Korea, and Thailand, the elderly do receive important sup6-11 their children in addition to other sources.portF&DfromLeeCountrieson a line joining two vertices fund their deficitsLast updated 5/13through a mixture of the two sources. We see that the elderlyin most countries, including Japan, the United States, all countries in Europe, and some in Latin America, fund their deficitsChart 3How to spend more than you earnThe elderly in most economies finance their old age byassets and public HNESPCRI ansfersSWESource: Lee and Mason (forthcoming).Notes: Proportions of consumption net of labor income funded by public transfers, familytransfers, and assets. AUT Austria; BRA Brazil; CHL Chile; CHN China; CRI Costa Rica;DEU Germany; ESP Spain; HUN Hungary; JPN Japan; KOR Korea; MEX Mexico; PHL Philippines; SVN Slovenia; SWE Sweden; THA Thailand; TWN Taiwan Province of China;URY Uruguay; USA United States. The shape of the markers indicates the continent ofeach economy.10 Finance & Development June 2011by some combination of assets and public transfers, and relylittle on family transfers. In some countries that are far outsidethe triangle to the right, the elderly make large net transfers totheir younger family members, as in Mexico and Brazil.To the extent that elders fund their consumption by continuing to work, population aging raises dependency less and has asmaller effect on the support ratio. But the elderly rarely providefor more than a third of their total consumption through laborincome, and the more they derive support from transfers—publicor private—the less they work. When elders rely on their adultchildren for support, older populations mean fewer childrento share the cost, so each child has a greater support burden onaverage. The situation is similar when elders rely on pay-as-yougo public pensions. In older populations, fewer workers pay thetaxes that fund pension benefits for the elderly, so either taxesmust be raised or benefits lowered.When the elderly rely more heavily on their own accumulated assets, the burden on the younger generations is alleviated. Indeed, when the elderly hold a disproportionatelylarge share of assets, population aging raises asset holdingsper capita. In a closed economy this boosts the productivityof labor and wages but reduces the rate of return to capital. Inan open economy, the assets will be invested abroad if domestic wages rise and profit rates fall, raising asset income in thehome country. This tendency of population aging to raise thecapital intensity of an economy or to generate increased assetincome is known as the second dividend.Postponing retirementLonger lives—adding years at the end of the life cycle,when most people are no longer working but are consuming heavily—mean countries’ consumption rises fasterthan income. But because health at older ages is generallyimproving, raising the retirement age can be an appealingoption to help restore government budget balances.How much longer would people have to work if theaim is to completely offset the decline in the support ratiobetween 2010 and 2050 through longer working lives alone?In countries such as Mexico and Brazil, a very small netchange in their support ratio (see Chart 2)—slight postponements of one and three years, respectively—would besufficient. Such changes in the retirement age are politically feasible: people are living longer so it makes sense thatthey would also work longer. In countries that will see moreaging in the next four decades, such as Finland, Sweden,and China, six years would be required, and seven for theUnited States. Countries that are aging most rapidly wouldrequire larger postponements: eight years for Japan, nine forGermany, and ten for Spain and Korea. For these countriesespecially, postponing retirement would need to be one ofseveral steps.Because aging in all these countries reflects not only longer life but also low fertility—which causes slower population growth—the increases in retirement age to offsetpopulation aging can be much larger or smaller than thesimple projected increases in life expectancy.
Population aging reduces the sustainable level of consumption, other things equal, as is shown by falling support ratios(see Chart 2). But other things will not be equal.First, consider the second dividend. If the national savingrate remained the same, the slower labor force growth thataccompanies population aging would mean more capital orasset income per worker, offsetting much of the increasedsupport burden. Longer life may lead individuals and institutional pension providers to raise life cycle saving to provide for consumption during a longer retirement, unlessthey instead choose to work longer, which would offset thedeclines in the support ratio. Because people who have fewerchildren tend to spend more on themselves and want to continue spending at that level even after retirement, lower fertility may require higher savings. However, increased public orprivate transfer obligations might also cause national savingsto decline.If these various adjustments to labor supply and assets arenot enough to offset the decline in the support ratio, otheradjustments must be made. One option is to reduce consumption further, thereby increasing saving rates and assets. Anotheris to further increase labor effort, perhaps by postponing retirement in response to changing public pension incentives or inresponse to increased difficulty in funding retirement at thedesired level from personal savings (see box).Yet another possibility is to increase investment in thehuman capital of workers. Low fertility has been the maindriver of population aging, and low fertility has been found,in theory and in empirical analysis, to go hand in hand withincreased public and private investment in human capital perchild (Lee and Mason, forthcoming, and 2010). In this casethere are fewer workers but each is more productive.Population aging will certainly challenge public and privatebudgets in many ways, but through a combination of reducedconsumption, postponed retirement, increased asset holdings, and greater investment in human capital, it should bepossible to meet this challenge without catastrophic consequences. nRonald Lee is a Professor of Demography and Economics atthe University of California, Berkeley, and Chair of the Centeron the Economics and Demography of Aging. Andrew Masonis a Professor of Economics at the University of Hawaii and aSenior Fellow at the East-West Center.References:Gruber, J. and D.A. Wise, 1999, “Introduction and Summary,” SocialSecurity and Retirement around the World, ed. by J. Gruber and D.A.Wise (Chicago: University of Chicago Press), pp. 437–74.Lee, Ronald, and Andrew Mason, forthcoming, Population Aging andthe Generational Economy (Cheltenham and New York: Edward Elgar).———, 2010, “Some Macroeconomic Aspects of Global PopulationAging,” Demography, No. 47, Special Supplement, pp. S151–S172.United Nations (UN), 2009, World Population Ageing, Department ofEconomic and Social Affairs, Population Division, Working Paper ESA/P/WP/212 (New York).Geriatric DeadbeatsOld folks may be less willing to repay sovereign debtsAli AlichiAS THE NUMBER of older voters relative to youngerones increases around the globe, the creditworthinessof borrowing countries could decline—resulting in lessexternal lending and more sovereign debt defaults.Because lenders cannot easily confiscate a government’sassets in the case of a default, they must rely almost completelyon the creditworthiness of a sovereign in deciding whether tomake a loan. To the many factors affecting a nation’s creditworthiness—such as macroeconomic strength and past debtpayment record—lenders must add aging.Studies have shown that a country’s willingness to repayis as important as whether it has the resources to repay. Thiswillingness deteriorates as voters age because they have ashorter period to benefit from their country’s access to international capital markets and become more likely to opt fordefault on current debt. Moreover, older voters generally benefit more from public resources—such as pension and healthcare benefits—which could shrink if debt is repaid. If the oldare a majority, they might force default, even if it is not optimal for the country as a whole. Lenders will take this intoaccount and reduce new lending to an aging country.There is some empirical support for the notion that agingincreases the probability of default on sovereign debt, butmore work is needed to draw strong conclusions. Alichi(2008) uses a panel of about 75 countries that have had at leastone episode of sovereign default during 1975–2003 and showsthat, on average, younger countries (those with a higher percentage of people ages 15 to 59 years) are less likely to default.Now if the old are altruistic and care about their childrenas much as themselves, they will not vote for default with itsnegative consequences for future generations. But Altonji,Hayashi, and Kotlikoff (1997) have shown that altruism doesnot hold at the overall level in the United States—althoughthere are few studies of this sort for most other countries.How can countries with aging populations improve theircredit profile? They can collateralize more of their debt, usingassets in the lending country or a third country; lower theexternal debt ceiling, which would reduce the incentive todefault; or move toward a fully funded structure and reducethe dependence of social security and old-age health benefitson public resources.They should do so as soon as possible—before their populations age! nAli Alichi is an Economist in the IMF’s Asia and PacificDepartment.References:Alichi, Ali, 2008, “A Model of Sovereign Debt in Democracies,”IMF Working Paper 08/152 (Washington: International MonetaryFund).Altonji, Joseph G., Fumio Hayashi, and Laurence Kotlikoff, 1997,“Parental Altruism and Inter Vivos Transfers: Theory and Evidence,”Journal of Political Economy, Vol. 105, No. 6, pp. 1121–66.Finance & Development June 2011 11
a rapid decline in infant and child mortality, leading to much larger numbers of surviving children. Over time these large cohorts are aging, adding first to the working-age population and later to the population of seniors. The oldest baby boom-ers are just reaching retirement age. The baby boom ended in the 1960s, and fertility rates are