Transcription
Hospital Cost, Price& Profit Review2021August
Table of ContentsExecutive Summary and Key Findings . 4Introduction and Purpose. 6Increasing Need for Affordability Collaboration . 7Health Care Spending, Government Programs and Coverage Trends. 8Review of Colorado Hospital Finances . 11Colorado Hospitals are High Cost, High Price, High Profits . 13Drivers of Colorado Hospitals’ High Prices . 26Rural Hospital Financial Struggles and Opportunity – The Time for TransformativeInvestment in Rural Hospitals Is Now . 36Community Benefit of Nonprofit Hospitals . 38Industry Integration, Expansion and Reserve-building . 45State Cost Control Efforts and Tools . 55Conclusion . 57Appendix A: Methodology and Notes of Financial & Volume Indicators . 59Appendix B: Glossary . 73Appendix C: Peer Group Analysis . 77Appendix D: Federal COVID-19 Stimulus to Colorado Hospitals . 1732 Hospital Cost, Price, and Profit Review
This report focuses on hospital costs, prices, and profits, which represent the largestcomponent of health care spend in the state and in the nation. In September 2020,the National Academy for State Health Policy published a call to action that stated,“There is never a good time to take on hospital prices, but that task is essential if thenation is ever to get a grip on health care costs.” 1 Reducing hospital operating costsand prices to national standards will benefit Colorado families, businesses and stateand local governments, while also empowering our hospitals to be more adaptivethrough future economic challenges.The Department of Health Care Policy & Financing (the Department or HCPF) iscommitted to saving people money on health care as part of Gov. Polis’ bold goal, inaccordance with directives from our General Assembly, and as part of theDepartment’s mission: Improving health care equity, access and outcomes for thepeople we serve while saving Coloradans money on health care and driving valuefor Colorado.On Nov. 1, 2017, the Department requested an increase in funding from theHealthcare Affordability and Sustainability (HAS) Fee Cash Fund. The Joint BudgetCommittee believed the state would benefit from additional resources to addresshospital cost and hospital cost shift to commercial payers. Upon the direction of theGeneral Assembly, the Department has focused resources towards transparentlyresearching and reporting hospital costs and cost shifting to commercial payers. Thisreport is a product of the General Assembly’s direction.Thank You Hospitals and Health Care ProvidersThroughout the novel coronavirus (COVID-19) pandemic, hospitals have providedexemplary leadership, delivered essential services during this time of need, and havecome together to protect and heal our citizens in unprecedented ways. TheDepartment echoes the public gratitude for the dedication from hospitals and theirfrontline workers. Hospital leaders have partnered with the state – under theleadership of Gov. Polis – on personal protective equipment (PPE), establishedreporting and testing protocols, shared best practices among their Chief MedicalOfficers on emerging treatments, and are now delivering vaccines to save lives andhelp Colorado restart the economy. At the same time, many hospitals have steppedup to help their local area nursing homes that struggled to keep up with outbreaks,lack of PPE, and other challenges. Several hospitals invested in public messaging onthe importance of wearing masks, social distancing, and washing hands to slowthe spread of COVID-19. Their aggregated, collaborative impact in protectingColoradans against the impact of COVID-19 has been remarkable, inspirational andliterally lifesaving.1Rakotoniaina, A., Bartlett, M., and Riley, T. (2020, September 21). Why Compare What Employers Pay to What Medicare Pays? National Academyof State Health Policy. at-medicare-pays/3 Hospital Cost, Price, and Profit Review
Executive Summary and Key FindingsAn Increasing Need for Affordability CollaborationWe are in a unique time of dynamic transformation in health care. We are battling aglobal pandemic, driving for a better “new normal” in health care, and pursuing everyreasonable avenue to drive affordability. An economic downturn makes thisaffordability focus even more urgent, as families struggle to keep a roof over theirheads and food on the table and employers struggle to keep their doors open.With the economic downturn, there are also a growing number of Coloradans usingpublic health care programs, which are financed by state and federal tax dollars,creating even more pressure to improve health care affordability. Approximately, 40%of Coloradans are now covered by Medicare and/or Health First Colorado (Colorado’sMedicaid Program). With the state in a fiscal crisis, every dollar disproportionatelyspent on health care takes away from education, infrastructure and a host of otherpriorities that serve all Coloradans.A majority of the data in this report was the most recently available, through 2018. In2019 and 2020, the COVID-19 pandemic changed the world. The data in this reportfocuses on a pre-COVID-19 landscape, one that Colorado can choose to return to orchoose to reform. The Department is hopeful that we can retain the partnerships andspirit of community fueled by COVID-19, which enabled frontline workers, high levelhospital administrators, government leaders, and payers to collaborate to betterrespond to a crisis. We have shown that when we work together, so much is possible.The Department is committed to partnering with health care providers to ensureequitable and sustainable public health care programs for our state’s vulnerablepopulations. The Colorado Health Institute estimated that in 2019 between 10 and20% of Coloradans did not get care due to cost, with variations by type of care. 2 Whenhealth care is unaffordable, people are less likely to seek care and more likely tobecome financially strained. We need to continue to work in tandem with health careproviders to address the needs of our communities, with a special emphasis onimproving the affordability of health care in order to improve accessibility.Review of Colorado Hospital Finances, Cost, Price and ProfitsThis report compares Colorado hospitals’ price, cost, and profit to other states,illustrating that Colorado hospitals have some of the highest prices, costs andprofits in the nation, and provides examples of tools and strategies to address thiscomplex challenge. Colorado hospital prices ranked 6th highest in the nation in 2018 and our rate ofprice increases is outpacing the nation. In 2009, the average price per patient was9.2% higher in Colorado than in the rest of the country. By 2018, the average priceper patient in Colorado had increased to 22.8% higher than the national median.2Colorado Health Institute. (2020, February 11). 2019 Colorado Health Access Survey: Health Insurance e-coverage.4 Hospital Cost, Price, and Profit Review
Hospital costs per patient in Colorado ranked 9th highest in the nation in 2018 andhave consistently exceeded national averages for the last nine years. Coloradohospital cost increases are outpacing the nation, increasing an average of 3.8% ayear compared to 3.1% per year for the rest of the country. A larger portion ofColorado hospital costs are for overhead costs. In 2018, overhead costs made up28.0% of Colorado hospital costs, while the national overhead rate was 25.4% ofhospital costs. Had Colorado hospitals incurred overhead at the national rate,operating expenses would be 474 million less in 2018. In 2018, Colorado hospitals ranked 2nd highest in the nation in total profit perpatient. Colorado’s total profit per patient of 2,891 was approximately threetimes higher than the 2018 national median of 963. Colorado hospitals generated 1.5 billion in profits from patient services in 2018 but nearly the same amount, 1.4 billion, was generated by non-patient sources (i.e.: investment income). This 2.9 billion in 2018 profits represents a 15.6% total profit margin (15.3% whenadjusted for cost of living), the highest profits in the country and significantlyhigher than the national median of 6.5%. Between 2008 and 2018, all of Colorado’shospitals together generated over 16.6 billion in total profit.For the purposes of this report, price, cost and profit are defined as noted below: Price is what hospitals charge, generally represented as revenue per patient.Price Cost Profit. Cost is how much the hospitals spend to operate and provide care for patientsand is represented by hospital-only operating expense. Profit is the difference between price and cost.Rural Hospitals, A Very Different RealityHospitals are not all the same. Different than their front range, large systemcounterparts, the state’s smaller rural hospitals have far lower margins and servemore publicly insured patients.Rural hospitals are ripe for public investment that: (a) increases access to care forrural communities; (b) retains health care patients and the associated revenues inrural communities instead of channeling patients and revenue to front range largehospital systems; (c) stabilizes rural hospitals as a top employer in the community; (d)improves affordability capabilities; and (e) maximizes new alternate paymentmethodologies that reward quality outcomes while investing in rural hospitalaccess expansion.Community Benefit and Nonprofit Tax ExemptionMost Colorado hospitals (90%) are classified as nonprofit and therefore tax exempt.This report finds that Colorado hospitals provide less charity care than other states. Italso finds that the state’s for-profit hospitals incur a similar cost related touncompensated care as nonprofit hospitals. As they did with COVID-19, hospitals havean opportunity to better address common community investment opportunities - such5 Hospital Cost, Price, and Profit Review
as behavioral health access or social determinates of health including peopleexperiencing homelessness and food insecurity through a coordinated,targeted effort.Industry ConsolidationAs of 2020, there were 45 hospitals in Colorado affiliated with eight health systems. 3In 2018, these system hospitals represented 77.1% of inpatient days, 73.3% of netpatient revenue and 87.2% of net income. Colorado hospitals reported a 6.9 billionincrease in capital assets from 2009 to 2018. This report finds that hospital mergersand acquisitions drive up health care costs and prices because they decrease marketcompetition and increase hospital market power in a community. With increasingfront range large system market power, hospitals have little incentive to controlcosts, reduce prices, increase community investments, or alter market expansionpractices – presenting an opportunity for new and emerging health care policy.State Cost Control Efforts and ToolsThe state has passed a number of legislative initiaitves and invested in tools that helpstakeholders better understand the cost of health care. These tools improve ourability to work together across stakeholder groups to craft data-driven strategies tosave people money on health care. These tools, which include reports like this, areessential in ensuring thoughtful, evidence-based policy.Introduction and PurposeIn the 2019 legislative session, Gov. Jared Polis, Lt. Gov. Dianne Primavera and thestate legislature asked the Department to examine hospital spending more closely inorder to save Coloradans money on health care. We began this multi-tiered effortwith extensive hospital cost analysis and the publication of the “Colorado Cost ShiftAnalysis Report” in January 2020. This report thoroughly debunked the concept thatMedicaid and Medicare underpayments were to blame for rising hospital commercialpayer prices. The Colorado Cost Shift Analysis Report identified opportunities for thestate to partner with health care providers to address and lower their costs and pricesto the benefit of Colorado families, employers and the state.As more hospital transparency efforts were implemented in Colorado throughlegislation, the Department’s analysis has continued to improve and expandthrough this report, “Colorado Hospital Cost, Price and Profit Review.” This report isa comprehensive review of the Department’s analysis of pre-pandemic Coloradohospital finances to examine how the system currently incentivizes higher costsand profits. The report examines Colorado hospital Medicare Cost Report data toevaluate hospital financial health, both in an individual and systemic scope. Theanalysis uses self-reported data available from Colorado hospitals’ Medicare CostReports and compares Colorado hospitals to national hospital norms in terms of price,3System affiliation information obtained from 2018 Medicare Cost Report. Two additional UCHealth system hospitals, UCHealth Greeley Hospitaland UCHealth Highlands Ranch Hospital, opened in 2019. SCL Health Community Hospital – Westminster closed in 2018.6 Hospital Cost, Price, and Profit Review
cost and profit. It also investigates nonprofit hospital communitybenefit requirements.The COVID-19 pandemic created tremendous hardship for Colorado families, includingmaintaining affordable health care coverage. Despite improvement since the height ofthe pandemic, the Colorado unemployment rate is at 6.6% compared to 2.5% beforeFebruary 2020, while the state works to open the economy and balance its budgetgiven the increasing demand for public programs. 4At the same time, the pandemic provides an opportunity to examine the course ofhealth care in Colorado, inviting us to collaboratively define and pursue a better,“new normal” in health care – one that is more affordable for Colorado families,employers and the state and sustainable for health care providers and payers. As aresult of many factors related to the pandemic, annual U.S. total health carespending went down 2% between 2019 and 2020, the first-time year-over-year costshave gone down in recorded U.S. history. 5 As a state, we can seize this opportunity toreassess and course correct the unsustainable nature of rising hospital prices. Thiswork should be coordinated with other affordability efforts, such as reducing the costof prescription drugs, investment in behavioral health and primary care, and solutionsto address social determinates of health like housing, nutrition and food security.Lastly, this report is an invitation to stakeholders to continue their use of Departmentresources and new tools when examining and collaborating with their local hospitalsto improve affordability. In partnership with the state, communities can reimaginehealth care and drive a “new normal” to the betterment of communities, employersand the state.Increasing Need for Affordability CollaborationThis section discusses the growing demands of the health care industry, the growth ofpublic programs before the COVID-19 pandemic and the financial impact to employersand Colorado families because of the COVID-19 pandemic.Key Findings on Affordability Health care is projected to consume more of the U.S. dollar. Government programs are a large part of health care spending. Trends such as agrowing senior population, growing income disparities, and the economic downturnwill lead to Medicare and Medicaid enrollment growth. Government programs will have to improve their ability control health care costsin response to increasing enrollment, fiscal challenges, and the growing percent offederal and state budgets that those programs consume.4Department of Labor and Employment. (2020, December). Colorado Employment a/uploads/Dec20PR.pdf.Altman, D. (2020, December 2). COVID-19 Is Causing Health Spending To Go Down. Kaiser Family Foundation. 19-is-causing-health-spending-to-go-down/.57 Hospital Cost, Price, and Profit Review
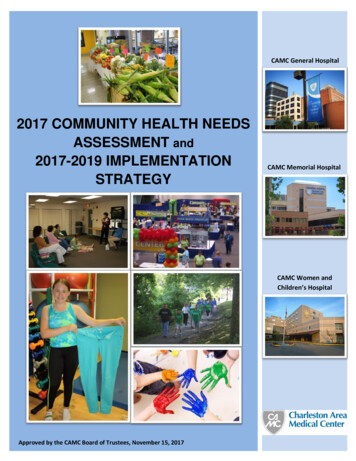
While it has not been quantified, many factors indicate that during this recessionthe uninsured rate has increased. Commercial insurance deductibles and out-of-pocket costs have become moreexpensive for Coloradans. Despite being a healthy state, Colorado insurance costsare higher than national averages. When health care is unaffordable, people are less likely to seek appropriate careand more likely to become financially strained.o In 2019, 18.1% of Coloradans surveyed reported having trouble paying amedical bill.Health Care Spending, Government Programs and Coverage TrendsHealth care expenditures represent the largest single component of the U.S. grossdomestic product (GDP) at 17.7% in 2019. This 17.7% is projected to grow to 19.7% ofGDP within 10 years, with Colorado matching this trend of growth. 6 The proportion ofColorado consumer spending (one of the contributors to GDP) for health care serviceshas increased from 11.1% in 2000 to 14.9% in 2019 (Figure 1). As health care costsconsume more of the U.S. dollar, it is unsurprising that 80% percent of those surveyedby NBC News and the Commonwealth Fund in February 2020 responded that reducinghealth care costs should be a priority for the next president (now the BidenAdministration). 7Figure 1. Colorado's Health Care Services Percentage of Personal ConsumptionExpenditures 8In 2018, government health insurance payers represented 45% of the nation’s healthcare spending, leading to growing concerns for state and federal budgets. This6Keehan et al. (2020, March 24). National Health Expenditure Projections, 2019–28: Expected Rebound In Prices Drives Rising Spending Growth.Health Affairs. doi.org/10.1377/hlthaff.2020.00094.7NBC News/Commonwealth Fund Health Care Poll. (2020, February 27). What Do Likely Voters Think About Their Health are.8U.S. Bureau of Economic Analysis. (n.d). Personal Consumption Expenditures (SAEXP1). https://apps.bea.gov/itable/index.cfm8 Hospital Cost, Price, and Profit Review
percent is expected to reach 47% by 2028 as an aging U.S. population and growingincome disparities lead to more individuals in need of this safety net coverage.6As government programs cover more people, the financial pressure on theseprograms to better control health care costs increases. There are several factorsnecessitating an increased focus on health care affordability, including public revenueshortfalls, which increase pressure on local, state and federal budgets. In Colorado,the state has forecasted a significant decline in General Fund revenue for fiscal year(FY) 2020-21 and FY 2021-22. 9 With the national debt projected to exceed GDP in2021, it is reasonable to believe there will be a spotlight on high-ticket governmentprograms like Medicare and Medicaid, which account for 24% of federal payments. 10Government programs will have to continue to provide coverage more efficientlyin response to fiscal challenges.Robust solutions using limited resources will require collaboration from all players inthe health care industry - hospitals and other care providers, insurance carriers andtheir pharmacy benefit manager (PBMs), prescription drug manufacturers and others.Public and private programs will need to drive initiatives that lower health care costsin order to provide more affordable coverage, necessitating an increased focus oncollaborative affordability strategy between the public and private sectors.A Growing Demand for Government Programs Due to the Economic DownturnRising unemployment increased the number of people and families who qualify forpublic programs like Medicaid. 11 While Colorado is experiencing an increase in HealthFirst Colorado enrollment, there is concern for the growing number of uninsuredColoradans due to the economic downturn. An August 2020 survey of Coloradans whosecured unemployment insurance found 19.3% of respondents did not have healthinsurance coverage and 46% said they were planning on remaining uninsured. 12,13 InNovember, this survey was repeated on a smaller population of Coloradans receivingunemployment insurance. In that survey, the 46% decreased to 40%, while 82% ofrespondents indicated that they were going without insurance because the premiumswere not affordable.When individuals do not have health insurance, they delay care, do not fill neededprescriptions and do not schedule appropriate preventive or other needed care. 14 Inaddition to these health-related challenges, the growing uninsured rate has thepotential to increase medical bankruptcies for Colorado families while increasing bad9Office of State Planning and Budgeting (OSBP). (2020, June 19). OSPB June 2020 Revenue Forecast. -forecast.10Congressional Budget Office. (2020, September 2). An Update to the Budget Outlook: 2020 to 2030. www.cbo.gov/publication/56517.11Department of Labor and Employment. (2020). Labor Force, Employment and Unemployment for Colorado in Multiple Time Periods: 2020 MonthlyUnemployment Rate. www.colmigateway.com.12Department of Health Care Policy & Financing. (2020, August 31). August 2020 At A Glance Newsletter. www.colorado.gov/hcpf/publications.13Department of Health Care Policy & Financing. (2020, June 10). State Prepares for Half Million New Medicaid lf-million-new-medicaid-members.14Hadley, J. (2003). Sicker and Poorer - The Consequences of Being Uninsured: A Review of the Research on the Relationship between HealthInsurance, Medical Care Use, Health, Work, and Income. Medical Care Research and Review, 60(2 suppl), 3S-75S.doi.org/10.1177/10775587032541019 Hospital Cost, Price, and Profit Review
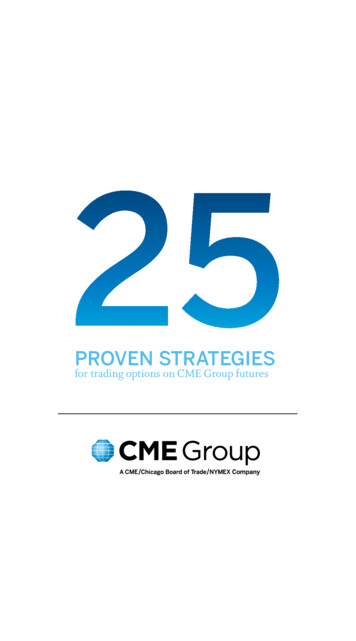
debt for hospitals and other providers. 15 There are implications for Coloradoemployers who, on average, finance 69% to 76% of total annual premiums foremployer-sponsored coverage. 16 The unemployment rate has risen to a high of 12.1%in April 2020 down to 6.6% in February 2021 due to the economic downturn. This islogically paralleled by a loss of employer-sponsored coverage. While the uninsuredrate has not been quantified through this downturn, many factors indicate that duringthis recession the uninsured rate has increased.Commercial Coverage Costs and TrendsHospital costs significantly drive health care premiums and represent the largestportion of medical expenses. 17 Specifically, hospital services amounted to over 40%of total health care spending for the commercially insured. 18,19 With the exception ofConnect for Health Colorado, Colorado’s official health insurance marketplace, whichis benefiting from the impact of reinsurance, Colorado commercial insurance costs arehigher than ever before. Coloradans will face tough financial decisions as more outof-pocket costs are passed on to them.The annual premiums for a family have stayed between 4,300 and 5,200 since 2015,with a large jump (26%) in premiums between 2018 and 2019 to 6,200 (Figure 2).Deductibles must also be considered in family insurance costs; although averagepremiums dropped for families in 2018, a jump in out-of-pocket deductibles offsetany family cost savings from the drop-in premiums. Lowering premiums whileincreasing out-of-pocket costs is a form of cost shifting and underscores why Coloradostakeholders have voiced the importance of including out-of-pocket costs inaffordability definitions, analytics and policy strategies. Although Colorado’s familypremiums are comparable to national premiums for most years, family deductibleshave been consistently higher in Colorado. An average Colorado family who meetstheir deductible paid two to six percent more in premium and deductible coststhan the national average. Despite being a healthy state, Colorado insurance costsare higher than national averages. 20,21,2215Colorado Health Institute. (2020, February 11). 2019 Colorado Health Access Survey: Health Insurance e-coverage.16Kaiser Family Foundation’s State Health Facts. Data Source: Agency for Healthcare Research and Quality, Center for Financing, Access and CostTrends. Medical Expenditure Panel Survey (MEPS)- Insurance Component, 2013-2018; Tables II.C.1, II.C.2, II.C.3 and Tables II.F.1, II.F.2, X.F.1, andX.F.2 www.meps.ahrq.gov/mepsweb/data stats/quick tables results.jsp?component 2&subcomponent 2&year 2018&tableSeries 1&tableSubSeries CDE&searchText &searchMethod 1&Action Search. 7Kenneth Thorpe. (2019). What Accounts for The Growth in Private Health Insurance Spending? Partnership to Fight Chronic growth-private-health-insurance-spending.18White and Whaley. (2020, September 18). Nationwide Evaluation of Health Care Prices Paid by Private Health Plans: Findings from Round 3 of anEmployer-Led Transparency Initiative. RAND Corporation. doi.org/10.7249/RR4394.19Centers for Medicare and Medicaid Services. (2019). National Health Expenditure Data: Table 4. National Health Expenditures by Source of Fundsand Type of Expenditures. Retrieved from ta.20United Health Foundation. (2020). 2020 Annual Report, State Summaries Colorado. America’s Health rts/2020-annual-report.21Byrnes, H. (2020, January 31). How healthy is your state? These are the 20 states that rank as the healthiest in the US. USA healthiest-states-in-america/41041197/.22United Health Foundation. (2020). America's Health Rankings analysis of Centers for Medicare & Medicaid Services Office of Minority Health'sMapping Medicare Disparities (MMD) Tool and CDC, Behavioral Risk Factor Surveillance System. Available Rankings.org.10 Hospital Cost, Price, and Profit Review
Figure 2: Colorado and National Average Family Health Insurance Costs forPremiums and Deductibles 23The Colorado Health Institute (CHI) conducts a biannual survey on health care accesswith the following findings: In 2019, 18.1% of Coloradans surveyed reported having trouble paying amedical bill. Highlighting disparities in health care, a Black Coloradan is twice as likely toreport having trouble paying medical bills. CHI estimated that in 2019 between 10 and 20% of Coloradans did not get caredue to cost, with variations by type of care. About 70% of Coloradans dipped into their savings to pay medical bills and overhalf of Coloradans increased their personal debt by using a credit card to payfor their medical care. 24Review of Colorado Hospital FinancesAll Medicare certified hospitals submit Medicare Cost Reports to the federalgovernment annually. These reports include cost information on all patient servicesand operating costs, not just those related to Medicare. The following section is theDepartment’s analysis of data reported and certified by hospitals through their 2018Medicare Cost Reports. Our analysis compares Colorado hospitals as an aggregate withnational medians and provides a peer group analysis which compares Coloradohospitals to a national peer group. Our analysis also considers key hospitalcharacteristics, such as nonprofit or for-profit status, and how Colorado hospitalscompare to other states and other hospitals of similar size. These national23Kaiser Family Foundation’s State Health Facts. Data Source: Agency for Healthcare Research and Quality, Center for Financing, Access and CostTrends. Medical Expenditure Panel Survey (MEPS)- Insurance Component, 2013-2018; Tables II.C.1, II.C.2, II.C.3 and Tables II.F.1, II.F.2, X.F.1, andX.F.2 www.meps.ahrq.gov/mepsweb/data stats/quick tables results.jsp?component 2&subcomponent 2&year 2018&tableSeries 1&tableSubSeries CDE&searchText &searchMethod 1&Action Search. 4Colorado Health Institute. (2020, February 11). 2019 Colorado Health Access Survey: Health Insurance e-coverage.11 Hospital Cost, Price, and Profit Review
comparisons demonstrate Colorado hospitals have historically higher costs, higherprices and higher profits compared to the nation.The Department has made great efforts to turn the resulting information from theanalysis into plain language whenever possible. The following information should helpreaders through this section of the report. Price equals net patient revenue. Cost equals hospital-only operating expense. Profit or patient service profit equals patient service margin.More information on the methodology the Department used is in Appendix A.Key Findings on Hospital Finances Colorado hospitals are high price, high cost and high profit. Colorado rankshigh in price (6th in the nation), cost (9th in the nation), and total profit (2ndin the nation)o Price: Hospital prices per patient for Colorado hospit
price increases is outpacing the nation. In 2009, the average price per patient was 9.2% higher in Colorado than in the rest of the country. By 2018, the average price per patient in Colorado had increased to 22.8% higher than the national median. 2 Colorado Health Institute.