Transcription
JAPAN SALES, VOLUME,PRICING 2015
March 2015EvaluatePharma ’s Japan Sales,Volume, Pricing IntelligenceThe size of the Japanese pharmaceutical market and the favourable payer environment makes it akey market for commercialisation of any new drug. In response to client requests for insight intoJapan drug pricing and the volume dynamic behind Japan drug sales, EvaluatePharma nowincludes: Japan regulatory approvals (PMDA); National Health Insurance (NHI) drug reimbursementprices; new drug price setting details, including price premiums achieved; and peak sales forecastsat launch. See the key features of this enhancement listed below. A comprehensive methodologydocument including in-depth documentation of the Japan datasets and use cases is available to allEvaluatePharma subscribers. This new content integrates with our existing reported annual andquarterly Japan drug product sales as well as with our USA Sales, Volume and Pricing and with therest of the EvaluatePharma service.The clients we collaborated with to develop the pricing insights told us that theyparticularly valued: Insight into Japan unit drug pricing and cost per patient per year for assessments Efficiency in conducting international drug price comparisons Access to patient-based forecasts models for similar products launched in Japan Transparency on new drug pricing methodology and premiums achieved for peer products Integration of pricing information with other commercial and R&D intelligence Translation to overcome language barriers and eliminate difficult document searchesKey features of this new intelligence include: Single, trusted source for Japan sales, pricing and product peak sales forecasts at launch Comprehensive Japan unit drug pricing including primary care and biotechnology products, brandedand generics. Source: National Health Insurance (NHI) drug price list International price comparisons for Japan, USA, France, Germany and the United Kingdom Peak sales forecast at launch; including cost per patient calculation and number of patients treated Pricing Premiums achieved and methodology used to calculate initial reimbursement priceCopyright 2015 Evaluate Ltd. All rights reserved. All regulatory approvals from PMDA (Pharmaceutical and Medical Devices Agency)To find out more about our USA and Japan Sales, Volume and Pricing, future pricing developments andEvaluate’s full range of services contact us: North America:Debbie PaulTel: 1 617 573 9453Email: debbie.paul@evaluategroup.com Japan:Hiroshi YamazakiTel: 81 (0) 80 1164 4754Email: hiroshi.yamazaki@evaluategroup.com R est of the World:Will HauTel: 44 (0)20 7377 0800Email: will.hau@evaluategroup.com F or general questions:Christine LindgrenTel: 1 617 866 3906Email: christine.lindgren@evaluategroup.comDisclaimerAll intellectual property rights in this report remain that of Evaluate Ltd and/or its respective third party licensors. Whilst all reasonablesteps have been taken to ensure that the data presented are accurate, Evaluate Ltd cannot accept responsibility for errors or omissions.Neither does Evaluate Ltd warrant the accuracy, merchantability or fitness for a particular purpose of the data. Nothing in the reports shallconstitute investment, financial or legal advice and the contents of the reports are provided for information purposes only. The data is notintended to amount to advice and should not be used as a determining factor in any investment decision. This report may not be lent,resold, hired out or otherwise disposed of by way of trade in any form of binding or cover other than that in which it is published, withoutthe prior written consent of Evaluate Ltd. Copyright 2015 Evaluate Ltd. All rights reserved.2
March 2015EvaluatePharma Foreword:Why Japan is a Key Strategic MarketJapan is the second largest prescription drug market after the USA, with government reimbursedpurchases growing 5.9%, in local currency, to around 60bn ( 7,038bn) in fiscal 2013. TheJapanese Yen has experienced a near 30% depreciation since the start of aggressive monetaryexpansion in December 2012. This has hit the dollar reporting of sales by Big Pharma. Despite this,Japan remains a core strategic country for large and medium sized pharmaceutical and biotechcompanies due to its favourable reimbursement environment.Favourable Reimbursement Environment of the Japanese MarketThe primary payer for drugs in Japan is the government. In order for hospitals and pharmacies to getreimbursed, a drug with its associated price must be listed on the National Health Insurance (NHI) list.This is achieved by getting the Pharmaceutical and Medical Devices Agency (PMDA) to approve a drugfor marketing in Japan. Upon approval, a manufacturer can request a new reimbursement drug pricefrom the Drug Pricing Organisation (DPO) and – once a reimbursement price has been agreed betweenthe DPO and the manufacturer – the drug can be added to the NHI coverage list. The median number ofdays between approval and NHI reimbursement is 60 days.Getting the Right Price at Launch is Critical; Rewards for InnovationThe DPO sets the reimbursed price in Japan and offers price premiums for innovation. Given that thereimbursed price of a drug is essentially fixed at launch, it is vitally important that drug companiesachieve the optimal price at launch. Within this report, we explore the two pricing methods: CostCalculation (when no comparator drug is available) and Similar Efficacy Comparison Method (page15 ). In addition, we look at the largest premiums awarded since 2006 (page 17), and show thatBristol-Myers Squibb/ Ono’s melanoma treatment, Opdivo, tops the list within the Cost CalculationMethod.Price Adjustment Every Two Years: April 2014 Prices Reduced by 4.2%Copyright 2015 Evaluate Ltd. All rights reserved.Every two years, effective on 1st April, the MHLW (Ministry of Health, Labour and Welfare)undertakes a price revision of drugs on the NHI coverage list. The primary purpose of this revision isto reduce the gap between the reimbursement price and the actual price paid by purchasers(hospitals/ pharmacies). On page 13 we have calculated the April 2014 revision at -4.2%. We canalso see that biotechnology products had a price cut of 2.5% versus a price reduction of 5.2% forsmall molecule products. This is due to the reduced discounting on biotechnology products versussmall molecule and also the reduced impact of patent expiries on biotechnology products versussmall molecules.Peak Sales Potential of Newly Reimbursed Drugs Surges to 34bn in 2010-15When applying for drug reimbursement, companies are required to submit a peak sales forecast,including the number of patients treated. Analysis on page 7 reveals drugs with a collective 34bnof potential peak sales received reimbursement post 2010 versus 16.9bn for the period 2005-9.This illustrates that the Japanese market is set for a period of sustained growth.New Endocrine (Diabetes) & Central Nervous System Drugs Largest Therapy Area forGrowthOn reviewing the therapeutic split of the collective 34bn in peak sales (page 8) of newlyreimbursed drugs in 2010-14, we identify endocrine (diabetes) as the leading therapeutic area with 6.1bn in peak sales potential. This is driven by a raft of new treatment options available (includingSGLT2, GLP-1 & DPP-IV) to Japan’s large treated diabetic population ( 7 million patients). Centralnervous system (CNS) is second with projected peak sales of 5.3bn.3
EvaluatePharma ForewordThe fact that oncology only ranks 6th, in peak sales forecasts, despite having the second highestnumber of drugs reimbursed for 2010-14, and endocrine and CNS are ranking one and two,highlights the epidemiological differences between Japan and the other G7 countries.Japan Drug Prices 40% Cheaper than USAThe process for receiving a reimbursed drug price requires a company to submit comparable unitprices for the key markets of USA, Germany, UK and France. On page 15 we have analysed all theprice comparison data and can reveal that between 2005-14, the median reimbursed price for drugsin Japan was 40% below reference price in the USA. In addition, we show that median drug pricesin Japan are 20% lower than in Germany, 28% higher than in the UK and 11% higher than inFrance.Copyright 2015 Evaluate Ltd. All rights reserved.Anthony RaesideHead of Research, Evaluate Ltd4
Key Highlights Japan Sales,Volume, Pricing Report Peak Sales Forecast of Newly Reimbursed Drugs Surges to 34bn in 2010-14 Versus 16.9bn in 2005-09 Quantity of Reimbursed Drugs Increases 8% to 64 in 2014 vs. 2013; 2014 Peak Sales Forecast Increases 19% to 6.3bn New Endocrine Drugs Have Highest Peak Sales Forecast; Central Nervous System Second Median Annual Cost of New Drugs in Japan Jumps to 837 ( 98k) in 2010-14, From 697 ( 82k) in 2005-09 10 New Drugs Cost More Than 100,000 ( 11.7m ) per Year in 2010-14 New Cancer Treatments Giotrif & Zytiga Priced at Premium Versus Other Newly Reimbursed Drugs in 2014 Japan Reimbursed Prices of Small Molecule Drugs (-5.2%) Falls Twice as Fast as Biologicals (-2.5%) in 2014Revision Prices of Top 10 Selling Japanese Drugs Declined 19% Over the Last Four NHI Price Revisions (2008-14) Japan Reimbursed Drug Prices 40% Lower than USA; 20% Cheaper than Germany Cost Calculation Used in 21% of New Drug Package Reimbursements in 2014; Similar Efficacy Used in 79% Opdivo Earns 60% Adjustment for Novelty, Efficacy and Safety in 2014Copyright 2015 Evaluate Ltd. All rights reserved. Daklinza Achieves Highest Price Premium in 2014 of 40%5
Table of ContentsJapan Drug Reimbursement Analysis (Peak Sales & Count): 2005 to 20148Japan Drug Reimbursement Analysis (2005 – 14): By Therapy Area10Japan Drug Reimbursement Analysis (2014): By Company11Reimbursed Cost per Patient per Year Analysis (2010 – 14 vs. 2005 – 09)12Japan Reimbursed Cost per Patient vs. No. of Patients Treated (2014)13Japan NHI Drug Price Revisions (2008 – 14): Total, Small Molecule & Biotech14Japan NHI Drug Price Revisions (2008 – 14): Top 10 Product Analysis15Price Comparision: Japan vs. Key International Markets16Japan Process for Pricing New Drugs17Distribution of New Drug Pricing Methods (2006-14)18Cost Calculation Method & Price Adjustment Analysis (2006 – 14)20Similar Efficacy Comparison Method Price Premiums (2006 – 14)Copyright 2015 Evaluate Ltd. All rights reserved.76
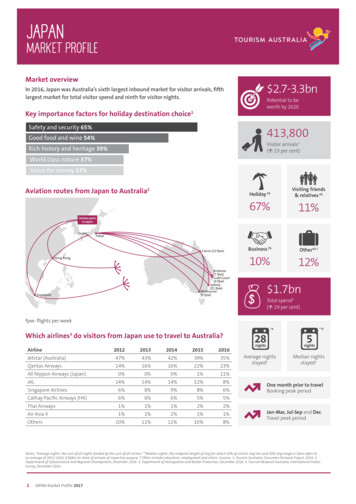
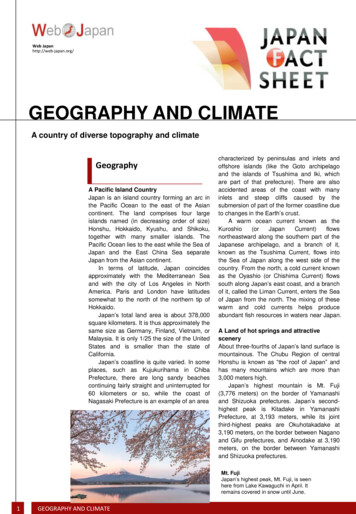
Japan Drug Reimbursement Analysis(Peak Sales & Count): 2005 to 2014Japan Drug Reimbursement Analysis (Peak Sales & Count): 2005 to 2014Peak Sales Forecast of Newly Reimbursed Drugs Surges to 34bn in 2010-14 Versus 16.9bn in 2005-09Quantity of Reimbursed Drugs Increases 8% to 64 in 2014 vs. 2013; 2014 Peak Sales Forecast Increases 19% to 6.3bnEvaluatePharma finds that the overall output of the Japanese drug industry, measured by expected peak sales forecast of newly NHIreimbursed drugs, has dramatically increased from 16.9bn in 2005-09 to 34.0bn in 2010-14.In 2014, 64 newly reimbursed drugs had a peak sales forecast available, an 8% increase on 2013. The total value of peak salesforecast increased 19% from 5.3bn in 2013 to 6.3bn in 2014. 2014 reimbursed drugs were dominated by new SGLT2 inhibitors fortype-2 diabetes, led by Astellas Pharma's Suglat, with a peak sales forecast of 515m.1098Peak Sales:2005-09: 16.9bn2010-14: 77064595.34.84030203.2101.40Japan Peak Sales ( bn)20142013201220112010200920082007200620050Number of Reimbursed Drugs with Peak SalesJapan Peak Sales Forecast at Launch ( bn)Japan Newly Reimbursed Drugs: Count vs. Peak Sales Forecast at LaunchSource: EvaluatePharma (9 MAR 2015)No. of Drugs with Peak SalesJapan Newly Reimbursed Drugs: Count of Number with Peak Sales vs. Total Japan Peak Sales Forecast (2005-14)Year (1 JAN - 31 DEC)No. of NHI Reimbursed ProductsNew Active IngredientNo. of Drugs with Peak Sales% Chg.Japan Peak Sales ( m)% Chg.Japan Peak Sales ( bn)% 2930323945 24% 38% 10%-22% 16% 3% 7% 22% 15%24156,2142007404247415049425964 67% 5% 12%-13% 22%-2%-14% 40% 7519,547666,468 147% 5%-16% 55% 54%-17%-42% 34% 28%3.33.43.25.59.08.54.85.36.3 129% 2%-4% 70% 64%-6%-43% 10% 19%1.42005-09 Peak Sales ( bn):2010-14 Peak Sales ( bn):16.934.0Copyright 2015 Evaluate Ltd. All rights reserved.Top 10 Reimbursed Drugs in 2014: Ranked on Company Forecast Peak SalesPeak SalesProduct1 Suglat2 Farxiga3 Canaglu4 Zalutia5 Effient6 Zytiga7 Deberza8 Giotrif9 Lusefi10 DaklinzaOtherTotalNo. of( m)( m)PatientsCost per Patient PerYear ( )Cost per Patient PerYear ( )Astellas Pharma52,800515800,00066,000 644Bristol-Myers Squibb50,000491760,00065,789 646Mitsubishi Tanabe Pharma46,000428720,00063,889 595Eli Lilly42,700417970,00044,021 430Daiichi Sankyo40,000393540,00074,074 728Johnson & Johnson37,0003447,5004,933,333 45,921Kowa Company34,000334530,00064,151 630Boehringer Ingelheim23,2002266,9003,362,319 32,816Taisho Pharmaceutical Holdings23,000226360,00063,889 628Bristol-Myers Squibb22,20020717,0001,305,882 mpany Filing NameNote: Where products are co-promoted, sales have been credited to the applicant company. Suglat: Astellas Pharma co-promotes inJapan with Merck & Co & Kotobuki Pharmaceutical. Farxiga: AstraZeneca co-promotes in Japan with Ono. 1 APR 2014: BMScompleted divestment to AZ. Canaglu: Mitsubishi Tanabe Pharma co-promotes in Japan with Daiichi Sankyo. Zalutia: Eli Lilly copromotes in Japan with Nippon Shinyaku for erectile dysfunction & BPH indications. Zytiga: J&J co-promotes in Japan withAstraZeneca. Deberza: Kowa and Sanofi both applied for price reimbursement. Sales have been credited to Kowa. Lusefi: TaishoPharmaceutical co-promotes in Japan with Novartis.7
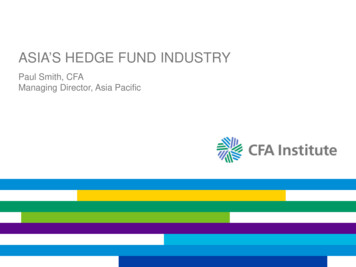
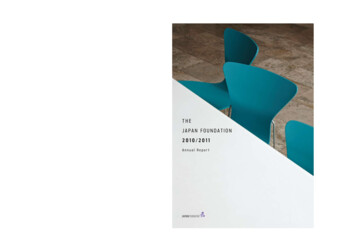
Japan Drug Reimbursement Analysis(2005 – 14): By Therapy AreaJapan Drug Reimbursement Analysis (2005-14): By Therapy AreaNew Endocrine Drugs Have Highest Peak Sales Forecast; Central Nervous System SecondEvaluatePharma finds that new endocrine (diabetes) drugs reimbursed between 2010-14, had the highest peak salesforecast at over 6bn. Japan has a large treated diabetic population, around 7 million patients, and with a raft of newtreatment options available (including DPP-IV, GLP-1 & SGLT2) this is clearly a growth hotspot for Japan. Central nervoussystem is second at 5.3bn, but with almost double the number of reimbursed drugs (52) versus endocrine (27).Surprisingly, oncology and immunodulators, which had the second highest number of drug reimbursements at 40 in 201014, only ranks 6th in terms of peak sales potential. This could to be due to the lower incidence of cancer in Japan versusother G7 countries and the resulting lower number of potential patients.Japan Peak Sales Forecast by Therapy Area: 2005-09 vs. 2010-14Source: EvaluatePharma (9 MAR 2015)010002000300040005000Japan Peak Sales ( m)60007000EndocrineCentral Nervous Peak Sales 400mNesina (DPP-IV)Suglat (SGLT2)Tenelia (DPP-IV)Farxiga (SGLT2)Canaglu (SGLT2)Tradjenta (DPP-IV)MusculoskeletalCardiovascularBloodOncology & RespiratorySystemic Anti-infectivesGastro-Intestinal2005-2009Sensory an Reimbursed Drug Count by Therapy Area: 2005-09 vs. 2010-14Source: EvaluatePharma (9 MAR 2015)Copyright 2015 Evaluate Ltd. All rights reserved.010203040Central Nervous Oncology & Systemic Anti- torySensory ologyNo. of NHI Reimbursed Drugs50602005-20092010-2014Forecast Peak Sales & Count of New NHI Reimbursed Drugs by Therapy Area: 2010-14 versus 2005-09Peak Sales ( m)1234567891011Therapy AreaEndocrineCentral Nervous SystemMusculoskeletalCardiovascularBloodOncology & ImmunomodulatorsRespiratorySystemic Anti-infectivesGastro-IntestinalSensory OrgansGenito-UrinaryPeak Sales ( rug Count% Chg.2005-20092010-2014 637%7275,341 280%25522,2154,682 211%1122378,7003,5394,277 121%1617144,320323,1641,2363,594 291%919136,514303,9191,2443,202 257%2940181,211156,2481,5291,747 114%1617161,185160,5501,7241,693 98%2774,61797,6402681,154 430%30727,32095,0607271,085 149%1213117,91176,2121,058805 76%14798
torySensory ologyJapan Drug Reimbursement Analysis(2005 – 14): By Therapy Area Cont.2005-20092010-2014Forecast Peak Sales & Count of New NHI Reimbursed Drugs by Therapy Area: 2010-14 versus 2005-09Peak Sales ( m)Peak Sales ( rug Count% Chg.2005-20092010-2014 637%7275,341 280%25522,2154,682 211%1122378,7003,5394,277 121%1617144,320323,1641,2363,594 291%919136,514303,9191,2443,202 257%2940181,211156,2481,5291,747 114%1617161,185160,5501,7241,693 98%2774,61797,6402681,154 430%30727,32095,0607271,085 149%1213117,91176,2121,058805 76%14746,86721,578440246 56%151296,2708,0006174 123%321,804,3623,047,01416,90133,954 201%194264Copyright 2015 Evaluate Ltd. All rights reserved.12345678910111213Therapy AreaEndocrineCentral Nervous SystemMusculoskeletalCardiovascularBloodOncology & ImmunomodulatorsRespiratorySystemic Anti-infectivesGastro-IntestinalSensory OrgansGenito-UrinaryVariousDermatologyTotal9
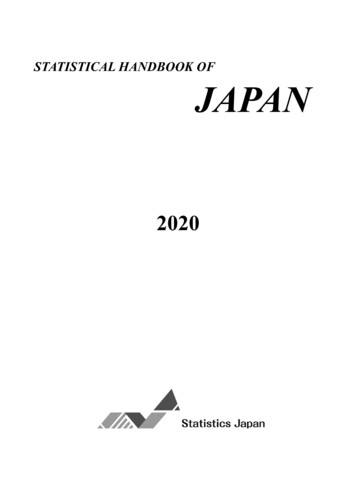
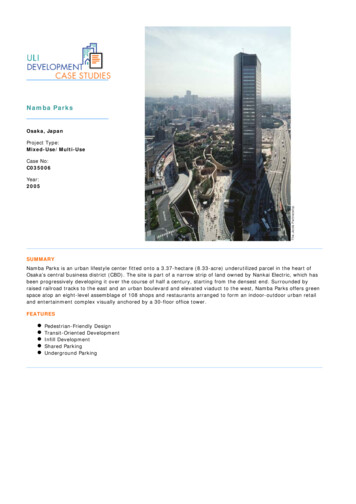
Japan Drug Reimbursement Analysis(2014): By CompanyJapan Drug Reimbursement Analysis (2014): By CompanyBristol-Myers Squibb has Highest Potential Peak Sales of Newly Reimbursed Drugs in 2014EvaluatePharma finds that Bristol-Myers Squibb's three new drug reimbursements in 2014 totalled 846m in peak sales potential.BMS's diabetes treatment Farxiga, later divested to AstraZeneca, accounted for almost 500m, with hepatitis C treatmentsDaklinza and Sunvepra also contributing to BMS taking the number 1 position in Japan in 2014. Daiichi Sankyo comes in secondwith 582m from blood products Effient and Lixiana.Mitsubishi Tanabe and Eli Lilly both launched one product in 2014 but each is worth over 400m in potential peak sales.100090044Count of Approvals8007005Peak Sales Forecast43360035002222400230011417399364311228Eli LillyKowa CompanyChugai PharmaceuticalGlaxoSmithKlineTakeda428447Johnson & JohnsonMitsubishi TanabePharma548Astellas Pharma582Daiichi Sankyo01846100Bristol-Myers Squibb200Number of Reimbursed DrugsPeak Sales ( m)Top 10 Companies in 2014: Ranked on Forecast Peak Sales for Newly Reimbursed DrugsSource: EvaluatePharma (9 MAR 2015)0Copyright 2015 Evaluate Ltd. All rights reserved.Top 10 Companies in 2014: Ranked on Company Forecast Peak Sales for Newly Reimbursed Drugs12345678910CompanyBristol-Myers SquibbDaiichi SankyoAstellas PharmaJohnson & JohnsonMitsubishi Tanabe PharmaEli LillyKowa CompanyChugai PharmaceuticalGlaxoSmithKlineTakedaTotal of Top 10OtherTotalNo. of DrugsReimbursedPeak Sales( m)Peak Sales( ology: Company analysis is based on the applicant company. Peak sales, stated above, is the total of all peak sales forcompany's new drugs in 2014. Sales of products which are co-promoted have been credited to the applicant company.Key products in 2014 co-promoted include:Suglat: Astellas Pharma co-promotes in Japan with Merck & Co & Kotobuki Pharmaceutical. Farxiga: AstraZeneca co-promotes inJapan with Ono. 1 APR 2014: BMS completed divestment to AZ. Canaglu: Mitsubishi Tanabe Pharma co-promotes in Japan withDaiichi Sankyo. Zalutia: Eli Lilly co-promotes in Japan with Nippon Shinyaku for erectile dysfunction & BPH indications. Zytiga: J&Jco-promotes in Japan with AstraZeneca. Deberza: Kowa and Sanofi both applied for price reimbursement. Sales have been creditedto Kowa. Lusefi: Taisho Pharmaceutical co-promotes in Japan with Novartis.10
Reimbursed Cost per Patient per YearAnalysis (2010 – 14 vs. 2005 – 09)Reimbursed Cost per Patient per Year Analysis (2010-14 vs. 2005-09)Count of Drugs ReimbursedMedian Annual Cost of New Drugs in Japan Jumps to 837 ( 98k) in 2010-14, From 697 ( 82k) in 2005-0910 New Drugs Cost More Than 100,000 ( 11.7m ) per Year in 2010-14EvaluatePharma finds that the median annual reimbursed cost per patient per year within newly reimbursed drugs in theperiod 2010-14 has increased to 837 ( 98k), from 697 ( 82k) in the period 2005-09.The shift to higher cost drugs partially reflects industry product launches of innovative drugs aimed at smaller patientpopulation sizes. There were 10 drugs reimbursed which cost in excess of 100,000 ( 11.7m ) per year in the period 201014, versus 5 in the period 2005-09.14012010080Count of New Drugs in Japan by Cost per Patient per Year Price Band in 2010-14 vs. 2005-09Source: EvaluatePharma (9 MAR 2015)2005-092010-14: Highest Cost per PatientVpriv( 50m/ 465k)Solaris( 45m/ 383k)Byclot( 38m/ 357k)Vyndaqel( 21m/ 184k )2010-141036040205100 100,000 286 50,000 100,00013718 25,000 50,000232735184421 10,000 5,000 1,000 - 5,000 0 - 1,000 25,000 10,000Reimbursed Cost per Patient per Year Banding ( )Count of New Drugs in Japan (2010-14 vs. 2005-09) by Reimbursed Cost per Patient per Year Price BandCopyright 2015 Evaluate Ltd. All rights reserved.Rate 1 117Reimbursed Cost per Year BandingUSA Yen 100,000 11.7m 50,000 - 100,000 5.85m - 11.7m 25,000 - 50,000 2.925m - 5.85m 10,000 - 25,000 1.17m - 2.925m 5,000 - 10,000 0.585m - 1.17m 1,000 - 5,000 0.117m - 0.585m 0 - 1,000 0m - 0.117m 10,000 0 - 719426338611562022005-09Cost per Patient Analysis Median Cost per Drug per Year81,515Average Cost per Drug per Year 1,511,4542010-14 97,9411,756,063Chg. 5 4 10 4 3 9 34 69 23 462005-09 697 12,918% Split of New 53%52%100%100%20%23%80%77%2010-14 837 15,009Total% Change 20% 16%Methodology: The reimbursed cost per patient per year is based on the company disclosed analysis at the time ofreimbursement. To improve analysis the Yen cost per patient is translated into dollars using the latest exchange rate ( 1 117).11
Reimbursed Cost per Patient vs. No.of Patients Treated (2014)Japan Reimbursed Cost per Patient vs. No. of Patients Treated (2014)New Cancer Treatments Giotrif & Zytiga Priced at Premium Versus Other Newly Reimbursed Drugs in 2014EvaluatePharma finds that prostate cancer treatment Zytiga (J&J/ AZ) and Boehringer Ingelheim's lung cancer treatment Giotrif areamong the products reimbursed in 2014 which are priced at a premium compared to all other drugs reimbursed in 2014. The analysis isbased on a regression of reimbursed cost per patient per year against peak number of patients treated for drugs reimbursed in 2014 andreviewing outliers. The analysis does not take into account explicit innovation premiums awarded on reimbursement.The annual reimbursed cost per patient per year of all drugs in 2014 is moderately correlated to the number of patients treated (R2 0.59).Japan Reimbursed Drugs in 2014: Cost per Patient per Year vs. No. of Patients TreatedReimbursed Cost per Patient per year ( )Source: EvaluatePharma (9 MAR 2015)500,000Zytiga (J&J/ AZ)450,000400,000Giotrif (BI)350,000300,000250,000200,000150,000100,000y 682030x-0.587R² 01,200,0001,400,000Japan Forecast Peak Number of Patients TreatedNote: In theory the products above the line of best fit should represent the best patient outcome, cost out of healthcare andimproved patient economic activity relative to the competition, for the indications in which sales are achieved.Top 10 Japan Drugs by Reimbursed Cost per Patient per Year in 2014: Peak Sales & No. of Patients TreatedCopyright 2015 Evaluate Ltd. All rights reserved.Product12345678910Vpriv I.V. 400 UnitsByclotTreprost Injection 20mg, 50mg, 100mg, 200mgAlecensa Capsule 20mg, 40mgAlprolix I.V. 500, 1000, 2000, 3000Deltyba Tablet 50mgAdcetris 50mg for Intravenous Drip InfusionKadcyla I.V. infusion 100mg,160mgOpdivo I.V. 20mg, 100mgJakavi Tablet 5mgCost per Patient Cost per Patient Peak Salesper Year ( )per Year ( )( m)No. ofPatients50,000,000 465,419143038,333,333 356,8214312018,000,000 167,5513420014,200,000 132,1791981,50014,107,143 131,315745609,333,333 86,8785607,466,667 72,874223006,538,462 63,8151662,6006,595,745 61,396294706,250,000 58,177931,60012
Japan NHI Drug Price Revisions (2008 –14): Total, Small Molecule & BiotechJapan Drug Price Revisions (2008-14): Total, Small Molecule & BiotechJapan Reimbursed Prices of Small Molecule Drugs (-5.2%) Falls Twice as Fast as Biologicals (-2.5%) in 2014 RevisionEvaluatePharma finds that small molecule drugs got hit by an average 5.2% price cut compared to a 2.5% cut for biologicals inthe last Japan price revision, effective 1st of April 2014. The difference is due to the reduced discounting on biotechnologyproducts versus small molecule drugs and also the reduced impact of generics on biotechnology pricing vs. small molecule.Every two years, effective 1st April, the MHLW undertakes a price revision. The primary purpose of this revision is to reduce thegap between the reimbursement price and the actual price paid by purchasers (hospitals/ pharmacies). It is worth noting that, ifactual sales exceed double the original forecasted peak, a product’s price can be reduced by up to 25%. The overall revision inthe 2014 price revision was -4.2% based on EvaluatePharma analysis.Percentage Drug Price Revision (%)Japan NHI Drug Price Revisions 2008-2014: Average Percentage RevisionSource: EvaluatePharma (9 MAR 2015)0%Q2 2008Q2 2010Q2 2012Q2 al-4.2%-4.6%-6.6%-6.2%Small Molecule-6.7%-7.2%-7%Biotech-5.2%-8%Japan NHI Drug Average Percentage Price Revisions (2008-2014): Total, Small Molecule & Biotechnology AnalysisAverage Price RevisionYearSmall Molecule DrugsBiotechnology DrugsTotalQ2 2008Q2 2010Q2 2012Q2 2014Q1 2008 100% 5%86.6-13%-5.4%-6.3%-5.6%-4.5%79.9-20%Japan NHI Drug Median Percentage Price Revisions (2008-2014): Total, Small Molecule & Biotechnology AnalysisCopyright 2015 Evaluate Ltd. All rights reserved.Median Price RevisionYearSmall Molecule DrugsBiotechnology DrugsTotalQ2 2008Q2 2010Q2 2012Q2 2014Q1 2008 100% 1%87.8-12%-3.8%-5.4%-5.0%-2.3%84.5-16%13
Japan NHI Price Revisions (2008 – 14):Product AnalysisJapan NHI Drug Price Revisions 2008-14: Top 10 Product AnalysisPrices of Top 10 Selling Japanese Drugs Declined 19% Over the Last Four NHI Price Revisions (2008-14)EvaluatePharma finds that the reimbursed drug prices for all of the top 10 selling products in Japan have decreased overthe period 2008-2014, by on average 19%.The price of the drug Plavix decreased the least, with a 2% drop over the period 2008 to 2014. Prevacid had the largestdecrease in reimbursed drug price with a reduction of 28%.In Q2 2014 Remicade was hit by an 11% price reduction and in November 2014 Nippon Kayaku launched a biosimilar intothe Japanese market.Percentage Drug Reimbursemend Price Revision (%)Japan Top 10 Selling Drugs: Reimbursed Price Revisions 2008-2014 (%)Source: EvaluatePharma (9 MAR MohrusTapeRemicadeAvastinBlopressPlavixQ2 2008Q2 2010Q2 2012Q2 2014-4%-6%-8%-10%-12%Japan Top 10 Selling Drugs in 2013: Percentage Reimbursed Price Revisions 2008-2014Copyright 2015 Evaluate Ltd. All rights reserved.Average Price nMohrus TapeRemicadeAvastinBlopressPlavixAverageQ2 2008Q2 2010Q2 2012Q2 2014Q1 2008 100% chg.Note-4.3%-8.6%-10.0%-8.4%72.1-27.9%First generic launched MAY irst generic launched JUN 14Biosimilar launched NOV 14First generic launched SEP 14Methodology: Reimbursed drug price revision reflects the average across all packs.14
Price Comparison: Japan vs. KeyInternational MarketsPrice Comparison: Japan vs Key International MarketsJapan Reimbursed Drug Prices 40% Lower than USA; 20% Cheaper than GermanyJapan Prices 28% Higher than UK and 11% Above FranceEvaluatePharma finds that the average median reimbursed drug price in Japan is 40% below the average reference price in theUSA at launch, based on analysis of Japanese regulatory documents. Japan prices are also less than German reference prices byaround 20%.Compared to the UK and France, reimbursed prices in Japan are 28% and 11% more expensive, respectively.Out of the top 5 reimbursed drugs with foreign comparators in 2014, USA prices were at least double that of the Japan prices.Median Japan vs. USA Price (USA 100)Median Japan vs. UK Price (UK 100)180%180%2005-14 Average MedianJapan vs. USA Price: 60%160%140%Copyright 2015 Evaluate Ltd. All rights reserved.2014126153174180%20132014130 116 111YearExchange Rate ( - 2920071032006130 116 111YearExchange Rate ( - 2013100%80%2012120%100%2011120%2012140%20112005-14 Average Median Japanvs. France Price: 111%160%20102005-14 Average Median Japanvs. Germany Price: 80%2009180%140%146 135 128YearExchange Rate ( - )Median Japan vs. France Price (France 100)Median Japan vs. Germany Price (Germany 062007972006802005398880YearExchange Rate ( - )11020110%20080%2005-14 Average MedianJapan vs. UK P
Volume, Pricing Intelligence . Top 10 Product Analysis 15 Price Comparision: Japan vs. Key International Markets 16 Japan Process for Pricing New Drugs 17 Distribution of New Drug Pricing Methods (2006-14) 18 Cost Calculation Method & Price Adjustment Analysis (2006 - 14)