Transcription
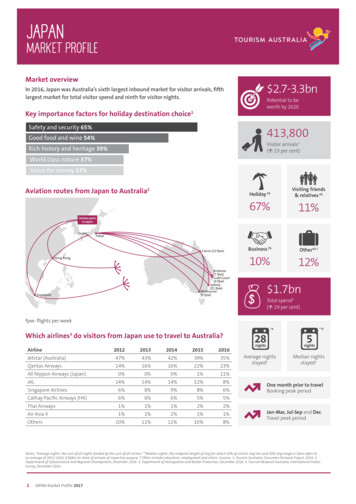
JAPANMARKET PROFILEMarket overview 2.7-3.3bnIn 2016, Japan was Australia’s sixth largest inbound market for visitor arrivals, fifthlargest market for total visitor spend and ninth for visitor nights.Potential to beworth by 2020Key importance factors for holiday destination choice1Safety and security 65%Good food and wine 54%413,800Rich history and heritage 39%Visitor arrivals3(á 23 per cent)World class nature 37%Value for money 37%Aviation routes from Japan to Australia2Holiday §Visiting friends& relatives §67%11%Business §Other § ‡10%12%Various portsin JapanOsakaTokyoCairns (13 fpw)Hong KongBrisbane(7 fpw)Gold Coast(6 fpw)Sydney(21 fpw)Melbourne(9 fpw)Singapore 1.7bnTotal spend4(á 29 per cent)fpw: flights per week*4Which airlines do visitors from Japan use to travel to Australia?3Airline20122013201420152016Jetstar (Australia)47%43%42%39%35%Qantas Airways14%16%16%22%23%0%0%0%1%11%All Nippon Airways (Japan)14%14%14%12%8%Singapore AirlinesJAL6%8%9%8%6%Cathay Pacific Airways (HK)6%6%6%5%5%Thai Airways1%1%1%2%2%Air Asia verage nightsstayed Median nightsstayed One month prior to travelBooking peak periodJan-Mar, Jul-Sep and DecTravel peak periodNotes: *Average nights: the sum of all nights divided by the sum of all visitors. **Median nights: the midpoint length of stay for which 50% of visitors stay less and 50% stay longer. Data refers toan average of 2012-2016. § Refers to share of arrivals of respective purpose. ‡ Other includes education, employment and others. Sources: 1. Tourism Australia, Consumer Demand Project, 2016. 2.Department of Infrastructure and Regional Development, December 2016. 3. Department of Immigration and Border Protection, December 2016. 4. Tourism Research Australia, International VisitorSurvey, December 2016.1JAPAN Market Profile 2017
JAPANMARKET PERFORMANCE»» The charts on this page provide a trend overview of visitor arrivals and spend over the last 10 years by main purpose of visit,Japanby first andJapanrepeat leisure visitors and also a snapshot of age demographic split of leisure visitors and spend.1Visitor -09Dec-06Dec-12EmploymentYear endingYear endingJapanFirst and repeat leisure visitor spend2JapanFirst and repeat leisure visitor arrivals2First and repeat leisure visitor arrivals2First and repeat leisure visitor spend21,200400First visitYear ending45 –59 yrs20%15 –29 yrs41%Leisure spend by age2†15 –29 yrs46%60 yrs & over15%45 –59 yrs17%30 –44 yrs23%30 –44 yrs22%Notes: Δ Leisure refers to main purpose of visit of holiday and visiting friends and relatives. † Age profile data refers to an average of 2012-2016.Sources: 1. Department of Immigration and Border Protection, December 2016. 2. Tourism Research Australia, International Visitor Survey, December 2016.JAPAN Market Profile 2017Dec-16Dec-15Year endingLeisure arrivals by age2†60 yrs & over16%Dec-140Dec-13200Dec-12JapanLeisure spend by -09150Dec-08200Return visit800Dec-07Return visit250First visit1,000Total trip spend (A -083001,400Dec-07400Holiday1,600Total trip spend (A Dec-07Dec-16Dec-06JapanVisitor spend by main purpose of visit2Visitor spend by main purpose of visit2600Visitor arrivals (000s)Year endingYear endingVisitor arrivals by main purpose of visit1Visitor arrivals (000s)Dec-11Dec-090.0Year endingJapanVisitor arrivals by main purpose of visit1arrivals by age2†1.00.5Dec-14Dec-120.5 1.7 b n1.5Dec-13Dec-111.0 1.7 b nDec-12Dec-10Total trip spend ( bn)Total trip spend ( bn)Dec-15Dec-16Dec-14Dec-15Dec-13Dec-08Dec-06Year c-16Dec-14V isito r arrivals (000s)700Dec-06V isito r arrivals (000s)700600Dec-15Dec-13Visitor arrivals1
JAPANMARKET PERFORMANCE»» The following table provides a summary of arrivals, spend and the proportion of repeat visitors to Australia by mainpurpose of visit: holiday, visiting friends and relatives and business.VISITING FRIENDSAND RELATIVESBUSINESS236,300 (67% )36,800 (11% )34,900 (10%§) 4,000 2,500 4,100 200 181 30437%69%64%Average nights stayed201414Median nights stayed2575HOLIDAYArrivals1§Spend per trip2Spend per night2Repeat visitors22§»» The following provides an overview of top 10 regions visited by leisure visitors and the number of stopovers made inAustralia by leisure visitors.Top 10 regions visited by leisure visitors * 2Sydney 42%1 Stop 61%Tropical North Queensland 36%2 Stops 22%Gold Coast 20%3-5 Stops 14%Melbourne 12%Lasseter (Uluru) 7%6-8 Stops 2%9 2 Stops 1%11%Brisbane 6%Perth 6%Whitsundays 3%Adelaide 2%Hobart 1%Overnight stopovers made in Australia by leisure visitors * 21 Stop 61%2 Stops 22%3-5 Stops 14%6-8 Stops 2%9 2 Stops 1%11%Read as: 22% of leisure travellers from Japan visited two regions (and made at least one overnight stay).Notes: Data refers to an average of 2012-2016. § Refers to share of arrivals of respective purpose of visit. * Leisure refers to main purpose of visit of holiday and visiting friends and relatives. Percentageswill not add to 100% as one person can visit multiple regions. The data refers to visitors that made at least one overnight stay.Sources: 1. Department of Immigration and Border Protection, December 2016. 2. Tourism Research Australia, International Visitor Survey, December 20163JAPAN Market Profile 2017
JAPANAVIATION LANDSCAPE4920%766,000Inbound seatsyear on year»» After a decade of capacity decline from fullservice carriers on the Japan to Australiaroutes, 2016 marked the turnaround year,with a strong 20 per cent lift in capacity,which had stimulated a 23 per centgrowth in Japanese arrivals.major capacity injection was with Qantas’Narita-Melbourne service in December2016, previously axed in 2008. For most of2016 and 2017 so far, Jetstar has adjustedoperations as more capacity shiftedtowards Qantas.»» The Qantas group (Qantas and Jetstar)carried 58 per cent of Japanese visitorsto Australia. The group lost some sharein 2016, while ANA gained with itsrelaunched Haneda-Sydney service. JapanAirlines has lost some share in 2016 withincreased competition from full servicecarriers. See table on page 1.»» In August 2015, Qantas commenced aNarita-Brisbane service, while it shiftedNarita-Sydney service to operate fromHaneda. Further competition wasintroduced when All Nippon Airways(ANA) relaunched Haneda-Sydney servicefrom December 2015, after exiting themarket over ten years ago. The nextFlightsper week»» At the back of strong Japanese arrivalsgrowth to Australia, average inbound loadfactors improved three percentage pointsto reach 83 per cent in 2016. Capacityremained tight during peaks of January –February (Australians holiday season) andJuly, with average load factors above 90per cent. Capacity for other months heldsteady with strong growth in Australianstravel to Japan, which grew 26 per centin 2015 and 16 per cent in 2016, makingJapan the largest growth destination foroutbound travel for both years.Japan aviation capacity from Japan to AustraliaDirect600S eats p er year (000s)500400Jetstar300Qantas Airways200JAL100Sources: Department of Infrastructure and Regional Development, Aviation Statistics., December 20164JAPAN Market Profile Y ear end un-08Sep-08Dec-07Mar-08Mar-11All Nippon Airways0
JAPANAVIATION LANDSCAPEWeekly services to AustraliaOperating AirlinesFlightsper weekRouteAlliance/ code share partner (on route)All Nippon Airways7Tokyo(HND)-SydneyAir New ZealandJapan irns5-7Tokyo(NRT)-Cairns4-7Tokyo(NRT)-Gold tstar, JAL7Tokyo(HND)-SydneyJetstar, JALQantasQantas, JALSources: Department of Infrastructure and Regional Development, International Airlines Timetable Summary (Northern Summer), 20175JAPAN Market Profile 2017
JAPANPLANNING AND BOOKING INFORMATION SOURCESThe following charts highlight the information sources that Japanese consumers use to plan and book their holidays.Preferred sources for early planning and inspirationTravel or guide books 25%Brochures 24%Travel agent (telephone or in person) 17%Advertised deal or package 17%General internet searching 15%Been there before 14%TV travel programs 13%Friends or relatives that have been before or live there 12%Online travel agent 11%Online flights booking site 10%Read as: 25% of respondents indicate ‘travel or guide books’ as a preferred source during the early stages of planning a holiday.Preferred sources for seeking information05101520253035Travel or guide books 31%Brochures 24%General internet searching 16%Travel agent (telephone or in person) 15%Advertised deal or package 13%Been there before 12%Friends or relatives who have been before or live there 11%Online travel agent 9%Online hotel booking site 9%Traveller review sites 9%Online travel agent 12%Read as: 31% of respondents indicate ‘travel or guide books’ as a preferred source for seeking information about a holiday destination.Preferred sources used to book a holidayTravel agent (telephone or in person) 48%Travel agent (online) 32%Directly through airline (online) 16%Accommodation provider (online) 10%Directly through airline (telephone or person) 4%Other travel booking website 3%Tour operator (telephone or in person) 2%Accommodation provider (telephone or in person) 2%Tour operator (online) 1%Other source via telephone or in person 1%Read as: 48% of respondents indicate ‘travel agent (telephone or in person)’ as a preferred source when booking a holiday.Source: Tourism Australia, Consumer Demand Project, 20166JAPAN Market Profile 2017
JAPANDISTRIBUTIONJapan has a highly regulated travel distribution system, with three levels of travel agencies. The major operators in the Japan travel market areinvolved in all levels of the distribution system. Traditionally, the key focus for Australia has been wholesale package tour divisions of the GeneralTravel Agents (GTAs). However, increasing focus is being placed on the Free and Independent Travel (FIT) segment, as Japanese outbound travellersmature. The evolution of the Japanese travel industry into a more themed, consumer-oriented sector is expected to continue.Distribution systemWHOLESALERS/ LARGE AGENCIESCommission level: 15% to 20%»» The top five wholesalers for Australia in Japan are JTB, HIS, KNT, NTA and JALPAK. All of thesecompanies produce Australian brochures. These wholesalers except JALPAK have overseasdepartments to develop specifically Australian product.»» There are also strong regional brand wholesalers such as Meitetsu in Nagoya and Nishitetsuin Fukuoka.»» Wholesalers compete for retail business as most have a retail chain under the same brand.Major wholesalers provide national coverage by distributing packages through their own retailoutlets as well as franchised external agencies.RETAIL AGENTSCommission level: 15% to 25%»» Japan has a highly regulated travel industry structure with three levels of travel agencies. Theindustry applies strict and complex licensing laws, with high levels of consumer protection.»» First Level Agencies: General Travel Agencies (GTAs) provide package, wholesale and retailservices for international and domestic tours. They generally have the following:»» Wholesale Division, which designs and produces wholesale packages. The tour products arethen on-sold to retailers, either via their own retail shops or to other agencies.»» Media Sales Division, which produces packaged tours for direct sale to consumers andpromoted through advertising, members magazines and online.»» Group Tour Sales Division, which arranges and sells special order and one-off tours for clients(including schools/corporate) and niche tour organisers.»» Retail Division and Retail Shops, which sell travel directly to consumers via retail shops.These shops sell packages produced by the in-house wholesale division as well as packagesproduced by other agencies.»» Online Sales Division, which sell travel directly to consumers via online. They sell packagesproduced by the in-house wholesale division.»» Second Level Agencies: These agencies sell international and domestic products which havebeen produced by wholesaler. They do not package or wholesale international products.»» Third Level Agencies: These retail travel agencies sell international and domestic packagesproduced by wholesaler and second level agencies. They do not have wholesale or packagingdepartments.ONLINE»» Up until recently, travel agencies with a retail presence sold the same retail package productsonline. However, some travel agents are selling special online packages to improve pricecompetitiveness.»» In recent years, Online Travel Agencies (OTAs) who have no retail presence have been growingsales by focusing on flexible airfare and hotel booking systems, especially for domestic travel.Examples of this are Rakuten, Expedia Japan, Hotels.com, Jalan (domestic only).»» Another style of online agent is those who only handle land content. Examples of these areAustralian Tour Specialists and VELTRA.»» The number of consumers who book air tickets only through airline websites is increasing,especially for domestic travel. However, the proportion of online bookings for internationalflights remains low by global standards. At the end of 2016 estimated online air booking fordomestic is 70% where international on average will remain as 15%.7JAPAN Market Profile 2017
JAPANDISTRIBUTIONAUSSIE SPECIALISTS1,282 qualified Aussie Specialistsin Japan as at Mar-17»» The Aussie Specialist Program (ASP) is the primary platform for Tourism Australia to train anddevelop front line travel sellers to best sell Australia.»» As at March 2017, there were 1,282 qualified Aussie Specialists in Japan.»» Tourism Australia has a two-tier trade engagement program in Japan. Tier one is called Club Ozand targets general manager level staff of travel agencies. Tier two is called Oznet and targetsproduct planning staff and qualified ASP agents who focus on general product and experiencedevelopment. As part of this program, Tourism Australia with State, Territory and RegionalTourism Organisations provide educational opportunities, such as seminars and famil tours.INBOUND TOUR OPERATORSCommission Level: 5% to 10%»» Companies such as JTB, HIS, KNT and NTA maintain their own Inbound Tour Operators (ITOs)in Australia. These inbound companies buy products, operate tours and provide productinformation to their respective head offices in Japan.»» Medium and small travel agencies and some sections of large GTAs use Australian ITOs andland operators. These ITOs have a sales office in Japan and in many cases sell otherinternational destinations.8JAPAN Market Profile 2017
JAPANDISTRIBUTIONTrendsTrendsDistributionSpecial Interest»» The Japanese travel industry is one of themost vertically integrated in the world. MajorJapanese companies control all levels of thedistribution system. This integration remains akey feature of the Japanese travel trade.»» There is a gradual increase in the FIT market, as Japaneseoutbound travellers become more confident to travelindependently and are less reliant on packaged tours.»» As demand for FIT travel grows, the Japanese travel industry willcontinue to become more customised and consumer-oriented.However, language will always be a barrier for most Japanesetravellers, so reliance on the industry will remain high relative toother countries.»» Large wholesalers are increasing their focus on retailconsultants to deliver better services to win customers. Amajority of consumers search destination information andpackage tours through online but visit retail shops for furtherconsultation and bookings. Consumers purchase packagetours due to multiple factors including: language, pricecompetitiveness and the strong protection provided by travelagency laws.»» In addition to the two major brochure seasons of Kamiki(April to September) and Shimoki (October to March), some ofwholesalers have begun developing secondary package toursmore frequently for customer to make booking earlier time tosecure flights and accommodation. This means paper based(brochures) are still the prime instrument for customer decisionmaking process.»» The number of online-only businesses in Japan is increasing,and major wholesalers are expanding online services andadvertising.»» To take advantage of consumers who book their flights online,some online travel agents are capturing growth by focusing onselling accommodation and optional tours only.Planning and destination Study»» When buying travel products consumers tend to refer to a mixof information sources, this includes general internet search,reference to guidebooks, visiting travel agents or Nationaltourism organisation websites and brochures.»» Repeat travellers tend to use the internet more for research andbookings, in addition to the traditional distribution channels.9JAPAN Market Profile 2017»» Australia is the most popular destination foroverseas school excursion programs from Japan.Major travel agents handling this market includeJTB, KNT, NTA, TOBU TOP TOURs and Asahi TravelInternational, who all have dedicated sales teamsin this segment.Planning a visit to marketTop tips for sales calls»» Communication with the retail industry ishandled by Tourism Australia, the airlines andthe State and Territory Tourism Organisations(STOs) based in Japan. Generally, Australianproducts liaise with their Inbound Tour Operator(ITO) then the wholesaler. It is not advisablefor Australian product to visit retail agenciesdirectly, unless for specific activities and onlyafter the relevant ITO and wholesaler havebeen consulted.»» The best time of year for sales calls is in August, September,February and March.»» It is preferable to avoid Golden Week (end April to early May),Obon (midAugust) and New Year (late December to earlyJanuary).»» The key market centres to visit are Tokyo and Osaka, followed byNagoya, Fukuoka and Sapporo.»» For more general information on sales calls and planning a visitto market, please see Tourism Australia’s Planning for InboundSuccess ebook at: www.tourism.australia.com/ inboundsuccess
JAPANFURTHER INFORMATIONKey trade and consumer eventsEventLocationDateJATA Tourism EXPO Japan 2016Tokyo22 – 24 Sep 2017Dreamtime 2017Brisbane, Australia3 – 9 Dec 2017Walkabout Japan 2018TBCJan or Feb 2018Where to find more informationTourism Australia’s activities in Japan are managed from its Tokyo office. For moreinformation visit Tourism Australia’s corporate website at www.tourism.australia.com.»» Australian State and Territory Tourism Organisations with a presence in Japan are:Destination NSW, Tourism and Events Queensland, Tourism NT, Tourism Victoria andTourism Western Australia.Also see:»» Japan Country Brief published by the Department of Foreign Affairs and Trade at:www.dfat.gov.au/geo»» For the latest arrivals statistics, arrivals.aspx»» For additional statistical reports refer to the ABS and TRA websites, www.abs.gov.auand www.tra.gov.au»» For additional information on consumer research, consumer-demand-research.aspxContactLevel 29, 420 George StreetSydney, NSW, 2000Telephone: 61 2 9360 1111Email: ask.us@tourism.australia.comCorporate: tourism.australia.com twitter.com/TourismAusConsumer: australia.com twitter.com/Australia facebook.com/SeeAustralia10 JAPAN Market Profile 2017
travel to Japan, which grew 26 per cent in 2015 and 16 per cent in 2016, making Japan the largest growth destination for outbound travel for both years. DirectJapan aviation capacity from Japan to Australia 0 100 200 300 400 500 600 D e c-0 7 M a r-0 8 Jun-0 8 Se p D e c-0 M a-0 9 Jun-0 9 p