Transcription
Fundamental Analysis Redux*Richard SloanUniversity of Southern CaliforniaPreliminary Draft: April 10, 2018ABSTRACT: In their classic 1934 text Security Analysis, Graham and Dodd warninvestors against sole reliance on a few quantitative factors in investment decisions.Instead, they recommend that investment decisions be based on a comprehensivefundamental analysis of the underlying securities. While their views held sway foralmost a century, recent years have witnessed a sharp reversal. Scholars of financeoften overlook fundamental analysis and their influence has led to a surge ofinvestment products relying solely on a few quantitative factors. These productsoften have names that appeal to fundamental analysis, such as ‘value’ and ‘quality’.Despite recent advances in quantitative finance, I argue that Graham and Dodd’srecommendations still hold true today. I show how popular quantitative approachesto investing overlook important information and select stocks with distortedaccounting numbers rather than temporary mispricing. I conclude that effectivefundamental analysis is essential for efficient capital markets and requires bothgood financial reporting and appropriately skilled analysts.*This essay is based on my invited Presidential Scholar Address at the 2017 Annual Meeting in SanDiego. I thank President David Burgstahler for the opportunity to give the address and Mary Barthfor inviting the publication of this associated essay. I thank my many coauthors and other colleagueswho have helped shape the thoughts expressed here. Special mentions to Patricia Dechow, IliaDichev, U-Wen Kok, Alastair Lawrence, Russell Lundholm, Jason Ribando, Steve Rossi, ScottRichardson, Steve Sloan, Mark Soliman and Jieyin Zeng. I am solely responsible for the viewsexpressed herein.
I. INTRODUCTIONI have spent much of my career teaching students how to interpret financialstatements. One of my key lessons is that they should not make investmentdecisions based exclusively on a handful of simple financial ratios. Instead, theyshould conduct a thorough analysis of the underlying business and carefully analyzethe extent to which the underlying the accounting numbers reflect economic reality.Accounting textbooks are replete with examples of how accounting numbers candistort economic reality. Certain mandated accounting principles simply ignoreeconomic reality. The requirement to expense most investments in research anddevelopment is a case in point. In other cases, managers must choose betweendifferent accounting methods that can poorly reflect economic reality. Examplesinclude different cost flow assumptions and depreciation methods. Finally, manyaccounting principles require managers to make estimates about the future.Examples here include the allowances for loan losses and employee postretirementbenefits. These estimates involve considerable subjectivity and are prone tomanagerial bias and manipulation.Examples such as those described above probably sound familiar to anyone thatteaches a user-oriented introductory course in financial accounting. They are at theheart of fundamental analysis and can be traced back at least as far as thepioneering work of Graham and Dodd (1934). Consequently, I suspect that manyaccounting academics believe that fundamental analysis is alive and well. Yet thefield of academic finance and the investment world today are increasinglydominated by quantitative investment techniques. These techniques typically selectsecurities using a few simple ratios and portfolio optimization software. Recentchanges have been so profound that they recently led the Wall Street Journal toproclaim that ‘The Quants Run Wall Street Now’.2Quantitative investing strategies are often referred to as ‘rules-based’ strategies. Acommon example is the selection of a portfolio of stocks with high book-to-marketratios. The advantages of such strategies are well documented. These rules-basedstrategies can quickly and efficiently select securities from a large investmentuniverse. In contrast, the traditional fundamental analyst can typically only analyzea small subset of the investment universe. Quantitative strategies are also objective,thus avoiding the well-documented behavioral biases affecting many humaninvestors, such as chasing glamor stocks or holding on to losing stocks.These advantages aside, however, many of today’s quantitative investmentstrategies seem surprisingly naïve. They ignore the basic rules of fundamentalanalysis, taking accounting numbers at face value and assuming that they reflecteconomic reality. Moreover, since many of the rules used by quantitative investmentSee Wall Street Journal, May 21, 2017. Available at reet-now-1495389108 .21
strategies are well known and widely implemented, it is hard to see how they cancontinue to provide superior investment performance in competitive markets.My goal in this paper is to reaffirm the importance of fundamental analysis forsound investment decision-making, well-functioning capital markets and efficientresource allocation. I acknowledge the advantages of quantitative investment tools.But I question whether the simple and well-known rules-based strategies thatincreasingly dominate today’s investing landscape are a good substitute for soundfundamental analysis.II. A BRIEF HISTORY OF FUNDAMENTAL ANALYSISFundamental analysis is a method of evaluating a security in an attempt to measureits value, by examining related economic, financial and other qualitative andquantitative factors.3 The history of fundamental analysis can be traced back at leastas far as the pioneering book on the topic by Graham and Dodd (1934). This bookwas published in the aftermath of the stock market crash of 1929 and warnedinvestors and against speculative investment behavior. Instead, Graham and Doddencourage investors to devote their attention to:“the field of undervalued securities-issues, whether bonds or stocks, whichare selling well below the levels apparently justified by a careful analysis ofthe relevant facts” [page 13]Graham and Dodd popularized the term ‘intrinsic value’ to represent the valuejustified by a careful analysis of the relevant facts.4 In describing their approach todetermining intrinsic value, they emphasize the importance of considering bothquantitative and qualitative factors. Chapter 2 is devoted to this topic and concludesthat:“In the mathematical phrase, a satisfactory statistical exhibit is a necessarythough by no means a sufficient condition for a favorable decision by theanalyst” [p. 40]Graham and Dodd also emphasize the importance of analyzing the company reportsthat publish the financial and operating figures underlying an investment. In thisrespect, they identify inadequate or incorrect data as a principal obstacle to thesuccess of the analyst, recognizing that:I obtained this particular definition from Investopedia, available analysis.asp . Other definitions are availableand convey the same basic idea.4 The term ‘intrinsic value’ can be traced back at least as far as Armstrong (1848).32
“Deliberate falsification of the data is rare; most of the misrepresentationflows from the use of accounting artifices which it is the function of thecapable analyst to detect” [p. 20]Much of the text in Graham and Dodd is devoted to techniques for analyzing thefinancial statements. Pages 299 through 542 of the text are devoted to the analysisof common stock investments. Of these 243 pages, 192 pages are devoted totechniques for analyzing the income statement and balance sheet. These pagescover such topics as special items, depreciation, amortization and unconsolidatedsubsidiaries. It is instructive to note that many of the accounting issues coveredhave since been at the heart of major corporate scandals, including WorldCom,Enron and Valeant Pharmaceuticals.The techniques of fundamental analysis advocated by Graham and Dodd werebroadly embraced by the investment community and planted the seeds from whichthe financial analyst profession would grow. Prior to Graham and Dodd, the financialanalyst profession was virtually non-existent.5 Following the publication of Grahamand Dodd, the financial analyst profession grew and flourished. The New YorkSociety of Security Analysts (NYSSA) was founded in 1937 and published the firstissue of The Analysts Journal in 1945. The first national organization was establishedin 1947, when several regional societies voted to form the National Federation ofFinancial Analysts Societies. The Federation was subsequently renamed theFinancial Analysts Federation (FAF) and The Analyst Journal was subsequentlyacquired by the Federation and renamed the Financial Analysts Journal. In 1959, theInstitute of Chartered Financial Analysts (ICFA) formed to administer the CFAexamination and certification, with the first examinations taking place in 1963. TheFAF and the ICFA subsequently merged to form what is currently the CFA Institute.Membership has grown from just 8,000 in 1963 to over 135,000 today.Throughout the remainder of the twentieth century, fundamental analysis was thedominant approach to investing. The CFA curriculum had a strong focus onfundamental analysis. Industry giants such as Fidelity and PIMCO built theirbusinesses on an investment philosophy grounded in rigorous fundamental analysisand leading investors of the era, such as Warren Buffet and John Neff, were strongadvocates of fundamental analysis. On Wall Street, a large cadre of sell-side analystsevolved to conduct fundamental analysis on companies and provide investmentrecommendations and financial statement forecasts to investors.Yet this same period also marked the beginning of the shift from fundamentalanalysis to a more quantitative approach to investing. The shift began withdevelopments in academia including modern portfolio theory (see Markowitz,1952), the Capital Asset Pricing Model (see Sharpe 1964 and Lintner 1965), theThe New York Society of Financial Statisticians was founded in 1916, the Investment AnalystsSociety of Chicago was founded in 1925 and the Security Analysts of San Francisco was founded in1929 respectively.53
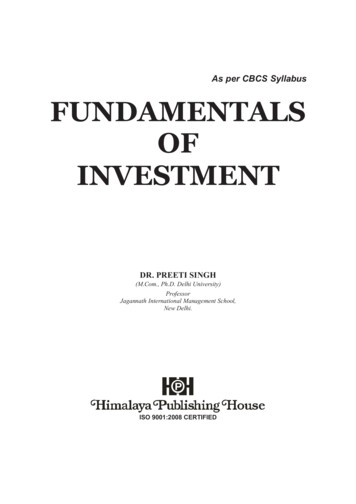
efficient market hypothesis (see Fama, 1970) and derivative pricing theory (seeBlack and Scholes 1973). One of the earliest challenges to fundamental analystscame from Fama (1965) in the Financial Analysts Journal. In this article, Famadiscusses the implications of the theory of random walks for stock prices,concluding that:“If the random walk theory is valid and if security exchanges are ‘efficient’markets, then stock prices at any point in time will represent good estimatesof intrinsic or fundamental values. Thus, additional fundamental analysis isonly of value when the analyst has new information which was notconsidered in forming current market prices or has new insights concerningthe effects of generally available information which are not already implicitin current prices. If the analyst has neither better insights nor newinformation, he may as well forget about fundamental analysis and choosesecurities by some random selection procedure.” [p. 59]These insights from academia have gradually been incorporated in the CFAcurriculum, though techniques of fundamental analysis continue to be a staple of thecurriculum. Academic textbooks on investing, however, have made a sharper switchfrom a focus on fundamental analysis to a focus on these more recent academicinsights. This shift is illustrated by the coverage of Bodie, Kane and Marcus (2017),which is currently the ‘standard’ textbook for business school courses on investing.The textbook’s contents are summarized as follows:“The integrated solutions for Bodie, Kane, and Marcus' Investments set thestandard for graduate/MBA investments textbooks. The unifying theme isthat security markets are nearly efficient, meaning that most securities arepriced appropriately given their risk and return attributes. The contentplaces greater emphasis on asset allocation and offers a much broader anddeeper treatment of futures, options, and other derivative security marketsthan most investment texts.”6In order to exemplify this shift, Table 1 compares the number of chapters focusingon various investment topics in Graham and Dodd (1934) versus Bodie, Kane andMarcus (2017). The main take away is that there has been a shift away fromfinancial statement analysis and toward more recent academic innovations infinance. In noting this shift, it would be remiss of me not to acknowledge thetheoretical rigor and practical importance of these academic insights and themasterful job done by Bodie et al. in summarizing these insights for students. Butmy main purpose here is simply to illustrate that investment texts increasinglyassume that prices already reflect fundamentals and use this as a starting point forintroducing more recent academic theories on investing.7Obtained from ssor/dp/1259277178 .While Graham and Dodd (1934) obviously did not cover topics developed long after publication, itdoes anticipate some such topics. For example, the book contains a section on ‘discrepancies between674
Table 1. Summary of Topics Covered in Graham and Dodd (1934) and Bodie,Kane and Marcus atementTheory hesisTheoryGraham and 15 ChaptersDodd(1934)Bodie, Kane1 Chapter9 Chapters3 Chapters 2 Chapters 4 Chaptersand Marcus(2017)With this shift of focus in the teaching of courses on investments, the teaching offundamental analysis is migrating to accounting departments. A strong backgroundin accounting and fundamental analysis is not typically a requirement for eitheracquiring a doctorate in finance or teaching a course on investments. To fill thisvoid, many accounting departments now offer courses covering fundamentalanalysis and the associated textbooks are increasingly authored by accountingfaculty.8 The academic accounting journals are also home to much of the ongoingresearch relating to fundamental analysis.III. A BRIEF HISTORY OF QUANTITATIVE ANALYSISIn this section, I provide a brief history of the emergence of quantitative investing.My focus is on equity investment strategies that utilize accounting numbers, sincethese strategies compete most directly with fundamental analysis. The materialpresented in this section draws heavily on Kok, Ribando and Sloan (2017), whichprovides a history of formulaic value investing and documents some of itsdrawbacks. As I will describe in more detail below, formulaic value investing wasthe earliest and is currently the most prominent form of a quantitative equityinvesting.Quantitative investment strategies first began appearing with some regularity in the1980s, though there growth can be traced back to the 1960s, and particularly thedevelopment of the CRSP database at the University of Chicago. CRSP provided acomprehensive panel of stock return data that facilitated the quantitative analysis ofinvestment strategies (e.g., backtests). Early work using the CRSP databaseprice and value’, which includes a forerunner of the Shiller CAPE ratio market timing strategy.Graham and Dodd also includes coverage of stock warrants, noting that warrants with no exercisablevalue ‘have real value nonetheless for the right to benefit from any increase in the price of thestock’. The main thrust of their analysis of the stock warrant, however, is as a ‘fundamentallydangerous and objectionable device because it effects an indirect and usually unrecognized dilutionon common stock values’.8 Examples include Palepu and Healy (2012), Penman (2012), Holthausen and Zmijewski (2013) andLundholm and Sloan (2017).5
supported the view that stock markets were generally efficient, with stock pricesfully reflecting publicly available information (Fama, 1970). Gradually, however, anumber of anomalies emerged whereby future stock returns appeared to bepredictable based on publicly available information. Many of the prominentanomalies involved accounting data. Examples include the earnings-to-price ratio,the book-to-market ratio and accounting accruals. Moreover, many of theseanomalies could be rationalized as systematic, albeit naïve, applications offundamental analysis. For example, the book-to-market ratio is often characterizedas a form of value investing (e.g., Fama and French 1998).The emergence of these anomalies was paralleled by the introduction of a series ofrelated ‘style’ or ‘factor’ indices. Russell Investments introduced the first styleindices in 1987, which were named the ‘price-driven index’ and the ‘earningsgrowth index’ respectively. The original idea was that the price-driven index wouldprovide a suitable benchmark for traditional value investors seeking underpricedstocks, while the earnings-growth index would provide a good benchmark forgrowth investors seeking stocks with high upside potential. The originalmethodology ranked stocks in the underlying index using the book-to-market ratioand placed the top half (by market capitalization) in the price-driven index and thebottom half in the earnings-growth index. In the years since, Russell has refined themethodology and renamed the price-driven index as the ‘value index’ and thegrowth-driven index as the ‘growth index’. Other index providers, included S&P,MSCI and CRSP have since followed suit, with each providing their own value andgrowth indices using their own methodologies.While the original idea behind these indices was to provide benchmarks forevaluating active portfolio managers, funds replicating the indices themselves soonemerged. The first value and growth index funds were introduced by Vanguard in1992. The 1994 prospectus describes the investment objectives of the value fund asfollows:“The VALUE PORTFOLIO seeks to replicate the aggregate price and yieldperformance of the S&P/BARRA Value Index, an index which includes stocksin the S&P 500 Index with lower than average ratios of market price to bookvalue. These types of stocks are often referred to as "value" stocks.”From these humble beginnings, index-based value funds proliferated and arerapidly overtaking their actively managed counterparts in the value-investing arena(see Kok et al., 2017). Moreover, the marketing material associated with these fundsincreasingly promote them as vehicles for investing in potentially underpricedstocks. For example, the current Vanguard Value Index Fund’s product summarystates that “these stocks may be temporarily undervalued by investors”.9Quote obtained t?FundId 0006&FundIntExt INT&funds disableredirect true .96
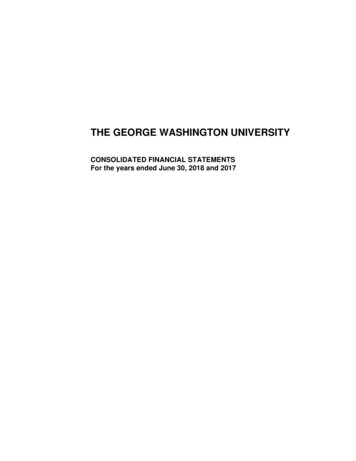
Following the success of index-based value strategies, indices were created to trackthe performance of other prominent anomalies discovered in the academicliterature. Featuring prominently among these are indices tracking momentum andquality. These indices are typically referred to as ‘factor indices’ or ‘smart betas’. Iwill focus here on the quality factor, since this factor relies most heavily onaccounting data.The quality factor is not well defined and serves as something of a catchall forvarious anomalies that are based on accounting data. Table 2 summarizes theimplementation of the quality factor for nonfinancial stocks by three major indexproducers. All of the index producers include a variant of accounting return oninvestment. This is motivated by the work of Novy Marx (2013) and others showingthat accounting rates of return on investment predict future stock returns inbacktests. Two of the producers include measures of leverage, with high leveragerepresenting lower quality. FTSE Russell includes accruals and change in assetturnover, both of which are measures of potential balance sheet bloat that have hada negative relation with future profitability and stock returns (see Sloan 1996;Richardson et al. 2006). Fidelity includes the cash flow margin, which also helpsmitigate the impact of balance sheet bloat on earnings-based performancemeasures. MSCI and Fidelity also include tilts against volatility with earningsvolatility and cash flow stability respectively.Table 2. Implementation of the ‘Quality Factor’ by Three Major Index Producers. ( )indicates that a higher value signifies higher quality, while (-) signifies that a highervalue signifies lower quality.Index ProducerMeasures of QualityMSCIReturn on Equity ( ), Debt-to-Equity (-), EarningsVariability (-)FTSE RussellReturn on Assets ( ), Change in Asset Turnover ( ),Accruals (-), Industry-Relative Operating Cash Flow to Debt( )FidelityFree Cash Flow Margin ( ), Return on Invested Capital ( ),Free Cash Flow Stability ( )Investment funds tracking quality indices have proliferated in recent years. A searchon First Bridge using the term ‘quality’ revealed over 30 quality-based ETFs.10 Thelargest of these is the iShares Edge MSCI USA Quality Factor, with over 4.5B undermanagement.The latest trend in index-based factor ETFs is multiple factor investing. The ideabehind these funds is to provide exposure to several factors in one product. Themost popular family of indices here are the MSCI Diversified Multiple-Factor Indices.These indices aim to maximize exposure to four factors – Value, Momentum, Quality10See http://www.firstbridgedata.com/ .7
and Low Size. The most popular product in this space is the iShares Edge MSCIMultifactor Index, with about 1B under management.Our discussion of quantitative investing this far has focused on index-basedproducts. Such products, however, represent just the tip of the iceberg. The majorityof investment managers using rules-based quantitative strategies employ their ownproprietary strategies. The largest managers in this space include Dimensional FundAdvisors, AQR Capital Management, Arrowstreet Capital, Acadian AssetManagement and Quantitative Management Associates. Collectively, they managehundreds of billions of dollars. Quantitative strategies are also being activelyembraced by the largest investment management companies including Blackrock,Vanguard and Fidelity, with all three now offering a suite of factor-based investmentproducts. It therefore comes as no surprise that the Wall Street Journal recentlyproclaimed that ‘The Quants Run Wall Street Now’.11IV. A PERSPECTIVE ON QUANTITATIVE INVESTINGMy brief histories of fundamental analysis and quantitative analysis shouldillustrate how approaches to investing have come almost full circle since thepublication of Graham and Dodd in 1934. Graham and Dodd’s original text cautionedagainst making investments purely on the basis on a handful of metrics, such asbook value and earnings. Instead, they recommend that investors undertake a morethorough fundamental analysis to determine intrinsic value. With the advent of theefficient markets hypothesis (EMH), investors were encouraged to assume thatprices already reflected intrinsic value and concentrate of forming appropriatelydiversified portfolios. This led to the popularity of indexing. Subsequently, researchon the EMH uncovered various anomalies, whereby subsets of stocks with specificcharacteristics were shown to have outperformed the broader market. Several ofthe most robust anomalies were based on accounting numbers. Appealing to assetpricing theory, these metrics have been used to create investment products that arelabeled as ‘factors’ and ‘smart betas’. Monikers are attached to these factors thatassociate them fundamental analysis, such as ‘value’ and ‘quality’ and they aremarketed as strategies that are designed to yield superior investment performance.This brings us back to the issue of market efficiency. Why should simple, wellknown and readily available strategies to consistently generate superior investmentperformance in competitive markets? It seems counterintuitive to argue thatfundamental analysis to identify discrepancies between price and intrinsic value isunlikely to identify mispriced securities, while simultaneously arguing that aninvestment strategy based on the book-to-market ratio systematically identifiesmispriced securities.See Wall Street Journal, May 21, 2017. Available at reet-now-1495389108 .118
Kok et al. (2017) address this issue directly in the case of formulaic value investing.They show that claims about the outperformance of formulaic value strategies areoverstated. For U.S. markets, they find no compelling evidence to support theoutperformance of formulaic value strategies. Moreover, they point out that none ofthe major commercially available U.S. value indices have shown consistent evidenceof outperformance over the past decade.If formulaic value strategies are not identifying mispriced stocks, then what are theyidentifying? Kok et al. show that these strategies systematically identify securitieswith temporarily inflated accounting numbers. For example, a strategy of buyingstocks with high book-to-market ratios systematically identifies stocks withtemporarily overstated book values that are subsequently written down. In manycases, these overstated book values arise quite transparently from accounting rulesthat fail to reflect economic reality. For such reasons, Graham and Dodd (1934, p.17)dismissed investing on book value as ‘almost worthless’. I will provide a case studyto illustrate this phenomenon in the next section.Proponents of quantitative investing often respond to the limitations of investing onsimple value ratios alone by supplementing them with other factors, such as thequality and momentum factors mentioned earlier (see Asness et al. 2015). On theface of it, this seems like a good idea. The shortcoming of simple valuation ratios isthat they tend to be high for companies with deteriorating financial performancethat has been incorporated in price, but has not yet incorporated in the accountingnumbers. Supplementing valuation formulas with market-based metrics, such asmomentum, should help to weed out the companies with deteriorating financialperformance. But the same basic question remains. If such strategies are wellknown, easy to implement and readily available to investors, why should theyconsistently generate superior investment performance in competitive markets?We can shed some evidence on the above question by examining the history of amajor index that has been designed to replicate a multiple factor investing strategy.The MSCI USA Diversified Multiple-Factor Index aims to maximize exposure to thevalue, momentum, quality and low size factors while maintaining the risk profile of abroad US index. Backtests indicate that this combination of factors has provided ahigher return than the overall market. For example, between November 1998 andthe February 2015 launch date of the index, backtests indicated that the index hadimpressively outperformed the broader market. Yet since its launch date, the indexhas closely tracked and slightly underperformed the broader market.12 Moreover,much of the backtest outperformance came from the earlier part of the backtestperiod. Some readers may wonder what fundamental insights could be missed bythis multiple-factor index. How could a portfolio of small cap stocks with lowvaluations, high quality and strong price momentum not generate superiorThis commentary reflects performance through the end of February 2018. ecc-4bc5-850c-5a9857928267 for afactsheet on this index.129
performance? I will provide a case study in the next section to illustrate how such ascreen can miss important fundamental insights.Quantitative investment strategies are usually recommended on the basis ofimpressive backtest performance. Yet there are several reasons to be skeptical ofbacktest results as indicators of future performance. I discuss each in turn:Data Mining (p-hacking)We typically only get to see backtests that worked. If researchers conduct millions ofbacktests, some will uncover strategies that generated high returns by chance alone.But there is no reason to think that such strategies will work in the future. Recentresearch concludes this has been a serious problem in finance and that many of the‘anomalies’ that have been uncovered in prior research are likely due to data mining(see Harvey 2017, Linnainmaa and Roberts 2017, Hou, Xue and Zhang 2017 andChordia, Goyal and Saretto 2017).CompetitionPerhaps the most compelling reason not to expect any well-documented and easilyreplicable investment strategy to generate consistently superior investmentperformance is competition. My own work on the “accruals” strategy in Sloan(1996) is a good example here. The strategy involves buying stocks with high cashflows but low earnings and selling stocks with low cash flow but high earnings. Theidea is that investors tend to fixate on current earnings when forecasting futureearnings, ignoring important information in cash flows. The strategy worked well.The idea was initially effective in predicting future earnings changes and investorsdid not seem to fully appreciate this idea, so the strategy also predicted future stockreturns. Since publication, the idea has continued to work well in predicting futureearnings changes , but it no longer seems so effective in predicting future stocksreturns (see Green, Hand and Soliman, 2011). The fact that it still predicts futureearnings suggests that the idea has merit and was not just data mining. What seemsto have happened here is that the strategy became widely known and exploited,resulting in its demise for predicting stock returns. Research by Pontiff and MacLean(2016) provide comprehensive evidence that performance of academic tradingstrategies declines after publication.Implemention CostsBacktest results ignore many of the real-world costs and frictions involved inexploiting an investment s
Fundamental analysis is a method of evaluating a security in an attempt to measure its value, by examining related economic, financial and other qualitative and quantitative factors.3 The history of fundamental analysis can be traced back at least as far as the pioneering book on the topic by Graham and Dodd (1934). This book