Transcription
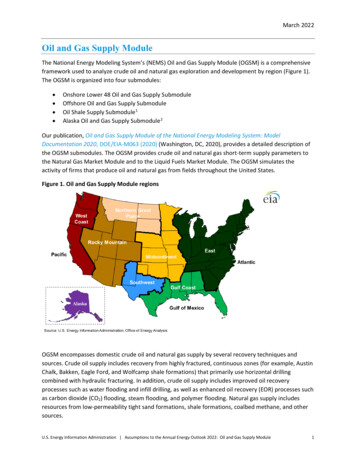
March 2022Oil and Gas Supply ModuleThe National Energy Modeling System’s (NEMS) Oil and Gas Supply Module (OGSM) is a comprehensiveframework used to analyze crude oil and natural gas exploration and development by region (Figure 1).The OGSM is organized into four submodules: Onshore Lower 48 Oil and Gas Supply SubmoduleOffshore Oil and Gas Supply SubmoduleOil Shale Supply Submodule 1Alaska Oil and Gas Supply Submodule 2Our publication, Oil and Gas Supply Module of the National Energy Modeling System: ModelDocumentation 2020, DOE/EIA-M063 (2020) (Washington, DC, 2020), provides a detailed description ofthe OGSM submodules. The OGSM provides crude oil and natural gas short-term supply parameters tothe Natural Gas Market Module and to the Liquid Fuels Market Module. The OGSM simulates theactivity of firms that produce oil and natural gas from fields throughout the United States.Figure 1. Oil and Gas Supply Module regionsOGSM encompasses domestic crude oil and natural gas supply by several recovery techniques andsources. Crude oil supply includes recovery from highly fractured, continuous zones (for example, AustinChalk, Bakken, Eagle Ford, and Wolfcamp shale formations) that primarily use horizontal drillingcombined with hydraulic fracturing. In addition, crude oil supply includes improved oil recoveryprocesses such as water flooding and infill drilling, as well as enhanced oil recovery (EOR) processes suchas carbon dioxide (CO2) flooding, steam flooding, and polymer flooding. Natural gas supply includesresources from low-permeability tight sand formations, shale formations, coalbed methane, and othersources.U.S. Energy Information Administration Assumptions to the Annual Energy Outlook 2022: Oil and Gas Supply Module1
March 2022Key AssumptionsDomestic crude oil and natural gas technically recoverable resourcesThe outlook for domestic crude oil production is highly dependent on the production profile ofindividual wells over time, the cost of drilling and operating those wells, and the revenues generated bythose wells. Every year, we re-estimate initial production (IP) rates and production decline curves, whichdetermine estimated ultimate recovery (EUR) per well and total technically recoverable resources(TRR). 3A common measure of the long-term viability of U.S. domestic crude oil and natural gas as energysources is the remaining TRR, which consists of proved reserves 4 and unproved resources. 5 Estimates ofTRR are highly uncertain, particularly in emerging plays where relatively few wells have been drilled.Early estimates tend to vary and shift significantly over time because new geological information isgained through additional drilling, long-term productivity is clarified for existing wells, and theproductivity of new wells increases with technology improvements and better management practices.The TRR estimates that we use for each Annual Energy Outlook (AEO) are based on the latest availablewell production data and information from other federal and state governmental agencies, industries,and academia.Table 1. Technically recoverable U.S. crude oil resources as of January 1, 2020RegionLower 48 states onshoreProvedreserves,billion barrelsUnprovedresources,billion barrelsTotal technicallyrecoverable resources,billion barrels38.8229.1267.9East0.95.16.0Gulf 8126.9144.7Rocky Mountain3.128.831.9Northern Great Plains6.221.427.6West Coast2.03.05.0Lower 48 states offshore5.654.960.5Gulf (currently available for leasing)5.337.242.5Eastern/Central Gulf (unavailable for leasing until laska (onshore and offshore)2.742.044.7Total United States47.1326.0373.1Source: Lower 48 onshore and state offshore—U.S. Energy Information Administration (EIA); Alaska—U.S. Geological Survey(USGS); federal (Outer Continental Shelf) offshore—Bureau of Ocean Energy Management; proved reserves—EIA. Tablevalues reflect removal of intervening reserves additions between the date of the latest available assessment and January 1,2020.Note: Crude oil resources include lease condensates but do not include natural gas plant liquids or kerogen (oil shale).Resources in areas where drilling is officially prohibited are not included in this table. The estimate of 7.3 billion barrels ofcrude oil resources in the Northern Atlantic, Northern and Central Pacific, and within a 50-mile buffer off the Mid- andSouthern Atlantic Outer Continental Shelf (OCS) is also excluded from the technically recoverable volumes because leasing isnot expected in these areas.U.S. Energy Information Administration Assumptions to the Annual Energy Outlook 2022: Oil and Gas Supply Module2
March 2022Table 2. Technically recoverable U.S. dry natural gas resources as of January 1, 2020Provedreserves,trillion cubic feetUnprovedresources,trillion cubic feetTotal technicallyrecoverable resources,trillion cubic feetLower 48 states onshore450.11,967.52,417.6East181.5731.5912.9Gulf west68.4416.4484.8Rocky Mountain50.5237.5288.1Northern Great Plains11.729.341.0West Coast1.29.210.4Lower 48 states offshore6.0252.1258.1Gulf (currently available)5.8192.9198.6Eastern/Central Gulf (unavailable until 2Alaska (onshore and offshore)9.3240.7250.0Total United States465.42,460.42,925.8Source: Lower 48 onshore and state offshore—U.S. Energy Information Administration (EIA); Alaska—U.S. GeologicalSurvey (USGS); federal (OCS) offshore—Bureau of Ocean Energy Management; proved reserves—EIA. Table values reflectremoval of intervening reserve additions between the date of the latest available assessment and January 1, 2020.Notes: Resources in other areas where drilling is officially prohibited are not included. The estimate of 32.9 trillion cubicfeet of natural gas resources in the Northern Atlantic, Northern and Central Pacific, and within a 50-mile buffer off theMid- and Southern Atlantic Outer Continental Shelf (OCS) is also excluded from the technically recoverable volumesbecause leasing is not expected in these areas.The resources presented in the tables in this document are the starting values for the model.Technology improvements in the model add to the unproved TRR, which can be converted to reservesand finally to production. In addition, the TRR is based on an assumed well spacing to calculate thenumber of remaining drill sites, and the model allows for closer spacing if economical, even withdiminishing returns per well as a result of increased well interference. The tables in this document donot include these increases in TRR, so cumulative production from 2020 through 2050 could exceed thepresented TRR.The remaining unproved TRR for a continuous-type shale gas or tight oil area is the product of area withpotential, well spacing (wells per square mile), and EUR per well. Table 3 and Table 4 summarize theassumptions for unproved technically recoverable resources for tight oil, shale gas, tight gas, andcoalbed methane at the play level. The module uses a distribution of EUR per well in each play and oftenin sub-play areas. Because of the significant variation in well productivity within an area, the wells ineach play are further delineated by county. We provide this level of detail for select plays on ourproduction decline curve analysis page.U.S. Energy Information Administration Assumptions to the Annual Energy Outlook 2022: Oil and Gas Supply Module3
March 2022Table 3. U.S. unproved technically recoverable tight and shale oil and natural gas resources by play (asof January 1, ianBlack WarriorIllinoisMichiganMichiganGulf CoastBlack WarriorBlack WarriorTexas-LouisianaMississippi SaltTexas-LouisianaMississippi SaltTexas-LouisianaMississippi SaltValley and RidgeWestern GulfWestern GulfWestern GulfWestern GulfWestern GulfWestern GulfWestern GulfWestern GulfWestern GulfWestern GulfWestern GulfWestern adarkoAnadarkoArkomaArkomaArkomaArkomaCherokee PlatformSouthwestFort WorthFort WorthFort WorthFort -Medina-TuscaroraDevonianHuronMarcellus FoldbeltMarcellus InteriorMarcellus WesternUtica-Gas Zone CoreUtica-Gas Zone ExtensionUtica-Oil Zone CoreUtica-Oil-Zone ExtensionChattanoogaNew AlbanyAntrim ShaleBerea SandChattanoogaFloyd-NealCotton ValleyHaynesville-Bossier, LAHaynesville-Bossier, TXConasuagaAustin Chalk-GiddingsAustin Chalk-OutlyingBudaEagle Ford-Dry ZoneEagle Ford-Oil ZoneEagle Ford-Wet ZoneOlmosPearsallTuscaloosaVicksburgWilcox LoboWoodbineCana Woodford-Dry ZoneCana Woodford-Oil ZoneCana Woodford-Wet ZoneCherokee/Red ForkClevelandGranite NorthBarnett-SouthDavisAverage EURTechnically recoverable resourcesNaturalCrude oilgasNGPL(Bb)(Tcf)(Bb)Area withpotential1(mi2)Averagespacing(wells/mi2)Crude oil2(MMb/well)Natural .2150.00.20.00.10.88.19.92.30.10.30.40.1U.S. Energy Information Administration Assumptions to the Annual Energy Outlook 2022: Oil and Gas Supply Module4
March 2022Table 3. U.S. unproved technically recoverable tight and shale oil and natural gas resources by play (asof January 1, 2020) cky MountainDenverDenverGreater Green RiverGreater Green RiverParadoxPowder RiverSan JuanSan JuanSan JuanSan JuanSouthwestern WyomingSouthwestern WyomingSouthwestern WyomingSouthwestern WyomingSouthwestern inta-PiceanceUinta-PiceanceUinta-PiceanceWind RiverNorthern Great PlainsMontana Thrust BeltNorth-Central MontanaNorth-Central MontanaPowder WillistonWillistonWillistonWest CoastSan Joaquin/Los AngelesAverage EURTechnically recoverable resourcesArea withpotentiala(mi2)Averagespacing(wells/mi2)Crude oilb(MMb/well)Natural gas(Bcf/well)Crude oil(Bb)Natural gas(Tcf)NGPL(Bb)AboAlpine HighAvalon/Bone 1Denver/JulesNiobraraHilliard-Baxter-MancosTight Oil PlaysFractured InterbedTight Oil PlaysDakotaLewisMesaverdePictured CliffsFort Union-Fox HillsFrontierLanceLewisTight Oil PlaysIles-MesaverdeMancosManning CanyonTight Oil PlaysWasatch-MesaverdeWilliams ForkFort .50.10.10.50.00.90.00.09566.30.0070.032Total tight and shale0.0195.40.21,712.90.0115.9PlayTight Oil PlaysBowdoin-GreenhornHeathTight Oil PlaysBakken CentralBakken Eastern TransitionalBakken Elm Coulee-Billings NoseBakken Nesson-Little KnifeBakken Northwest TransitionalBakken Three ForksGammonJudith River-EagleMonterey/SantosSource: U.S. Energy Information Administration, Office of Energy AnalysisNote: mi2 square miles, MMb million barrels, Bcf billion cubic feet, Bb billion barrels, Tcf trillion cubic feetEUR estimated ultimate recovery, NGPL natural gas plant liquids.aArea of play that is expected to have unproved technically recoverable resources remaining.bIncludes lease condensates.U.S. Energy Information Administration Assumptions to the Annual Energy Outlook 2022: Oil and Gas Supply Module5
March 2022Table 4. U.S. unproved technically recoverable coalbed methane resources by play (as of January 1,2020)Average EURNaturalCrude oilbgasMMb/well)(Bcf/well)Technically recoverableresourcesCrude NaturaloilgasNGPL(Bb)(Tcf)(Bb)Area 0.1880.02.90.0Greater Green RiverDeep1,62040.0000.6000.03.90.0Greater Green 3440.0000.6000.03.70.0Divide CreekShallowWhite River DomeBig George/Lower Fort UnionWasatchWyodak/Upper Fort UnionNorthernPurgatoire RiverFairway, New MexicoNorth BasinNorth Basin, ColoradoSouth BasinSouth Menefee, New MexicoFerronSegoAll 2.391Total coalbed ianAppalachianAppalachianIllinoisGulf CoastBlack WarriorBlack WarriorCahabaMidcontinentArkomaCherokee PlatformSouthwestRocky Mountain/DakotasPiceancePiceancePiceancePowder RiverPowder RiverPowder RiverRatonRatonSan JuanSan JuanSan JuanSan JuanSan JuanUintaUintaWyoming Thrust BeltWest CoastWestern WashingtonPlayCentral BasinNorth Appalachian Basin – HighNorth Appalachian Basin – Mod/LowCentral BasinExtension AreaMain AreaCahaba Coal FieldBellinghamSource: U.S. Energy Information Administration, Office of Energy AnalysisNote: mi2 square miles, MMb million barrels, Bcf billion cubic feet, Bb billion barrels, Tcf trillion cubic feetEUR estimated ultimate recovery, NGPL natural gas plant liquids.aArea of play that is expected to have unproved technically recoverable resources remaining.bIncludes lease condensates.The U.S. Geological Survey (USGS) periodically publishes tight and shale resource assessments that weuse as a guide to select key parameters to calculate the TRR we use in the AEO. The USGS assesses therecoverability of shale gas and tight oil based on the wells drilled and technologies deployed at the timeof the assessment. AEO2015 introduced a contour map-based approach for incorporating geologyparameters into the calculation of resources to recognize that geology can vary significantly withincounties. To date, we have only applied this new approach to the Marcellus play.U.S. Energy Information Administration Assumptions to the Annual Energy Outlook 2022: Oil and Gas Supply Module6
March 2022Starting with AEO2017, we have been using new allocation factors for natural gas plant liquids (NGPLs),updating both the gas-to-liquids ratios and the purity splits of the NGPL barrels. AEO2017 reflectedimprovements to the NGPL factors for the Appalachian and Williston Basins, as well as the Eagle Fordformation. We updated allocation factors for the Permian Basin in AEO2018 and the Anadarko Basin inAEO2019. For AEO2022, we updated the Denver Basin NGPL factors. Going forward, we will continue toupdate input drivers generating NGPL production, focusing on plays expected to make increasingcontributions to total U.S. natural gas production. We derived the allocation factors from a combinationof producer public statements and filings, third-party data on production well characteristics, andanalysis of EIA-collected survey data for NGPL production at the natural gas plant level.The AEO TRRs incorporate current drilling, completion, and recovery techniques, which requireadjustments to some of the assumptions used by the USGS to generate its TRR estimates. The AEO TRRsalso incorporate shale gas and tight oil resources not yet assessed by the USGS. If well production dataare available, we analyze the decline curve of producing wells to calculate the expected EUR per wellfrom future drilling.The underlying resource assumptions for the AEO Reference case is uncertain, particularly as explorationand development of tight oil continues to move into areas with little or no production history. Manywells drilled in tight or shale formations using the latest technologies have less than two years ofproduction history, so we cannot fully ascertain the impact of recent technological advancement on theestimate of future recovery. Uncertainty also extends to the extent of formations and the number oflayers in an area that could be drilled within formations. Alternative resource cases are addressed at theend of this document.Lower 48 states onshoreThe Onshore Lower 48 Oil and Gas Supply Submodule (OLOGSS) is a play-level model used to analyzecrude oil and natural gas supply from onshore sources in the Lower 48 states. The methodology includesa comprehensive assessment method for determining the relative economics of various prospects basedon financial considerations, the nature of the resource, and the available technologies. The generalmethodology relies on a detailed economic analysis of potential projects in known fields, EOR projects,and undiscovered resources. The economically viable projects are developed when resourcedevelopment constraints are available to simulate the existing and expected infrastructure of the oil andnatural gas industries. For crude oil projects, the OLOGSS represents advanced secondary or improvedoil recovery techniques (for example, infill drilling and horizontal drilling) and EOR processes (forexample, CO2 flooding, steam flooding, and polymer flooding). For natural gas projects, the OLOGSSrepresents supply from shale formations, tight sands formations, coalbed methane, and other sources.The OLOGSS evaluates the economics of future crude oil and natural gas exploration and developmentfrom the perspective of an operator making an investment decision. An important aspect of theeconomic calculation is the tax treatment, which varies with the type of producer (major, largeindependent, or small independent). The economics of potential future projects reflect the taxtreatment provided by current laws for large independent producers. We assume relevant tax provisionsare unchanged during the life of the investment and costs remain the same during the life of theinvestment based on region, fuel, and process type. Operating losses incurred in the initial investmentperiod are carried forward and are used against revenues generated by the project in later years.U.S. Energy Information Administration Assumptions to the Annual Energy Outlook 2022: Oil and Gas Supply Module7
March 2022Another important assumption that affects the investment decision is the minimum required rate ofreturn, or hurdle rate. The hurdle rate is assumed to be the weighted average cost of capital (WACC)plus 5%. The WACC is determined as follows:WACC DEBTRATIO*BAA*(1-FEDTXR) (1.-DEBTRATIO)*(T10YR OGBETA*OGMRP)whereDEBTRATIO long-term debt ratio (debt share of total capital) 0.40BAA Baa bond rate (from the Macroeconomic Activity Module)FEDTXR federal tax rate 0.21T10YR 10-year Treasury note (from the Macroeconomic Activity Module)OGBETA expected sensitivity to market changes (industry beta) 1.5OGMRP market risk premium 7.5Technological improvementsThe OLOGSS uses a simplified approach to modeling the impact of technology advancement on U.S.crude oil and natural gas costs and productivity to better capture a continually changing technologicallandscape. This approach incorporates assumptions regarding ongoing innovation in upstreamtechnologies and reflects the average annual growth rate in crude oil and natural gas resources pluscumulative production from 1990 between AEO2000 and AEO2015.Areas in tight oil, tight gas, and shale gas plays are divided into two productivity tiers with differentassumed rates of technology change. Tier 1 encompasses actively developing areas, and Tier 2encompasses areas not yet being developed. Once development begins in a Tier 2 area, the rate oftechnological improvement doubles for wells drilled in the early development phase as producersdetermine how to efficiently extract the hydrocarbons and to locate the high productivity areas calledsweet spots (learning by doing). This area is then converted to Tier 1, so technological improvement forcontinued drilling will reflect the rates assumed for Tier 1 areas. This conversion captures the effects ofdiminishing returns on a per-well basis from decreasing well spacing as a result of developmentprogression, the rapid market penetration of technologies, and the ready application of industrypractices and technologies at the time of development. The specific assumptions for the annual averagerate of technological improvement are in Table 5.Table 5. Onshore Lower 48 states technology assumptionsCrude oil andEUR-Tier 2Lease equipmentnatural gasresource typedrilling ramp-Drilling costand operating costEUR-Tier 1EUR-Tier 2up periodTight oil-1.00%-0.50%1.00%3.00%6.00%Tight and shale gas-1.00%-0.50%1.00%3.00%6.00%All other-0.25%-0.25%0.25%NANASource: U.S. Energy Information Administration, Office of Energy AnalysisNote: EUR estimated ultimate recovery.U.S. Energy Information Administration Assumptions to the Annual Energy Outlook 2022: Oil and Gas Supply Module8
March 2022CO2 enhanced oil recoveryFor CO2 miscible flooding, the OLOGSS incorporates both industrial and natural sources of CO2. Theindustrial sources of CO2 are: Hydrogen plantsAmmonia plantsEthanol plantsCement plantsFossil fuel power plantsNatural gas processingCoal/biomass-to-liquids (CBTL) processingThe Electricity Market Module and the Liquid Fuels Market Module determine the volume and cost ofCO2 available from fossil fuel power plants and CBTL, respectively. The volume and cost of CO2 from theother industrial plants are represented at the plant level (3 ammonia, 84 cement, 152 ethanol, 31hydrogen, and 60 natural gas processing plants). Table 6 shows the maximum CO2 available by regionfrom the industrial and natural sources.Table 6. Maximum volume of CO2 availablebillion cubic feetRegionEastGulf CoastMidcontinentSouthwestRocky MountainNorthern Great ntsCementplantsNatural 7100418010660250304016319758West Coast050Source: U.S. Energy Information Administration, Office of Energy AnalysisTechnology and market constraints prevent the total volumes of CO2 from the other industrial sourcesfrom becoming immediately available. The development of the CO2 market is divided into two phases:development and market acceptance. During the development phase, the required capture equipmentis developed, pipelines and compressors are constructed, and no CO2 is available. During the marketacceptance phase, the capture technology is widely implemented and volumes of CO2 first becomeavailable. Table 7 shows the number of years in each development period. Since 2016, CO2 has beenavailable from planned carbon capture and storage (CCS) power plants funded by the AmericanRecovery and Reinvestment Act of 2009 (ARRA).U.S. Energy Information Administration Assumptions to the Annual Energy Outlook 2022: Oil and Gas Supply Module9
March 2022Table 7. CO2 availability assumptionsMarket acceptance phaseSource typeDevelopment phase (years)(years)Natural110Hydrogen plants410Ammonia plants210Ethanol plants410Cement plants710Natural gas processing210Source: U.S. Energy Information Administration, Office of Energy AnalysisUltimate marketacceptance100%100%100%100%100%100%The cost of CO2 from natural sources is tied to the crude oil price. For industrial sources of CO2, the costto the producer includes the cost to capture the CO2, compress it to pipeline pressure, and transport theCO2 to the project site via a regional pipeline. Industrial CO2 is represented by cost curves with thefollowing cost ranges in 2017 /million cubic feet: Hydrogen plants: 7.80 to 22.20Ammonia plants: 2.90 to 3.00Ethanol plants: 2.30 to 5.40Cement plants: 6.50 to 15.70Natural gas processing: 2.10 to 4.00Interregional transportation costs add 0.40 per thousand cubic feet for every region crossed. The costof CO2 to the producer from all industrial sources reflects the impact of tax credits for CO2 capture andsequestration, if applicable.Lower 48 states offshoreMost of the Lower 48 states’ offshore crude oil and natural gas production comes from the deepwaterFederal Offshore Gulf of Mexico (GOM). Production from currently producing fields and industryannounced discoveries largely determines the near-term crude oil and natural gas productionprojection.For currently producing oil fields, we assume production has a 10%–15% exponential decline. Wecurrently assume producing natural gas fields have a 30% exponential decline. We assume fields thatbegan production after 2018 remain at their peak production levels for two years before declining.Table 8 shows the assumed field size and year of initial production of the major announced deepwaterdiscoveries that were not brought into production by 2020. We assume a field that is announced as anoil field to be 100% oil and a field that is announced as a natural gas field to be 100% natural gas. If afield is expected to produce both oil and natural gas, we assume 70% to be oil and 30% to be naturalgas.We assume production to ramp up to a peak level in three years, remain at peak until the ratio ofcumulative production to initial resource reaches 10%, and then decline at an exponential rate of 30%for natural gas fields and 25% for oil fields.U.S. Energy Information Administration Assumptions to the Annual Energy Outlook 2022: Oil and Gas Supply Module10
March 2022Table 8. Assumed size and initial production year of major announced deepwater discoveriesField/project nameBlacktipBahaWhaleGotchaPerdido Phase 2Vicksburg BGettysburg WestSpruanceNorth PlatteKatmaiOrlovKhaleesiSamuraiMormontWildling Phase 2WarriorShenzi NorthPoseidonAtlantis North Phase 3CalpurniaMad Dog North WestAnchorParmerArgos Mad Dog Phase 2Heidelberg Phase 2TiberKaskidaKaskida Phase 2LeonMoccasinSicilyBuckskin Phase 2PralineRampart DeepHoffe ParkGenovesaManuelRydbergFort SumterBallymoreCalliopeDoverEsoxThunder Horse South Phase 2TaggartOursePower NapVitoPhobosShenandoah Phase 1Shenandoah Phase 9WR052WR052Waterdepth 86,0376,037Year 009201320092009Field 214121313Field 2390317623239035790176176U.S. Energy Information Administration Assumptions to the Annual Energy Outlook 2022: Oil and Gas Supply ModuleStart year 202320312024202911
March 2022Table 8. Assumed size and initial production year of major announced deepwater discoveries (cont.)Water depthYear ofField/Project nameBlock
The TRR estimates that we use for each Annual Energy Outlook (AEO) are based on the latest available well production data and information from other federal and state governmental agencies, industr ies, and academia. Table 1. Technically recoverable U.S. crude oil resources as of January 1, 2020 . Region Proved reserves,