Transcription
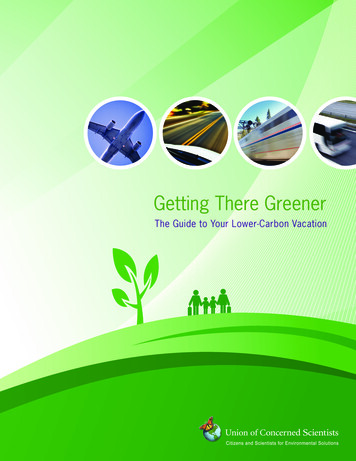
Getting There GreenerThe Guide to Your Lower-Carbon Vacation
Getting There GreenerThe Guide to Your Lower-Carbon VacationUnion of Concerned ScientistsDecember 2008
iiUnion of Concerned Scientists 2008 Union of Concerned ScientistsAll rights reservedThe Union of Concerned Scientists is the leading science-based nonprofitworking for a healthy environment and a safer world.The UCS Clean Vehicles Program develops and promotes strategies to reducethe adverse environmental impact of the U.S. transportation system.More information about the Union of Concerned Scientists and the CleanVehicles Program is available on the UCS website at www.ucsusa.org.The full text of this report is available online (in PDF format) atwww.ucsusa.org/publications or may be obtained from:UCS PublicationsTwo Brattle SquareCambridge, MA 02238-9105Or, email pubs@ucsusa.org or call (617) 547-5552.Design: Catalano Design
Getting There GreenerContentsFigures & TablesivContributors & AcknowledgmentsviExecutive Summary1Chapter 1Rules of the Road for a Greener Vacation7Chapter 2Air Travel10Chapter 3Automobile Travel16Chapter 4Rail Travel20Chapter 5Motor Coach Travel23Chapter 6The Greenest Travel Option for You26Chapter 7Rules of Thumb for Getting There Greener31Appendix A: Methodology33Appendix B: Aircraft Data36Appendix C: Automobile Data42Appendix D: Rail Data44Appendix E: Motor Coach Data47Appendix F: Comparing Carbon Footprints for Each Travel Mode49Endnotes51Photo & Map Credits53iii
ivUnion of Concerned ScientistsFigures & TablesFiguresFigure 1: Elsen Family Commute vs. First-Class Vacation7Figure 2: Elsen Family Commute vs. Lower-Carbon Vacation9Figure 3: Effect of Seat Class on Carbon Footprint11Figure 4: Carbon Footprint of Nonstop vs. Connecting Flights12Figure 5: Carbon Footprint of Driving to Airport for Nonstop Flight vs. Taking Flight with Connections12Figure 6: Carbon Emissions Depend on the Route You Take13Figure 7: Seat Configurations in the Boeing 737-300 (733)14Figure 8: U.S. Airports with the Longest Delays, 200715Figure 9: Total CO2 Emissions, 500-Mile Trip17Figure 10: Auto Emission Factors, by Number of People Traveling Together17Figure 11: Projected U.S. Road Congestion, 202018Figure 12: Carbon Emissions Depend on the Auto You Drive19Figure 13: Amtrak’s U.S. Routes21Figure 14: U.S. Intercity Bus Service, 200524Figure 15: Selected Routes for U.S. Vacation Trips26Figure 16: Comparing Carbon Footprints: Solo Traveler27Figure 17: Comparing Carbon Footprints: Two Travelers28Figure 18: Comparing Carbon Footprints: Family of Four28Figure 19: Harry’s Heading Out Solo29Figure 20: Rita and Louie Head to Vegas, Baby!30Figure 21: The Elsens Are Going to Disney World30Figure 22: Carbon Footprints, by Vehicle31Figure 23: Comparing Carbon Footprints across All Modes: Solo Traveler49Figure 24: Comparing Carbon Footprints across All Modes: Two Travelers49Figure 25: Comparing Carbon Footprints across All Modes: Family of Four50
Getting There GreenerTablesTable 1: Carbon Footprint of Air Travel, by Aircraft14Table 2: Estimated Costs of Driving Different Vehicles19Table 3: Take Me Out to the Ballgame22Table 4: Carbon Footprints by Vehicle and Travel Distance27Table 5: Distances between Popular Vacation Route Origins and Destinations, in Miles34Table 6: Average Aircraft Emission Factors, by Type37Table 7: Aircraft CO2 Emissions from Takeoff/Landing and Approach38Table 8: Aircraft CO2 Emissions from Ground Operations39Table 9: Aircraft CO2 Emissions from In-Flight Cruising ( 3,000 ft.)40Table 10: Calculations of Seat Area for Sample Aircraft41Table 11: Per-Vehicle CO2 Emissions by Vehicle Type and Number of Occupants42Table 12: Per-Passenger CO2 Emissions by Vehicle Type and Number of Occupants43Table 13: Total CO2 Emissions from Automobiles by Number of Travelers and Distance43Table 14: Estimate of Emission Factor for Diesel Rail, 200544Table 15: Estimate of Emission Factor for Electric Rail, 200545Table 16: Total CO2 Emissions from Rail by Number of Travelers and Distance46Table 17: Estimates of Emission Factor for Motor Coaches47Table 18: Total CO2 Emissions from Motor Coaches by Number of Travelers and Distance48
viUnion of Concerned ScientistsContributors & AcknowledgmentsThis report was made possible through the generous support of Foundation M,Oak Foundation, The Energy Foundation, The Pew Charitable Trusts, The Williamand Flora Hewlett Foundation, and Wallace Global Fund, with additional support fromNoraLee and Jon Sedmak.Scott Nathanson, Rich Hayes, and Jim Kliesch of the Union of Concerned Scientists(UCS) were instrumental in the conception and production of this report. DeborahGordon, an independent transportation policy consultant, developed the initial draft,along with the core methodology used to compare fuel cycle carbon emissions fromdifferent vacation travel modes. UCS staff members David Friedman, MichelleRobinson, Patricia Monahan, and Don Anair provided additional review and suggestions.The authors would like to thank Sandra Hackman for her efforts and skill in editingunder a tight timeline, and Rob Catalano for his design and layout talents.We would also like to thank several experts for reviewing specific topics and chaptersand providing valuable input. John Davies of the U.S. Environmental Protection Agencycommented on the methodology. John Putnam of Kaplan Kirsch & Rockwell, whochairs the Subcommittee on Aviation and Climate Change at the National AcademiesTransportation Research Board, and Anja Kollmuss, of the Stockholm EnvironmentInstitute, reviewed the chapter on air travel. Ross Capon and Matthew Melzer, NationalAssociation of Railroad Passengers, and Scott Leonard and Roy Deitchman, Amtrak,reviewed the chapter on rail travel. Dana Lowell of M.J. Bradley & Associates reviewedthe information on intercity motor coaches. Stuart Cohen of TransForm (formerly theTransportation and Land Use Coalition) provided helpful guidance on the accounting ofmotor coach and rail emissions.The opinions in this report do not reflect those of the individuals who reviewed andcommented on it. UCS alone is responsible for the content.
Getting There GreenerExecutive SummaryOne Vacation Can Be Worse ThanCommuting for a YearMeet the Elsens, our eco-conscious family of four from thesuburbs of Chicago. They’vebeen trying to minimize theirimpact on the environment,especially when it comes totheir commute. Dad drives aChevy Malibu for his 10-mileround-trip travel to and fromwork. Mom recently switchedfrom a Ford Explorer to a more efficient Ford Escape forher daily 25 miles of travel, which includes driving roundtrip to work and carpooling the kids to and from afterschool activities.This year, with the holidays coming up, the Elsensdecided to pull out all the stops for their first trip toDisney World and use frequent flyer miles to travel firstclass. The available flight includes a layover in Houston,but the family figured that deluxe seats were worth theextra time. However, take a look at the resulting carbonfootprint (see the figure to the right).Yes, you’re reading that right—the Elsens’ one vacation splurge produces more than one and a half times theglobal warming pollution created by their whole year ofweekday commuting. These stats are a sobering reminder that our carbon footprint is not merely a product of ourdaily habits, but of our vacation habits as well.Fortunately, a number of travel options are greenerthan those the Elsens selected. This new guide givesAmericans the tools they need to make sure they’regetting there greener.Your Guide to a Greener VacationHow are you traveling? Where are you going?Who’s tagging along?This report provides the first comprehensive analysis—peer-reviewed by experts—of the highest-carbon andlowest-carbon options for vacation travel. In our matrix,three key factors determine the environmental impact ofyour travel: (1) the type of vehicle you are taking; (2) thedistance you are traveling; and (3) the number of peopletraveling with you. Based on these factors, our analysiscan tell you how environmentally sound—or perhapsunsound—your travel plans are.Of course, Americans’ travel is not a matter of absolutes, as different regions have access to different transportation options. As you plan your journey, the table onthe next page can help you evaluate each option for solo,couple, or family travel. What you find might surpriseyou, as your best travel bet can shift significantlydepending on the distance you travel and the size ofyour party.Elsen Family Commute vs. First-Class Vacation12,000Total CO2 Emissions (Pounds)While the idea of “green” vacations has attractedrecent attention, most information focuses onwhat to do when you get to your destination, not on howto get there. No definitive source has been available toguide travelers toward the greenest travel option—trains,planes, automobiles, or motor coach (a.k.a. buses)—fortheir particular vacation.This report turns an analytical eye toward the environmental impact of domestic vacation travel, where globalwarming pollution—largely in the form of carbon dioxide(CO2) emissions—can add up quickly. The results of ouranalysis may surprise you.10,0008,0006,0004,0002,0000Family AnnualWeekday CommuteFamily First-ClassVacationNotes: This comparison assumes that the Elsens’ Chevy Malibu gets 25 miles pergallon, their two-wheel-drive Ford Escape gets 23 mpg, and the family takes fourfirst-class round-trip flights from Chicago to Orlando via Houston. Weekday commutingrepresents 35 percent of the Elsens’ average annual automobile travel. See AppendicesB and C for emission factors of air and automobile travel used in this analysis.
Union of Concerned ScientistsVacation Traveler Carbon GuideFor each grouping, travel options are listed from best to worst. Steer toward the greenest and try to avoidthose in red!Best Travel Options: Solo TravelerWorstBest100 miles500 miles1,000 milesTake motor coachTake motor coachTake motor coachTake trainTake trainFly economyFly economyFly economyTake trainDrive typical carDrive typical carFly first-classDrive typical SUVFly first-classDrive typical carFly first-classDrive typical SUVDrive typical SUVBest Travel Options: Two TravelersWorstBest100 miles500 miles1,000 milesTake motor coachTake motor coachTake motor coachTake trainTake trainFly economyDrive typical carDrive typical carTake trainDrive typical SUVFly economyDrive typical carFly economyDrive typical SUVDrive typical SUVFly first-classFly first-classFly first-classBest Travel Options: Family of FourBest100 milesWorst 500 miles1,000 milesTake motor coachTake motor coachTake motor coachDrive typical carDrive typical carDrive typical carDrive typical SUVDrive typical SUVDrive typical SUVTake trainTake trainFly economyFly economyFly economyTake trainFly first-classFly first-classFly first-classNotes: We based the color-coded ranking on the distribution of CO2 emissions across modes. The analysis assumes typical car and typical SUV fuel economiesof 23 mpg and 18 mpg, respectively. Train emissions reflect an average of electric and diesel operations. The analysis assumes use of turboprops for 100mile flights, regional jets for 500-mile flights, and narrow-body jets for 1,000-mile flights, based on information from the Federal Aviation Administration. Weassumed that all flights are nonstop. For more on the emission factors for each mode, see Appendices B, C, D, and E. To compare emissions across modes,see Appendix F.
Getting There GreenerThe table to the left gives travelers an easy way tocompare travel options to fit their needs. However, ourGetting There Greener analysis also enabled us to create“rules of thumb” to help guide your initial travel choices,and to help you shrink your carbon footprint once youhave made those choices. Let’s start with the top traveltips, and then look more closely at each travel mode:Motor coaches and trains are a carbon bargain.Whether traveling with a family, with a partner, oralone, those seeking a carbon bargain should seriouslyconsider rail and motor coach travel. Intercity busoptions have been on the upswing, as numerousregional carriers now provide coaches with verycomfortable seats. And Amtrak offers everythingfrom high-speed rail service in the Northeast to “autotrains” that enable long-distance travel without thewear and tear on your automobile. From a carbonperspective, motor coaches and trains are amongyour lowest-emission options, especially on shorter(less than 500-mile) trips. Moreover, because motorcoaches and trains are often underused, they mayoffer what amounts to a carbon “free ride.”Big SUVs and first-class flights usually have thelargest carbon footprints. Driving alone, drivinginefficient SUVs (with or without other people), andflying first-class are the most polluting ways to go.To reduce your vacation’s carbon footprint, considerother options.For couples and solo travelers, a nonstop coachflight almost always beats an average car. Carbonfrom cars and trucks adds up, especially when thosevehicles travel long distances and are only partiallyoccupied. If you’re traveling alone or with one otherperson, you’re usually better off flying direct in coachthan getting behind the wheel of a passenger vehicle.This is especially true for trips of more than 500 miles.To significantly reduce your carbon footprintbehind the wheel, drive or rent a more efficientcar. If you don’t own a fuel-efficient vehicle, thinkabout renting one when driving on longer trips. Thecarbon emissions from a large, inefficient SUV arenearly four times those of a high-miles-per-gallonhybrid such as the Toyota Prius. If hybrids are notavailable, look into efficient conventional cars, whichcan ease the environmental harm while cutting yourgasoline bill. Many car rental agencies now offerboth hybrids and efficient conventional vehicles.Take advantage of them, and take some wear andtear off your car.Carbon Emissions Depend on the Auto You DriveCouple Traveling 500 Miles1,200CO2 Emissions(Pounds per One-Way Trip)Top Five Rules of Thumb for Green alCarTypicalSUVWorstSUVNotes: Assumes a 46-mpg hybrid car, 32-mpg efficient car, 23-mpg typical car,18-mpg typical SUV, and 12-mpg worst SUV. See Appendix C for details onautomobile emission factors.Avoid traveling during peak periods. Congestionhas a noticeable effect on your fuel consumption andcarbon footprint. When a car or SUV is stuck in traffic,its fuel consumption rate can be double the rate itgets at steady cruising speeds. So think about gettinga GPS unit for your car that can alert you to traffic hotspots in real time and suggest ways to avoid them.(Some sell for as little as 150.) And think aboutchanging your vacation schedule to avoid peak travelperiods that keep you stuck in traffic.Now that you’ve decided whether to fly, drive, ortake a train or motor coach, consider the followingadditional rules of thumb from our analysis of each travelmode, to shave your emissions even further.
Union of Concerned ScientistsVacation Carbon Tips: Air TravelClass matters—save money and save carbon.When choosing seats, avoid first class. Becausea first-class seat takes twice as much spaceas an economy seat, a first-class traveler ondomestic flights is responsible for twice asmuch carbon as someone flying coach.1Don’t stop. Choose nonstop flights overconnecting flights, especially for shorter trips.Because takeoff, landing, and ground operationsproduce a lot of carbon, a 1,000-mile nonstopflight from New York City to Orlando cansave nearly 35 percent compared with a twoconnection flight down the eastern seaboard.If you must stop, fly straight. Travel websitesand agents can show you exactly how manymiles your flight will cover. If you can’t get anonstop flight, fly the most direct route possibleto save carbon.More seats less carbon. Make the marketwork. Choose airlines with all-economy seatingwhen possible, as they have smaller perpassenger carbon footprints.Carbon Emissions Depend on the Route You TakeFlying from Charlottesville, VA, to New York CityCO2 Emissions(Pounds per One-Way Trip) 8006004002000CharlottesvilleNew York CityCharlottesville- CharlottesvilleWashington, DCAtlantaNew York CityNew York CityCharlottesvilleCincinnatiBostonNew York CityNote: This analysis is based on actual routes and the type of aircraftused on each, whether turboprop, regional jet, or narrow-body jet.Vacation Carbon Tips: Automobile TravelSolo and couples vacationing? Keep it inthe garage. Single travelers driving a typicalcar leave a large per-passenger footprint, whilecouples fare only a little better. Unless you’redriving a vehicle that gets more than 45 mpg,look for other options, such as the bus, train,or even plane (economy seating, of course).Keep the family road-trip tradition alive.If you’re planning on bringing the grandparentsor the kids along for the ride, your per-personcarbon footprint shrinks accordingly. This makescars—especially efficient cars—a low-carbonoption for larger groups traveling together.Be car smart. How you pack, how you drive,and how you maintain your vehicle can savesignificant carbon and cash.Congestion guzzles excess gas. Selecttravel times carefully and consider routes thatallow you to avoid getting stuck in rush-hourtraffic—especially if your trip takes you throughcongested areas.
Getting There GreenerVacation Carbon Tips: Rail TravelRide the rails in the Northeast to cut carbonand congestion. The Northeast Corridor isAmtrak’s most highly developed segment, soyou have more options, including high-speedAcela express trains between Washington, DC,and Boston. Because they run on electricity,Northeast Corridor trains are the cleanestrail option.No rental required when training. Unlikemost airports, train stations are often right incity centers, so you don’t have to hail a taxi orrent a car to get downtown, saving pollution aswell as time. Amtrak also offers an “auto train”option that allows passengers to ride the trainwhile bringing their cars along for the ride.Even outside the Northeast, an Amtrakstation might be closer than you think. Checkout your rail options even if you don’t live neara train station. Amtrak’s ThruWay bus serviceconnects most cities to rail stations.Take Me Out to the BallgameHere is one example of a chance to cut carbon emissions by taking the train. Vacationers travelingto Major League Baseball stadiums will find that many are located near train stations:Ballpark (City)Miles from airportMiles from train stationCoors Field (Denver)25.00.4Dodger Stadium (Los Angeles)20.01.8Minute Maid Park (Houston)18.61.1Busch Stadium (St. Louis)14.90.8Camden Yards (Baltimore)9.72.5
Union of Concerned ScientistsVacation Carbon Tips: Motor Coach TravelMotor coaches leave carbon in the dust.A couple boarding a motor coach will cut theircarbon nearly in half, compared with drivingeven a hybrid car. And if they take the motorcoach rather than flying, they will cut theiremissions by 55 to 75 percent, depending onthe distance they travel.Group tours low carbon. Interstate tour-bustravel has seen a major expansion over the pastdecade. So think about that group trip in a new,green way.Not your daddy’s Greyhound. Today manycompanies have ditched their older buses andoffer plush new coaches with everything fromseat-back video to satellite radio to wirelessInternet connections.Where you decide to go and how you get there isentirely up to you. It’s your vacation. But prepped withrules of thumb and information about the carbon footprintof your travel options, perhaps next time you will chooseto get there greener!How We Created Getting There GreenerThis analysis is based on energy consumption, ridership(passenger-miles), and carbon dioxide emissions dataassociated with each mode of travel. We used thatSearch and ye shall find. You can jump-startyour low-carbon vacation with an Internetsearch. Bus travel—unlike air and rail travel—does not have a centralized reservationswebsite (such as Orbitz, Expedia, Travelocity,or amtrak.com), but here are a few addressesto you get started: www.gotobus.com,www.greyhound.com, p. Happy trails!information to compute average “in-use” carbonemissions for each mode, in pounds of CO2 emittedper passenger-mile traveled. We then added upstreamCO2 emissions—those associated with extracting,refining, and transporting a given fuel—to yield totalcarbon dioxide emissions in pounds per passenger-mile.We estimated the amount of emissions accrued per tripby multiplying the resulting emission factors for eachmode by distance traveled.
Getting There GreenerChapter 1Rules of the Road fora Greener VacationToday’s American Vacation Can MeanBig Carbon12,000Total CO2 Emissions (Pounds)Meet the Elsen family—our amalgam of a typicalAmerican family. Greg and Ann Elsen, daughter Sarah,and son Joey live in the suburbs of Chicago, and haverecently taken steps to reduce their carbon footprintand save money at the gas pump. Greg, for example,leaves his sports car in the garage and drives a ChevyMalibu on his 10-mile round-trip commute to work.Sarah, meanwhile, just traded in their old Ford Explorerfor a more fuel-efficient Ford Escape, and is now getting about 23 miles per gallon for her 25 miles of dailywork and errand travel.Now Greg and Ann face another decision: how totravel on their vacation to Disney World during Sarah’supcoming spring break. Despite the expense of flying,they have saved enough credit card points to affordfirst-class seats for the entire family, and an upgradeon a rental car. But to fly free from Chicago to Orlando,they have to take a connecting flight through a hubcity—either Houston or Cleveland. Finding the comfort(and novelty) of first class too good to pass up, theElsens go for it, and decide to fly to Orlando throughHouston.What the Elsens don’t realize is that global warmingemissions from one vacation without a plan to get theregreener can greatly exceed emissions produced during a year of weekday commuting. It turns out that theemissions from flying first-class and making a significantly out-of-the-way stopover really add up (Figure 1).The Elsens’ story is being retold by millions ofAmericans every year. Vacations account for more thanhalf the trips of 100 miles or more that Americans makeeach year.2 U.S. residents take almost 650 million tripsof 50 miles or more every summer.3 In 2006, some 124million Americans took a vacation, traveling an averageof 1,200 miles.4Figure 1. Elsen Family Commute vs.First-Class Vacation10,0008,0006,0004,0002,0000Family AnnualWeekday CommuteFamily First-ClassVacationNote: The comparison assumes that the Elsens’ Chevy Malibu gets 25 miles per gallon,their two-wheel-drive Ford Escape gets 23 mpg, and the family takes four first-classround-trip flights from Chicago to Orlando via Houston. Weekday commuting represents35 percent of the Elsens’ average annual automobile travel.The family car is still the king of American vacation travel, with 82 percent of us hopping in a sedan,wagon, minivan, or sport utility vehicle (SUV) to getaway, though generally at least one vacation trip peryear is made by plane.5 Conversely, travel on motorcoaches (tour buses, intercity buses) and trains accountfor only 3 percent of all U.S. vacation travel.6But these trends are not set in stone. Indeed, asthe effects of climate change increasingly affect theway we live and travel, making carbon count as part ofa vacation plan could, and should, spur Americans torethink the way they travel.This report turns an analytical eye toward this enormous transportation challenge, with the goal of helpingconsumers evaluate the carbon footprint of their vacation travel. Of course, we recognize that people alsocare about the cost, speed, and flexibility of their trips.With that in mind, this report gives Americans a newanalytical tool for identifying greener ways to travel
Union of Concerned Scientiststo their favorite vacation spots—in a way that makessense for them.We have mined information on energy consumption, ridership, and carbon dioxide emissions fromgovernment and other key sources to calculate carbonemissions from auto, train, bus, and airplane travel.Travel TrendsThe way we travel on vacation greatly affectsour carbon footprint. According to recentfigures, Americans take most vacations withtheir partner (62 percent), and the mostpopular destination is a big city (39 percent).8As one might expect, we Americanstend to be weekend travelers. We favorSaturday or Sunday departures for trips offewer than 500 miles, and Friday departuresfor trips of 500 to 1,000 miles. But thesedeparture times—which vacationers canusually control—affect our carbon footprint,because we often hit traffic, especially onsummer weekends. Given that more thanhalf a billion days of vacation go unused inAmerica every year,9 U.S. vacationers couldreally get a win-win simply by extending theirvacation so they can travel on less-congesteddays. (See Chapter 3 for more on the effectof congestion on carbon footprints.)While travel mode and time affect ourvacation carbon footprint, so does the distance we’re traveling. Air travel has helpedcreate a “smaller” America by expanding ourvacation options. As vacation distances grow,travelers shift away from their autos: abouttwo of three vacation travelers fly or useother modes for vacation distances of1,000 to 1,500 miles (one-way). And fewerthan 16 percent of us drive to our destinations when we take vacations of more than1,500 miles.10We have also analyzed how the number of people traveling together affects their carbon footprint. Combinethat with figures on trip distance, and you have the firsttool that can give you your best transportation option,depending on where you are, where you’re going, andhow many people are going with you.7Time to Think GreenWith this report, Americans can now begin to truly factor carbon into their vacation planning choices, no matterwho is going with them and where they’re headed. Let’stake another look at the Elsens, and two other examples,to see how these choices might work in action.Flying greenerThe Elsens have discovered that flying first-class toOrlando through Houston would create a huge carbonfootprint, so they have decided to revise their trip intwo ways: they will fly coach and find a nonstop flight.Their new direct coach flight will cut their carbon emissions roughly 70 percent compared with their originalflight plans. The Elsens have also decided to shave alittle more carbon off their trip by using their upgrade torent a 45-mpg Prius instead of a 19-mpg minivan. Theresult: a far cleaner vacation (Figure 2).Motoring greenerRita and Louie, who live in Santa Ana, CA, want to celebrate their fortieth wedding anniversary in Las Vegasthis January. Instead of taking their Dodge Ram pickup,they’ve decided to travel in a luxury motor coach. Thecoach, which departs from nearby Anaheim and willdrop them off on the Strip, will cost less than the drive,while cutting their carbon emissions from 460 pounds tojust 90 pounds—a reduction of more than 80 percent.All aboard greenerHarry wants to escape the Big Apple on the first day ofspring for a little fly-fishing in Maine. He has decidedto ditch the SUV rental this year and go by train. Hewill cut his carbon emissions 70 percent by making theswitch. And Harry just found out he can save time, too, ifhe takes the higher-speed Acela electric train to Boston,and then continues on Amtrak’s diesel-powered commuter rail to Portland.
Getting There GreenerCurbing Global WarmingThe U.S. transportation sector alone is responsible forsome 40 percent11 of our nation’s fossil-fuel-relatedcarbon dioxide (CO2) emissions—the primary heat-trapping gas responsible for global warming. When releasedinto the air, global warming pollution acts like a blanket,trapping heat in our atmosphere and altering weatherpatterns globally as well as here in the United States.12Global warming is well under way, and will have a widerange of consequences for our health and well-being.Simply put, we need to significantly reduce these heattrapping emissions to avoid the most harmful effects ofglobal warming.This report analyzes each travel mode—planes,trains, automobiles, and motor coaches—and offers rulesof thumb on green vacation travel. The next four chapterstake an in-depth look at your travel options and illustrateseveral opportunities for cutting carbon. As you will see,a little planning can go a long way when it comes toshrinking your vacation carbon footprint.Figure 2. Elsen Family Commute vs. Lower-Carbon VacationTotal CO2 Emissions (Pounds)12,00010,0008,0006,0004,0002,0000Family AnnualWeekday CommuteFamily LowerCarbon VacationNotes: The comparison assumes 250 days of weekday commuting in a Chevy Malibu getting 25 miles per gallon traveling 10miles per day, and a two-wheel-drive Ford Escape getting 23 mpg traveling 25 miles per day. The family vacation includes foureconomy-class round-trip direct flights from Chicago to Orlando. Weekday commuting represents about one-third of the family’stotal annual automobile travel.
10Union of Concerned ScientistsChapter 2Air TravelU.S. air travel has doubled over the past twodecades.13 By 2015, the number of passengerscarried by U.S. commercial airlines will likely hit the 1billion mark.14 This rise in air travel will continue to driveup U.S. carbon emissions, because planes leave a largecarbon footprint owing to their enormous weight andthe long distances they fly. Wide-body jets, for example,can emit 100 pounds of CO2 for every mile they travel;a single cross-country flight can create 150 tons ofglobal warming pollution.On a more positive note, today’s aircraft—widebody and narrow-body jets, regional jets, and turbopropairplanes—travel relatively full, thereby reducing their per-Vacation Carbon Tips: Air Travelpassenger carbon emi
The Union of Concerned Scientists is the leading science-based nonprofit . . Executive Summary. 1 Chapter 1. Rules of the Road for a Greener Vacation 7 Chapter 2. Air Travel 10 Chapter 3. . Scott Nathanson, Rich Hayes, and Jim Kliesch of the Union of Concerned Scientists