Transcription
Growing Old in America:Expectations vs. RealityFOR IMMEDIATE RELEASE: JUNE 29, 2009Paul Taylor, Project DirectorRich Morin, Senior EditorKim Parker, Senior ResearcherD'Vera Cohn, Senior WriterWendy Wang, Research AssociateMEDIA INQUIRIES CONTACT:Pew Research Center’sSocial & Demographic Trends Project202.419.4372http://pewsocialtrends.org
1Table of ContentsOverview and Executive Summary . . . . 2About the Survey and Report . . 13Demographics of Older Americans . 15Section I. Perceptions of Old Age . . 21Section II. Daily Lives of Older Americans . . 42Section III. Family and Friends . . 60Section IV. Intergenerational Relations within Families . 68Section V. Work and Retirement . . . 87Survey Methodology . . 93Survey Topline . . .106Appendices . . . 147Related Pew Research Center Reports . . 150
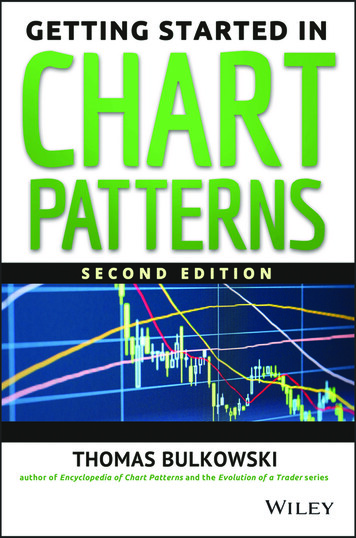
2Growing Old in America:Expectations vs. RealityOverview and Executive SummaryGetting old isn’t nearly as bad as people think it will be. Nor is it quite as good.On aspects of everyday life rangingfrom mental acuity to physicaldexterity to sexual activity tofinancial security, a new PewResearch Center Social &Demographic Trends survey onaging among a nationallyrepresentative sample of 2,969adults finds a sizable gap betweenthe expectations that young andmiddle-aged adults have about oldage and the actual experiencesreported by older Americansthemselves.The Markers of Old Age% saying that a person is old when he or she Turns 857976Can't live independentlyCan't drive a car6662Turns 7551Frequently forgets familiar namesFinds his/her health is failing47Has trouble walking up stairs45Has bladder control problemsIs no longer sexually active4233These disparities come into32Turns 65sharpest focus when survey23Retires from workrespondents are asked about a15Has grandchildrenseries of negative benchmarksoften associated with aging, such as13Has gray hairillness, memory loss, an inabilityNote: Asked of all 2,969 adults in the survey.to drive, an end to sexual activity,a struggle with loneliness anddepression, and difficulty paying bills. In every instance, older adults report experiencing them at lower levels(often far lower) than younger adults report expecting to encounter them when they grow old.1At the same time, however, older adults report experiencing fewer of the benefits of aging that younger adultsexpect to enjoy when they grow old, such as spending more time with their family, traveling more for pleasure,having more time for hobbies, doing volunteer work or starting a second career.These generation gaps in perception also extend to the most basic question of all about old age: When does itbegin? Survey respondents ages 18 to 29 believe that the average person becomes old at age 60. Middle-aged1See Page 6 for a discussion of the challenges of reaching a representative sample of older adults with a telephone survey.
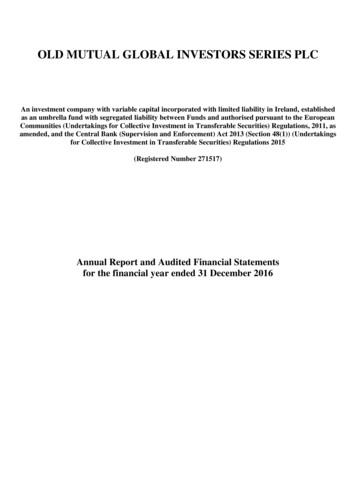
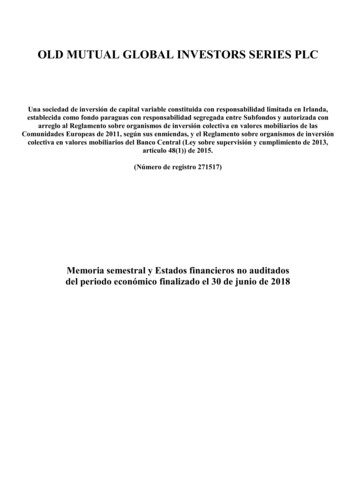
3respondents put the threshold closer to70, and respondents ages 65 and abovesay that the average person does notbecome old until turning 74.Other potential markers of old age—such as forgetfulness, retirement,becoming sexually inactive,experiencing bladder controlproblems, getting gray hair, havinggrandchildren—are the subjects ofsimilar perceptual gaps. For example,nearly two-thirds of adults ages 18 to29 believe that when someone“frequently forgets familiar names,”that person is old. Less than half of alladults ages 30 and older agree.However, a handful of potentialmarkers—failing health, an inability tolive independently, an inability todrive, difficulty with stairs—engenderagreement across all generations aboutthe degree to which they serve as anindicator of old age.Grow Older, Feel YoungerMost Markers of Old Age Differ for Young and Old% saying that a person is old when he or she Age of respondents18-2930-4950-6465 63Frequentlyforgetsfamiliarnames48454751Has bladdercontrolproblems38384046293230Is no longersexually active44Retires13102329Hasgrandchildren12109Note: Sample sizes for subgroups are as follows: 18-29, n 381; 30-49,n 625; 50-64, n 606; 65 n 1,332.The survey findings would seem toconfirm the old saw that you’re nevertoo old to feel young. In fact, it shows that the older people get, the younger they feel—relatively speaking. Among18 to 29 year-olds, about half say they feel their age, while about quarter say they feel older than their age andanother quarter say they feel younger. By contrast, among adults 65 and older, fully 60% say they feel youngerthan their age, compared with 32% who say they feel exactly their age and just 3% who say they feel older thantheir age.Moreover, the gap in years between actual age and “felt age” widens as people grow older. Nearly half of allsurvey respondents ages 50 and older say they feel at least 10 years younger than their chronological age. Amongrespondents ages 65 to 74, a third say they feel 10 to 19 years younger than their age, and one-in-six say theyfeel at least 20 years younger than their actual age.In sync with this upbeat way of counting their felt age, older adults also have a count-my-blessings attitude whenasked to look back over the full arc of their lives. Nearly half (45%) of adults ages 75 and older say their life hasturned out better than they expected, while just 5% say it has turned out worse (the remainder say things have
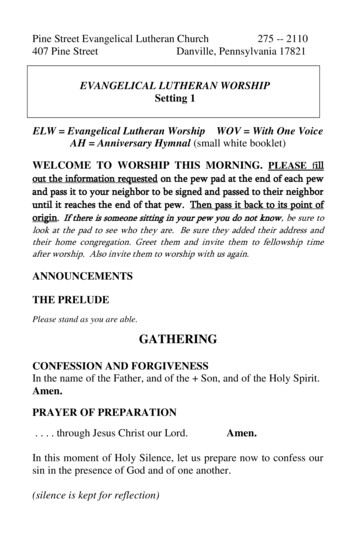
4turned out the way they expectedor have no opinion). All other agegroups also tilt positive, butconsiderably less so, when askedto assess their lives so far againsttheir own expectations.The Downside of GettingOldThe Gap between How Old We Are and How Old We FeelAverages for actual age vs. felt age90828070716050Actual ageFelt age40To be sure, there are burdens thatcome with old age. About one-in3024four adults ages 65 and older2023report experiencing memory loss.10About one-in-five say they have aserious illness, are not sexually018-2930-4950-64active, or often feel sad ordepressed. About one-in-six reportNote: Asked of all 2,969 adults in the survey.they are lonely or have troublepaying bills. One-in-seven cannotdrive. One-in-ten say they feel they aren’t needed or are a burden to others.65-7475 But when it comes to these and other potential problems related to old age, the share of younger and middleaged adults who report expecting to encounter them is much higher than the share of older adults who reportactually experiencing them.The Challenges of AgingIt’s not as bad as younger adults thinkMoreover, these problems arenot equally shared by all groupsAges 18-64 expect.Ages 65 experience of older adults. Those with lowGapincomes are more likely than2532Memory loss 57those with high incomes to face31these challenges. The only1445Not able to driveexception to this pattern has to212142A serious illnessdo with sexual inactivity; the132134Not sexually activelikelihood of older adults2029Feeling sad or depressed9reporting a problem in this92920Not feeling neededrealm of life is not correlatedwith income.2917Loneliness12Not surprisingly, troublesassociated with aging accelerateas adults advance into their 80sand beyond. For example,Trouble paying bills24Being a burden241610Note: Asked of adults 18-64, n 1,631; and adults 65 , n 1,332.814
5about four-in-ten respondents (41%) ages 85 and older say they are experiencing some memory loss, comparedwith 27% of those ages 75-84 and 20% of those ages 65-74. Similarly, 30% of those ages 85 and older say theyoften feel sad or depressed, compared with less than 20% of those who are 65-84. And a quarter of adults ages85 and older say they no longer drive, compared with 17% of those ages 75-84 and 10% of those who are 6574.But even in the face of these challenges, the vast majority of the “old old” in our survey appear to have madepeace with their circumstances. Only a miniscule share of adults ages 85 and older—1%—say their lives haveturned out worse than they expected. It no doubt helps that adults in their late 80s are as likely as those in their60s and 70s to say that they are experiencing many of the good things associated with aging—be it time withfamily, less stress, more respect or more financial security.The Upside of Getting OldWhen asked about a wide range of potential benefits of old age, seven-in-ten respondents ages 65 and older saythey are enjoying more time with their family. About two-thirds cite more time for hobbies, more financialsecurity and not having to work. About six-in-ten say they get more respect and feel less stress than when theywere younger. Just over half cite more time to travel and to do volunteer work. As the nearby chart illustrates,older adults may not beexperiencing theseThe Benefits of Growing OlderReality doesn’t measure up to expectations“upsides” at quite theAges 18-64 expect.Ages 65 experience prevalence levels thatGapmost younger adults12More time for hobbies/interests 8765expect to enjoy themMore time with family 867016once they grow old, but28Volunteer work5280their responsesnonetheless indicate that25More travel5277the phrase “golden years”6467More financial security3is something more than a5965Less stress6syrupy greeting card6658Not working-8sentiment.More respect5659-3Of all the good things251439Second careerabout getting old, theNote: Asked of adults 18-64, n 1,631; and adults 65 , n 1,332.best by far, according toolder adults, is being ableto spend more time withfamily members. In response to an open-ended question, 28% of those ages 65 and older say that what theyvalue most about being older is the chance to spend more time with family, and an additional 25% say that aboveall, they value time with their grandchildren. A distant third on this list is having more financial security, whichwas cited by 14% of older adults as what they value most about getting older.
6People Are Living LongerThese survey findings come at a time when older adults account for record shares of the populations of theUnited States and most developed countries. Some 39 million Americans, or 13% of the U.S. population, are 65and older—up from 4% in 1900. The century-long expansion in the share of the world’s population that is 65and older is the product of dramatic advances in medical science and public health as well as steep declines infertility rates. In this country, the increase has leveled off since 1990, but it will start rising again when the firstwave of the nation’s 76 million baby boomers turn 65 in 2011. By 2050, according to Pew Research projections,about one-in-five Americans will be over age 65, and about 5% will be ages 85 and older, up from 2% now.These ratios will put the U.S. at mid-century roughly where Japan, Italy and Germany—the three “oldest” largecountries in the world—are today.Contacting Older AdultsAny survey that focuses on older adults confronts one obvious methodological challenge: A small but notinsignificant share of people 65 and older are either too ill or incapacitated to take part in a 20-minute telephonesurvey, or they live in an institutional setting such as a nursing home where they cannot be contacted.2We assume that the older adults we were unable to reach for these reasons have a lower quality of life, onaverage, than those we did reach. To mitigate this problem, the survey included interviews with more than 800adults whose parents are ages 65 or older. We asked these adult children many of the same questions about theirparents’ lives that we asked of older adults about their own lives. These “surrogate” respondents provide awindow on the experiences of the full population of older adults, including those we could not reach directly.Not surprisingly, the portrait of old age they draw is somewhat more negative than the one painted by olderadult respondents themselves. We present a summary of these second-hand observations at the end of Section Iin the belief that the two perspectives complement one another and add texture to our report.Here is a summary of other key findings from the survey:2According to U.S. Census Bureau figures, about 5% of all adults ages 65 and older are in a nursing home. For adults ages 85 and older, thisfigure rises to about 17%.
7Perceptions about AgingThe Generation Gap, CircaAt What Age Does the Average Person Become Old?2009. In a 1969 Gallup Poll, 74% ofMean age shownrespondents said there was a generationAge of respondents18-2930-4950-6465 gap, with the phrase defined in the surveyquestion as “a major difference in the60point of view of younger people and69Age ofolder people today.” When the samebecoming old72question was asked a decade later, in741979, by CBS and The New York Times,just 60% perceived a generation gap. ButNote: Asked of all 2,969 adults in the survey.in perhaps the single most intriguingfinding in this new Pew Research survey,the share that say there is a generation gap has spiked to 79%—despite the fact that there have been few overtgenerational conflicts in recent times of the sort that roiled the 1960s. It could be that the phrase now meanssomething different, and less confrontational, than it did at the height of the counterculture’s defiant challengesto the establishment 40 years ago. Whatever the current understanding of the term “generation gap,” roughlyequal shares of young, middle-aged and older respondents in the new survey agree that such a gap exists. Themost common explanation offered by respondents of all ages has to do with differences in morality, values andwork ethic. Relatively few cite differences in political outlook or in uses of technology.When Does Old Age Begin? At 68. That’s the average of all answers from the 2,969 survey respondents. Butas noted above, this average masks a wide, age-driven variance in responses. More than half of adults under 30say the average person becomes old even before turning 60. Just 6% of adults who are 65 or older agree.Moreover, gender as well as age influences attitudes on this subject. Women, on average, say a person becomesold at age 70. Men, on average, put the number at 66. In addition, on all 10 of the non-chronological potentialmarkers of old age tested in this survey, men are more inclined than women to say the marker is a proxy for oldage.Are You Old? Certainly not! Public opinion in the aggregate may decree that the average person becomes oldat age 68, but you won’t get too far trying to convince people that age that the threshold applies to them.Among respondents ages 65-74, just 21% say they feel old. Even among those who are 75 and older, just 35%say they feel old.What Age Would You Like to Live To? The average response from our survey respondents is 89. One-infive would like to live into their 90s, and 8% say they’d like to surpass the century mark. The public’s verdict onthe most desirable life span appears to have ratcheted down a bit in recent years. A 2002 AARP survey foundthat the average desired life span was 92.
8Everyday LifeWhat Do Older People DoThe Daily Activities of Older AmericansEvery Day? Among all adultsIn the past 24 hours did you ?ages 65 and older, nine-in-tentalk with family or friendsTalk with family or friends90every day. About eight-in-tenRead a book, magazine, newspaper83read a book, newspaper orTake a prescription medication83magazine, and the same sharetakes a prescription drug daily.Watch more than 1 hour of TV77Three-quarters watch morePray76than a hour of television;Drive a car65about the same share prays43Spend time on a hobbydaily. Nearly two-thirds drivea car. Less than half spendTake a nap40time on a hobby. About fourGo shopping39in-ten take a nap; about theUse the internet28same share goes shopping.Roughly one-in-four use theGet some type of vigorous exercise22internet, get vigorous exerciseHave trouble sleeping22or have trouble sleeping. JustGet into an argument 44% get into an argument withsomeone. As adults moveNote: Based on adults 65 and older, n 1,332.deeper into their 70s and 80s,daily activity levels diminishon most fronts—especially when it comes to exercising and driving. On the other hand, daily prayer and dailymedication both increase with age.Are Older Adults Happy? They’re about ashappy as everyone else. And perhaps moreimportantly, the same factors that predicthappiness among younger adults—good health,good friends and financial security—by and largepredict happiness among older adults. However,there are a few age-related differences in life’shappiness sweepstakes. Most notably, once allother key demographic variables are heldconstant, being married is a predictor of happinessamong younger adults but not among older adults(perhaps because a significant share of the lattergroup is made up of widows or widowers, manyHappy at Any Age?Would you say that you are ?Very happyAllPretty happy32Not too happy4915Age of respondents18-293730-493450-6465-7475 2732285395048444314201919Note: Asked of all 2,969 adults in the survey. “Don’tknow/Refused” responses not shown.
9of whom presumably have “banked” some of the key marriage-related correlates of happiness, such as financialsecurity and a strong family life). Among all older adults, happiness varies very little by age, gender or race.Retirement and Old Age.Retirement is a place without clearOlder Americans’ Living Arrangementsborders. Fully 83% of adults ages 65 andolder describe themselves as retired, butAll65-74 75-8485 the word means different things toCurrently living in:different people. Just three-quarters ofOwn home or apartment92959080Child’s home2133adults (76%) 65 and older fit the classicOther family member’s home1112stereotype of the retiree who hasAssisted living facility42415Other1111completely left the working worldbehind. An additional 8% say they areLive in age-restrictedretired but are working part time, whilecommunity?*Yes10611202% say they are retired but working fullNo89938875time and 3% say they are retired butlooking for work. The remaining 11% ofLive alone?Yes41304766the 65-and-older population describeNo58705234themselves as still in the labor force,though not all of them have jobs.Note: “Don’t know/Refused” responses not shown.* Based on those living in their own home/apartment.Whatever the fuzziness around thesedefinitions, one trend is crystal clearfrom government data3: After falling steadily for decades, the labor force participate rate of older adults began totrend back upward about 10 years ago. In the Pew Research survey, the average retiree is 75 years old andretired at age 62.Living Arrangements. More than nine-in-ten respondents ages 65 and older live in their own home orapartment, and the vast majority are either very satisfied (67%) or somewhat satisfied (21%) with their livingarrangements. However, many living patterns change as adults advance into older age. For example, just 30% ofadults ages 65-74 say they live alone, compared with 66% of adults ages 85 and above. Also, just 2% of adultsages 65-74 and 4% of adults ages 75-84 say they live in an assisted living facility, compared with 15% of thoseages 85 and above.Old-School Social Networking. The great majority of adults ages 65 and older (81%) say they have peoplearound them, other than family, on whom they can rely for social activities and companionship. About threequarters say they have someone they can talk to when they have a personal problem; six-in-ten say they havesomeone they can turn to for help with errands, appointments and other daily activities. On the flip side of the3Changes in Social Security legislation, along with the transition from defined-benefit to defined-contribution pension plans, have in recent yearsincreased incentives to work at older ages. For more detail, see Abraham Mosisa and Steven Hipple, “Trends in Labor Force Participation in theUnited States,” Monthly Labor Review (October 2006): 35-57. According to the U.S. Bureau of Labor Statistics, the labor force participation rateof adults 65 and over (that is, the share of this population that is either employed or actively looking for work) rose to 16.8% in 2008 from 12.9%in 2000.
10coin, three-in-ten older adults say they “often” help out other older adults who are in need of assistance, and anadditional 35% say they sometimes do this. Most of these social connections remain intact as older adultscontinue to age, but among those 85 and above, the share that say they often or sometimes provide assistance toothers drops to 44%.The Twitter Revolution Hasn’t Landed Here. Ifthere’s one realm of modern life where old and youngbehave very differently, it’s in the adoption ofnewfangled information technologies. Just four-in-tenadults ages 65-74 use the internet on a daily basis, andthat share drops to just one-in-six among adults 75 andabove. By contrast, three-quarters of adults ages 18-30go online daily. The generation gap is even widerwhen it comes to cell phones and text messages.Among adults 65 and older, just 5% get most or all oftheir calls on a cell phone, and just 11% sometimesuse their cell phone to send or receive a text message.For adults under age 30, the comparable figures are72% and 87%, respectively.Religion and Old Age. Religion is a far bigger partof the lives of older adults than younger adults. Twothirds of adults ages 65 and older say religion is veryimportant to them, compared with just over half ofthose ages 30 to 49 and just 44% of those ages 18 to 29.Moreover, among adults ages 65 and above, a third(34%) say religion has grown more important to themover the course of their lives, while just 4% say it hasbecome less important and the majority (60%) say it hasstayed the same. Among those who are over 65 andreport having an illness or feeling sad, the share who saythat religion has become more important to them risesto 43%.The Cell Phone GapOf all the telephone calls you receive, are ?All/most calls on cell phoneSome calls on cell/some on regularVery few or no calls on cell7218-2930-4950-6465 514393423263921133773Note: Sample sizes for subgroups are as follows: 18-29,n 381; 30-49, n 625; 50-64, n 606; 65 , n 1,332. “Don’tknow/Refused” responses are not shown.Religion Matters More to Older Adults% saying religion is very important in theirlife7075 65-746250-64615430-4918-2944Family RelationshipsStaying in Touch with the Kids. Nearly nine-in-ten adults (87%) ages 65 and older have children. Of thisgroup, just over half are in contact with a son or daughter every day, and an additional 40% are in contact withat least one child—either in person, by phone or by email—at least once a week. Mothers and daughters are inthe most frequent contact; fathers and daughters the least. Sons fall in the middle, and they keep in touch witholder mothers and fathers at equal rates. Overall, three-quarters of adults who have a parent or parents ages 65and older say they are very satisfied with their relationship with their parent(s), but that share falls to 62% if aparent needs help caring for his or her needs.
11Was the Great Bard Mistaken? Shakespeare wrote that the last of the “seven ages of man” is a secondchildhood. Through the centuries, other poets and philosophers have observed that parents and children oftenreverse roles as parents grow older. Not so, says the Pew Research survey. Just 12% of parents ages 65 andolder say they generally rely on their children more than their children rely on them. An additional 14% saytheir children rely more on them. The majority—58%—says neither relies on the other, and 13% say they relyon one another equally. Responses to this question from children of older parents are broadly similar.Intergenerational TransfersWho Helps Whom? (As Older Parents See It)within Families. Despite these% saying they have to their children in the past 12 monthsreported patterns of non-reliance,older parents and their adult children51Given any moneydo help each other out in a variety ofways. However, the perspectives onGiven any help with36these transfers of money and timechildcarediffer by generation. For example,Given any help with errands,32about half (51%) of parents ages 65 andhousework or home repairsolder say they have given their childrenmoney in the past year, while just 14%% saying their children have in the past 12 monthssay their children have given themGiven them help with errandsmoney. The intra-family accounting42or getting to and fromcomes out quite differently from theappointmentsperspective of adult children. AmongGiven them help with36survey respondents who have a parenthousework or home repairsor parents ages 65 or older, a quarterGiven them help with billsay they received money from a parent19paying, filling out insuranceformsorotherpaperworkin the past year, while an almost equalshare (21%) say they gave money to14Given them financial helptheir parent(s). There are similardifference in perception, byNote: Asked of 1,149 adults who are 65 and have children.generation, about who helps whomwith errands and other daily activities.(To be clear, the survey did notinterview specific pairs of parents and children; rather, it contacted random samples who fell into these andother demographic categories.) Not surprisingly, as parents advance deeper into old age, both they and the adultchildren who have such parents report that the balance of assistance tilts more toward children helping parents.
12Conversations about Endof-Life Matters. More thanthree-quarters of adults ages 65and older say they’ve talked withtheir children about their wills;nearly two-thirds say they’vetalked about what to do if theycan no longer make their ownmedical decisions, and morethan half say they’ve talked withtheir children about what to doif they can no longer liveindependently. Similar shares ofadult children of older parentsreport having had theseconversations. Parents and adultchildren agree that it is theparents who generally initiatethese conversations, though 70%of older adults report that this isthe case, compared with just52% of children of older parentswho say the same.Conversations about Future Arrangements:According to Older Parents% saying they have talked with their children regarding Whether they have a will and whatto do with family belongings76How to handle their medical care ifthey can no longer make their owndecisionsWhat to do if they can no longerlive independently6355According to Adult Children% saying they have talked with their parents regarding Whether parent(s) has a will andwhat to do with family belongings71What to do if parent(s) can nolonger live independently58How to handle medical care ifparent(s) can no longer make theirown decisions.57
13About the SurveyResults for this report are from a telephone survey conducted with a nationally representative sample of 2,969adults living in the continental United States. A combination of landline and cellular random digit dial (RDD)samples were used to cover all adults in the continental United States who have access to either a landline orcellular telephone. In addition, oversamples of adults 65 and older as well as blacks and Hispanics wereobtained. The black and Hispanic oversamples were achieved by oversampling landline exchanges with moreblack and Hispanic residents as well as callbacks to blacks and Hispanics interviewed in previous surveys. A totalof 2,417 interviews were completed with respondents contacted by landline telephone and 552 with thosecontacted on their cellular phone. The data are weighted to produce a final sample that is representative of thegeneral population of adults in the continental United States. Survey interviews were conducted under thedirection of Princeton Survey Research Associates (PSRA). Interviews were conducted Feb. 23-March 23, 2009. There were 2,969 interviews, including 1,332 with respondents 65 or older. The older respondents included799 whites, 293 blacks and 161 Hispanics. Margin of sampling error is plus or minus 2.6 percentage points for results based on the total sample and 3.7percentage points for adults who are 65 and older at the 95% confidence level For data reported by race or ethnicity, the margin of sampling error is plus or minus 3.5 percentage pointsfor the sample of older whites, plus or minus 7.4 percentage points for older blacks and plus or minus 10.3percentage points for older Hispanics. Note on terminology: Whites include only non-Hispanic whites. Blacks include only non-Hispanic blacks.Hispanics are of any race.About the Focus GroupsWith the assistance of PSRA, the Pew Research Center conducted four focus groups earlier this year inBaltimore, Md. Two groups were made up of adults ages 65 and older; two others were made up of adults withparents ages 65 and older. Our purpose was to listen to ordinary Americans talk about the challenges andpleasures of growing old, and the stories we heard during those focus groups helped us shape our surveyquestionnaire. Focus group participants were told that they might be quoted in this report, but we promised notto quote them by name. The quotations interspersed throughout these pages are drawn from these focus groupconversations.About the ReportThis report was edited and the overview written by Paul Taylor, executive vice president of the Pew ResearchCenter and director of its Social & Demographic Trends project (www.pewsocialtrends.org). Sections I, II andIII were written by Senior Researcher Kim Parker. Section IV was written by Research Associate Wendy Wangand Taylor. Section V was written by Senior Editor Richard Morin. The Demographics Section was written bySenior Writer D’Vera Cohn and the data was compiled by Wang. Led by Ms. Parker, the full Social &
14Demographic Trends staff wrote the survey questionnaire and conducted the analysis of its findings. Theregression analysis we used to examine the predictors of happiness among
Rich Morin, Senior Editor Kim Parker, Senior Researcher D'Vera Cohn, Senior Writer . Overview and Executive Summary Getting old isn't nearly as bad as people think it will be. Nor is it quite as good. . and older is the product of dramatic advances in medical science and public health as well as steep declines in fertility rates. In this .