Transcription
26/10/1433Chapter 7Intersection DesignDr. Yahya SarrajFaculty of EngineeringThe Islamic University of GazaIntersection Design An intersection is an area, shared bytwo or more roads, whose mainfunction is to provide for the changeof route directions. Intersections vary in complexity from: simple intersection: has only tworoads crossing at a right angle complex intersection: three or moreroads cross within the same area.1
26/10/1433Intersection Design Drivers therefore have to make adecision at an intersectionconcerning which of the alternativeroutes they wish to take. Intersections tend to have a highpotential for crashes.Intersection Design The overall traffic flow on anyhighway depends to a great extenton the performance of theintersections, since intersections usually operate ata lower capacity than throughsections of the road.2
26/10/1433Intersection Design Intersections are classified into threegeneral categories: grade-separatedwithout ramps, grade-separated with ramps(commonly known as interchanges), and at-grade.Basic Forms of IntersectionsBasic forms of intersectionsTYCrossStaggered and skewed3ScissorsStaggeredmultiway
26/10/1433Intersection Design Figure 7.1 shows different types ofgrade separated intersections,Intersection DesignFigure 7.1 Examples of Grade Separated Interchanges4
26/10/1433Intersection DesignFigure 7.1 Examples of Grade Separated InterchangesIntersection Design Figures 7.2 and 7.3 show differenttypes of at-grade intersections.This Chapter presentsthe basic principles of the designof at-grade intersections.5
26/10/1433Intersection DesignFigure 7.2 Examples of At-Grade IntersectionsIntersection Design(a) Raised Islands on a Three-Leg IntersectionFigure 7.3 Examples of At-Grade Intersections in Urban Areas6
26/10/1433Intersection Design(b) A Four-Leg IntersectionFigure 7.3 Examples of At-Grade Intersections in Urban AreasIntersection Design(c) A Y-IntersectionFigure 7.3 Examples of At-Grade Intersections in Urban Areas7
26/10/1433Intersection Design7.1 TYPES OF AT-GRADE INTERSECTIONS The basic types of at-gradeintersections are T or three-legintersections which consist of threeapproaches; four-leg or cross intersections, whichconsist of four approaches; and multi-leg intersections, whichconsist of five or more approaches.Intersection Design7.1.1 T Intersections Figure 7.4 on page 270 showsdifferent types of T intersections Simplest shown in Figure 7.4a channelized one with divisionalislands and turning roadways shownin Figure 7.4d.8
26/10/1433Intersection Design7.1.1 T Intersections Channelization involves the provisionof facilities such as pavementmarkings and traffic islands toregulate and direct conflicting trafficstreams into specific travel paths.Intersection Design7.1.1 T Intersections The intersection shown in Figure 7.4a issuitable for minor or local roads and maybe used when minor roads intersectimportant highways with an intersectionangle less than 30 degrees from thenormal. also suitable for use in rural two-lanehighways that carry light traffic.9
26/10/1433Intersection DesignFigure 7.4 Examples of T IntersectionsIntersection Design7.1.1 T Intersections At locations with higher speeds andturning volumes, which increase thepotential of rear-end collisionsbetween through vehicles and turningvehicles. usually an additional area ofsurfacing or flaring is provided, asshown in Figure 7.4b.10
26/10/1433Intersection Design7.1.1 T Intersections the flare is provided to separate rightturning vehicles from throughvehicles approaching from the east.Intersection Design7.1.1 T Intersections In cases where left-turn volume froma through road onto a minor road issufficiently high but does not requirea separate left-turn lane, an auxiliarylane may be provided, as shown inFigure 7.4c.11
26/10/1433Intersection DesignFigure 7.4 Examples of T IntersectionsIntersection Design7.1.1 T Intersections Figure 7.4d shows a channelized Tintersection in which the two-lanethrough road has been converted intoa divided highway through theintersection. intersection of this type probably willbe signalized.12
26/10/1433Intersection Design7.1.2 Four-Leg Intersections Figure 7.5 shows varying levels ofchannelization at a four-legintersection. unchannelized intersection shown inFigure 7.5a on page 272 is usedmainly at locations where minor orlocal roads cross.Intersection DesignFigure 7.5 Examples of Four-Leg Intersections13
26/10/1433Intersection Design7.1.2 Four-Leg Intersections it also can be used where a minorroad crosses a major highway. In these cases, the turning volumesare usually low and the roadsintersect at an angle that is notgreater than 30 degrees from thenormal.Intersection Design7.1.2 Four-Leg Intersections When right-turning movements arefrequent, right-turning roadways,such as those in Figure 7.5b, can beprovided. also common where pedestrians arepresent.14
26/10/1433Intersection DesignFigure 7.5 Examples of Four-Leg IntersectionsIntersection Design7.1.2 Four-Leg Intersections The layout shown in Figure 7.5c issuitable for: a two lane highway that is not a minor crossroad and that carries moderate volumes at high speeds or operates near capacity.15
26/10/1433Intersection DesignFigure 7.5 Examples of Four-Leg IntersectionsIntersection Design7.1.2 Four-Leg Intersections Figure 7.5d shows a suitable designfor four-lane approaches: carrying high through volumes and high turning volumes. This type of intersection is usuallysignalized.16
26/10/1433Intersection DesignFigure 7.5 Examples of Four-Leg IntersectionsIntersection Design7.1.3 Multi-leg Intersections Multi-leg intersections have five ormore approaches. Figure 7.6 Whenever possible, this type ofintersection should be avoided.17
26/10/1433Intersection DesignFigure 7.6 Examples of Multileg IntersectionsIntersection Design7.1.3 Multileg Intersections In order to: removesome of the conflictingmovements and increase safety and operation, one or more of the legs are realigned. Figure 7.6a, the diagonal leg of theintersection is realigned18
26/10/1433Intersection Design7.1.3 Multileg Intersections This results in the formation of anadditional T intersection but with the multileg intersection nowconverted to a four-leg intersection. two important factors to consider: thediagonal road should be realigned tothe minor road the distance between the intersectionsIntersection Design7.1.3 Multileg Intersections realignment of a six-leg intersection Figure 7.6b, forming two four-legintersections. realignment to be made to the minor road. forming two additional T intersections andresulting in a total of three intersections.19
26/10/1433Intersection DesignFigure 7.6 Examples of Multileg IntersectionsIntersection Design7.1.3 Multileg Intersections the distances between theseintersections should be great enoughto allow for the independentoperation of each intersection.20
26/10/1433Intersection Design7.1.4 Traffic Circles A traffic circle is a circularintersection that provides a circulartraffic pattern with significantreduction in the crossing conflictpoints.Intersection Design7.1.4 Traffic Circles The Federal Highway Administration publication,Roundabouts:An Informational Guide, describes three types of traffic circles:1.2.3.21rotaries,neighborhood traffic circles, androundabouts.
26/10/1433Intersection Design7.1.4 Traffic Circles1. Rotaries have large diameters thatare usually greater than 100m (300ft), thereby allowing speedsexceeding 45km/h (30 mi/h), with aminimum horizontal deflection ofthe path of the through traffic.Intersection Design7.1.4 Traffic Circles2. Neighborhood traffic circles havediameters that are much smaller thanrotaries and therefore allow much lowerspeeds. Consequently,they are used mainly at theintersections of local streets, traffic calming aesthetic device. they consist of pavement markings and donot usually employ raised Islands.22
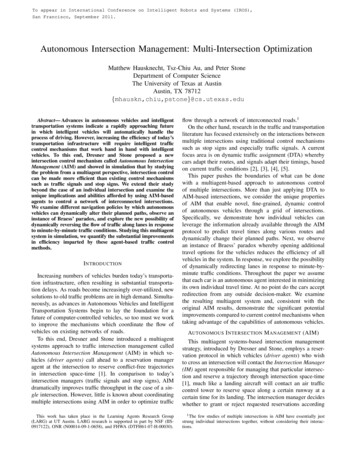
26/10/1433Intersection Design7.1.4 Traffic Circles3. Roundabouts have specific definingcharacteristics that separate them from othercircular intersections. These include: Yieldcontrol at each approach Separation of conflicting traffic movementsby pavement markings or raised islands Geometric characteristics of the centralisland that typically allow travel speeds ofless than 30 mi/h Parking not usually allowed within thecirculating roadway.Intersection Design7.1.4 Traffic Circles Figure 7.7a shows the geometricelements of a single-lane modernroundabout, Figure 7.7b shows a photograph of anexisting roundabout.23
26/10/1433Intersection DesignFigure 7.7 GeometricElements and Exampleof RoundaboutIntersection DesignFigure 7.7 GeometricElements and Exampleof Roundabout24
26/10/1433Intersection Design7.1.4 Traffic CirclesRoundabouts can be further categorized into sixclasses based on the size and environment inwhich they are located.1.2.3.4.5.6.Mini roundaboutsUrban compact roundaboutsUrban single-lane roundaboutsUrban double-lane roundaboutsRural single-lane roundaboutsRural double-lane roundaboutsIntersection DesignTable 7.1 Characteristics of Roundabout Categories25
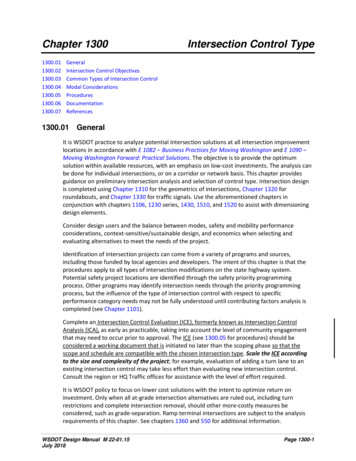
26/10/1433Intersection Control8.2 CONFLICT POINTS AT INTERSECTIONS Conflicts occur when traffic streamsmoving in different directions interfere witheach other. Three types of conflicts: merging, diverging, crossing.Intersection Control8.2 CONFLICT POINTS AT INTERSECTIONS Figure 8.3 four-approach unsignalizedintersection. There are 32 conflict pointsin this case. The number of possible conflict points atany intersection depends on: the number of approaches, the turning movements, and the type of traffic control at theintersection.26
26/10/1433Intersection DesignFigure 8.3 Conflict Points at a Four-Approach Unsignalized IntersectionConflict points at a T-Intersection9 conflict points:3 crossing3 merging3 diverging27
26/10/1433Intersection Control8.2 CONFLICT POINTS AT INTERSECTIONS Crossing conflicts, however, tend tohave the most severe effect on trafficflow and should be reduced to aminimum whenever possible.Intersection DesignFigure 8.4 Stop Sign and Yield Sign28
26/10/14336.4 Priority Intersections6.4.1Capacity of Two-Way Intersections - HCM MethodCapacity analysis at two-way stop-controlled (TWSC) intersectionsdepends on a clear description and understanding of the interaction ofdrivers on the minor or stop-controlled approach with drivers on the majorstreet.Both gap acceptance and empirical models have been developed todescribe this interaction.Procedures described in this section rely on a gap acceptance modeldeveloped and refined in Germany.This model starts with calculation of the conflicting traffic for minor-streetmovements; as follows:6.4 Priority Intersections6.4.1Capacity of Two-Way Intersections - HCM MethodCONFLICTING TRAFFICEach movement at a TWSC intersection faces a different set of conflicts thatare directly related to the nature of the movement. These conflicts areshown in the following Table, which illustrates the computation of theparameter vc,x, the conflicting flow rate for movement x, that is,vc,x the total flow rate that conflicts with movement x (veh/h).One stage and two stage:The Table also identifies the conflicting flow rates for each stage of a twostage gap acceptance process that takes place at some intersections wherevehicles store in the median area.If a two-stage gap acceptance process is not present, the conflicting flowrates shown in the rows labeled Stage I and Stage II should be addedtogether and considered as one conflicting flow rate for the movement inquestion.29
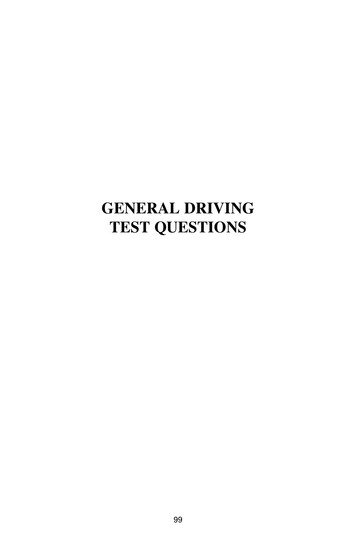
26/10/14331011121665113144MAJOR ROAD7839152MINOR ROADHCM Numbering system for traffic & pedestrian movements at road intersections6.4 Priority IntersectionsPOTENTIAL CAPACITYThe gap acceptance model used in this method computes the potential capacityof each minor traffic stream in accordance with this equation: vc p , x v c .xt/ 3600e c ,x c ,x v t/ 36001 e c ,x f ,xWhere30cp,x potential capacity of minor movement x (veh/h),vc,x conflicting flow rate for movement x (veh/h),tc,x critical gap (i.e., the minimum time that allows intersection entry forone minor-stream vehicle) for minor movement x (s), andtf,x follow-up time (i.e., the time between the departure of one vehicle fromthe minor street and the departure of the next under a continuous queuecondition) for minor movement x (s).
26/10/1433The following notes apply to theprevious Table:A.If right-turning traffic from the majorstreet is separated by a triangularisland and has to comply with a yield orstop sign, v6 and v3 need not beconsidered.B.If there is more than one lane on themajor street, the flow rates in the rightlane are assumed to be v2/N or v5/N,where N is the number of throughlanes. The user can specify a differentlane distribution if field data areavailable.31
26/10/1433The following notes apply to theprevious Table:C. If there is a right-turn lane on themajor street, v3 or v6 should not beconsidered.D. Omit the farthest right-turn v3 forSubject Movement 10 or v6 for SubjectMovement 7 if the major street ismultilane.E.If right-turning traffic from the minorstreet is separated by a triangularisland and has to comply with a yield orstop sign, v9 and v12 need not beconsidered.F.Omit v9 and v12 for multilane sites, oruse one-half their values if the minorapproach is flared.32
26/10/14336.4 Priority IntersectionsCRITICAL GAP (tc)The critical gap, tc, is defined as the minimum time interval in the major-streettraffic stream that allows intersection entry for one minor-street vehicle (5).A particular driver would reject any gaps less than the critical gapFOLLOW-UP TIME (tf)The time between the departure of one vehicle from the minor street and thedeparture of the next vehicle using the same major-street gap, under a conditionof continuous queuing on the minor street, is called the follow-up time, tf.tf is the headway that defines the saturation flow rate for the approach if therewere no conflicting vehicles on movements of higher rank.6.4 Priority IntersectionsCRITICAL GAPBase values of tc and tf for passenger cars are given in next Table.The values are based on studies throughout the United States.Base values of tc and tf for a six-lane major street are assumed to be thesame as those for a four-lane major street.Adjustments are made to account for the presence of heavy vehicles,approach grade, T-intersections, and two-stage gap acceptance.The critical gap is computed separately for each minor movement by thisequation.tc,x tc,base tc,HV PHV tc,G G – tc,T – t3,LT33
26/10/14336.4 Priority IntersectionsCRITICAL GAPtc,x tc,base tc,HV PHV tc,G G – tc,T – t3,LTwheretc,x critical gap for movement x (s),tc,base base critical gap from Exhibit 17-5 (s),tc,HV adjustment factor for heavy vehicles (1.0 for two-lane majorstreets and 2.0 for four-lane major streets) (s),PHV proportion of heavy vehicles for minor movement,tc,G adjustment factor for grade (0.1 for Movements 9 and 12 and 0.2for Movements 7, 8, 10, and 11) (s),G percent grade divided by 100,6.4 Priority IntersectionsCRITICAL GAPtc,x tc,base tc,HV PHV tc,G G – tc,T – t3,LTtc,T adjustment factor for each part of a two-stage gap acceptanceprocess, (1.0 for first or second stage; 0.0 if only one stage) (s), andt3,LT adjustment factor for intersection geometry (0.7 for minor-streetleft-turn movement at three-leg intersection; 0.0 otherwise) (s).34
26/10/14336.4 Priority IntersectionsFOLLOW-UP TIMEThe follow-up time is computed for each minor movement using next equation.Adjustments are made for the presence of heavy vehicles.tf,x tf,base tf,HV PHVwheretf,x follow-up time for minor movement x (s),tf,base base follow-up time from Exhibit 17-5 (s),tf,HVadjustment factor for heavy vehicles (0.9 for two-lane major streets and1.0 for four-lane major streets), andPHVproportion of heavy vehicles for minor movement.Values from the previous table are considered typical. If smaller values for tc andtf are observed, capacity will be increased. If larger values for tc and tf are used,capacity will be decreased.6.4 Priority IntersectionsProblem A cross- road intersection iscontrolled by priority rule. Thepercent of truck 10%, the gradeis 4%. The demand flow in thedesign year is shown in (Fig 1). Find the capacity of movements1, 7, 8, 9.and then find RFC (Ratio of flow tocapacity) & Comment.(Assume one stage)35Fig (1)
26/10/1433 Solution:1)VC ,1 V5 V5 a V16tC ,1 ( 700 700 ) 0 neg 0 1400 tC .base t C . HV PHV tC .G G t C ,T T3 , LTt f ,.1 4 4 .1 2 .0 0 .1 0 . 0 0.0 0.0 4.3 100 t f .base t f . HV PHV 2 . 2 1 . 0 0 .1 2 . 3 VC ,1 t c ,13600eC P ,1 VC ,1 VC ,1 t f ,11 eRFC 444 .8360080 0.18 0.85 Good Design445 Solution:7)VC , 7 I 2V1 V2 0 .5V3 c V15 2 80 (500 500 ) 0 neg 0 1160V5 0 .5V6 d 0 .5V12 e , f 0 .5V11 V13N 2 120 700 0 neg 0 neg 0 940VC , 7 II 2V4 Assuming one stageVC , 7 1160 940 2100t C , 7 t C .base tC . HV PHV tC .G G tC ,T T3, LTt f ,.7 4 7 .5 2 .0 0 .1 0 .2 0 .0 0 .0 7 .708 100 t f .base t f . HV PHV 3. 5 1 . 0 0 . 1 3 . 6 V C , 7 tC , 7C P , 7 VC , 7 e1 eRFC 363600 VC , 7 t f,7 26 .68360020 0 .74 0 .85 Good Design27
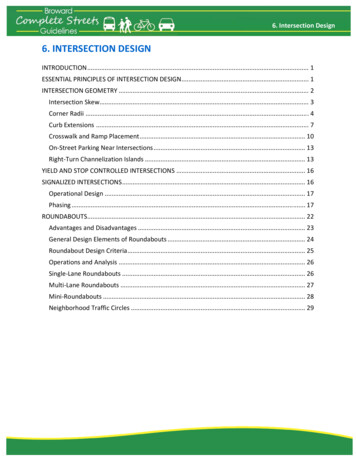
26/10/14336.4 Priority Intersections6.4.3Capacity of T-Intersections Using British MethodThe capacity of a priority T-intersection is primarilydependent upon: The ratio of the flows on the major and minor roads; The critical (minimum) gap in the main road trafficstream acceptable to entering traffic; and The maximum delay acceptable to minor road vehicles.Empirical research has resulted in predictive capacity equations forT-intersections which where derived from traffic flow measurementsand from certain broad features of junction layout.This empirical approach has been adopted by the Department ofTransport in Britain.6.4 Priority Intersections6.4.3Capacity of T-Intersections Using British MethodA T-intersection has six separate traffic stream (shown in the next figure), ofwhich: The through streams on the major road (C-A and B-C) and the right-turnstream off the major road (A-B) are generally assumed to be priority streamsand to suffer no delays from other traffic; While the two minor road streams (B-A and B-C) and the major road leftturn stream (C-B) incur delays due to their need to give way to higher prioritystreams.Arm A(Major)qC-AqC-BqA-CqA-BqB-AqB-CArm B(Minor)37Arm C(Major)
26/10/14336.4 Priority Intersections6.4.3Capacity of T-Intersections Using British MethodThe predictive capacity equations for the three non-priority streams are asfollows:qs B-A D{627 14 W CR – Y[0.364 qA-C 0.114 qA-B 0.229 qC-A 0.520 qC-B]}qs B-C E{745 – Y[0.364 qA-C 0.114 qA-B]}qs C-B F{745 – 0.364 Y[qA-C qA-B]}whereY [1- 0.0345W]D [1 0.094(WB-A – 3.65)] [1 0.0009(Vl B-A – 120)] [1 .0006(Vr B-A -150)]E [1 0.094(WB-C – 3.65)] [1 0.0009(Vl B-C – 120)]F [1 0.094(WC-B – 3.65)] [1 0.0009(Vl C-B – 120)]WCR is the average width of the central reserve lane, at theintersection, on a dual carriageway road.Y [1- 0.0345W]D [1 0.094(WB-A – 3.65)] [1 0.0009(Vl B-A – 120)] [1 .0006(Vr B-A -150)]E [1 0.094(WB-C – 3.65)] [1 0.0009(Vl B-C – 120)]F [1 0.094(WC-B – 3.65)] [1 0.0009(Vl C-B – 120)]WB-A and WB-C the average widths of each of the minor road approach lanesfor waiting vehicles in streams B-A and B-C, respectively, measured over adistance of 20 m upstream from the give Way line (2.05 – 4.70 m).WC-B the average width of the left-turn (central) lane on the major road, or2.1 m if there is no explicit provision for left turners in stream C-B (2.05 – 4.70 m).Vl B-A , Vr B-A and Vl B-C the left and right visibility distances, available fromthe minor road (22 - 250 m).Vl C-B the visibility available to left-turning vehicles waiting to turn left from themajor road (22 - 250 m).W the average major road carriageway width at the intersection; in thecase of dual carriageways and single carriageways with ghost or raised islands,W excludes the width of the central (turning) lane.38
26/10/14336.4 Priority Intersections6.4.3Capacity of T-Intersections Using British MethodConsider the following remarks when applying the mentioned method: All capacities and flows are in passenger car units per hour (pcu/h),and distances are in meters ; Capacities are always positive or zero, if the right-hand side of anyequation is negative, the capacity is taken as zero; The ranges within which the geometric data are considered valid are: W 2.05 – 4.70 m, Vr 22-250 m, Vl 17-250 m, W CR 1.2-9 m (dual carriageway sites only), W 6.4 - 20 m0mab5mc10 md15 m20 m39e
26/10/1433left40
26/10/1433a0mb5mc10 md15 m20 mea0mb5mc10 md15 me20 m41
26/10/1433left42W3W1W4W2
26/10/1433W3W1W4W2W3W1W6W5W4W210m10m43
26/10/1433leftleft44
26/10/1433ExampleAnswer45
Figure 7.5 shows varying levels of channelization at a four-leg intersection. unchannelized intersection shown in Figure 7.5a on page 272 is used mainly at locations where minor or local roads cross. Intersection Design Intersection Design Figure 7.5 Examples of Four-Leg Intersections