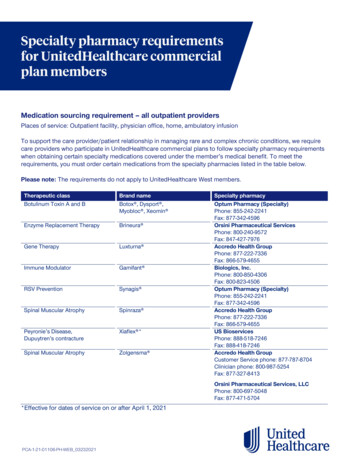
Transcription
Medical Specialty Distribution Programme(London region)Cardiology updateDr Liz Carty, Deputy Postgraduate Dean, HEE London9 February 2022@NHS HealthEdEng
National background and contextThe Medical Specialty Distribution (MSD) Programme was set up to examine the geographical and speciality alignment ofmedical training programmes across England. It found: population health needs are not being met as well as they could rural, remote and coastal areas particularly affected, where there is a challenge in terms of recruitment and retention ofstaff accepted recognition that postgraduate medical training posts have been disproportionately distributed across England,based on historical arrangements, and are not aligned to changing patient needs evidence that postgraduate medical trainees show a greater propensity to remain in the geographical area that theycomplete their specialist training. Consequently, the consultant workforce is much more commonly recruited fromtrainees who train locally.@NHS HealthEdEng
Programme objectivesHEE and NHSE/I are jointly leading the MSD Programme across England. The programme will: address historical health inequalities by delivering improved services by better aligning the availabilityof specialist care to the required need/demand, resulting in improved patient outcomes across thecountry begin implementing country-wide changes from August 2022 – these changes will be carefully planned reduce variation of patient outcomes ensure patient safety informs all future decision-making ensure there is a more equitable distribution of future training places across England.@NHS HealthEdEng
Programme scope1. Funding implications HEE-funded posts only (not trust or academic). Programme focuses on movement of funding – no current trainees in post will be moved.2. Initial specialties Starting with three forerunners in August 2022 – Obstetrics and Gynaecology /Cardiology / Haematology.3. Robust methodology / modelling@NHS HealthEdEng
Programme scope4. Implementation timescale / pace of change In London, proposed movement of / reduction in the numbers of specialty training posts is dueto commence August 2022 onwards, subject to programme risk assessments. Timeframe for specialty implementation varies – between five to seven years. HEE London and NHSE/I will be influencing programme’s pace of change. Implementation timescales will remain under scrutiny as programme progresses.@NHS HealthEdEng
Programme implementationstructure@NHS HealthEdEng
Guided Distribution(London vs other regions)The new guided distribution model (December 2021) shows the following: London is expected to reduce its HEE-funded training posts by 33%, areduction of 32 posts, and is one of four regions across England to seea reduction in posts. Activity funded by Specialised Commissioning has been factored in andthese posts should be unaffected by the redistribution programme. The West Midlands along with South West sees the largest increase,with 16 and 12 posts to be added to current stock respectively.Source: Tableau / Guided Distributions / Redistribution by Trusts – New Baselines / Regional Redistribution (Dec-21)@NHS HealthEdEng
Impact for LondonEarly modelling suggests in excess of 1,600 secondary care posts willneed to be removed from London programmes.Specific points include: London has the highest number of posts nationally in the majority of specialties, both Trust and HEEfunded. New investments will be used to offset redistribution. Mitigations have been made within the programme to date to ensure: Specialised Commissioning is factored into national modelling Covid-19 10.2 outcomes are considered and reviewed on an annual basis.Each of the affected specialties will convene a task and finish group, which will contain clinicalrepresentation from each Integrated Care System area, noting there may need to be a degree of flex to beappropriate for each specialty.@NHS HealthEdEng
Opportunities Additional 1,500 annual undergraduate medical school places now availablein England. Multi-disciplinary workforce development. Enhanced clinical learning environment / education and training package totrainees. Continuity of high-quality services / ongoing commitment to patient safety ofparamount importance.@NHS HealthEdEng
Risks Need for effective communications and stakeholder engagement. Reputational and relational risk. Practical implementation / capacity-related issues in London. Parallel policy initiatives being implemented nationally – need to consider impacton London. Impact of COVID on services / education.@NHS HealthEdEng
Risks Rushed approach to programme management runs risk of exacerbating healthinequalities. Potential deterioration in quality of training due to reduction in numbers. Removal of posts could potentially impact negatively on London’s Covid recoveryprogramme. Reprofiling of London programmes as rotations reduce in size (impact on traineeplacement opportunities).@NHS HealthEdEng
Data and AnalysisSources used to support the MSD programme are as follows:HEE: London workforce (Tableau) Trainee workforce (Trainee Information System) London training posts – training posts and funding information (HEE - HET post data tracker) Age risk factors – patients using services based on 19 different age groups (Tableau) Population data (Tableau)NHSE/I: Hospital Episode Statistics (HES) – inpatient activity and outpatient attendances (NHS Digital) Bed occupancy (NHS Digital) Deprivation (Standardised Mortality Rate 75 (SMR 75) Ethnicity (Specialised Commissioning only)From this data, a ‘Guided Distribution’ model has been created to show the impact for each region.@NHS HealthEdEng
ExclusionsExclusions from the data presented, unless otherwise specified, are: Out Of Practice (OOPs) trainees Long term sick Sub Specialty trainees and posts (if applicable) National Institute for Health Research (NIHR) posts@NHS HealthEdEng
Workforce DataExcluding Trainee dataData has been taken from the Workforce Profile withinTableau. This data is to September 2021.The tables shows the Cardiology workforce, split byHeadcount (HC) and Full Time Equivalent (FTE). Bothtables are split further by the different role types.Trainee data from Tableau (Workforce Profile) has notbeen included here - whilst it includes trainees undertakinga specialty training programme, the ‘trainee’ data onTableau may also include 1 or more of the following: Doctors recruited locally on a trainee grade but are nottrainees or on a training programme. Foundation or GP trainees rotating through a post. Trainees from other regions who may undertake aplacement in London. According to the latest data from Workforce Profile(September 2021) there are 287 FTEs that fall into oneof the above categories.@NHS HealthEdEngSource: Tableau / Workforce Profile
Workforce DataTrust Breakdown (Excluding Trainee data)Source: Tableau / Workforce Profile@NHS HealthEdEng
Trainee DataTrainee data has been taken from TISand shows FTE.It has been split by region, and thensub divided by ICS, where known. Thetrainee data itself has been brokendown by specialty training level.Across London 22.8 trainees with aplacement grade between ST4 – ST7are recorded as Academic Trainees(NIHR - ACL or ACF). These trainees areincluded in the table across within ST4– ST7. Only 1 trainee has a placementgrade marked as ACF.There are 109.6 London traineesclassified as “Not In Post”.Not In Post: OOPC / OOPE / OOPR / Long TermSick / Parental Leave@NHS HealthEdEngSource: TIS / Cardiology trainee report (Dec 2021)
London Posts and Funding DataThis table provides abreakdown of eachCardiology trainingpost across London(excluding any out ofscope posts).It is split by: ICS Funding body Hospital Site Funding type* Royal Brompton andHarefield Hospitals arepart of GSTT, but fallwithin the NW LondonICS footprintSource: HET Post Tracker –Period 3, 2021/22@NHS HealthEdEng
Population Data and Patient RatiosThis illustrates the population across Londonby age group. The data has been split byeach of the London ICS’s.London has a population of 9,095,456.North (Central) London has the highestpopulation with South West London thelowest.Those in the 20-39 and 40-64 age categoriesmake up the largest proportion of thepopulation within London.Source:Tableau / Population dashboardTableau / Workforce Profile@NHS HealthEdEng
Population vs Role Type (Consultant)This table takes the Londonpopulation and provides thetheoretical Patient toCardiology Consultant ratios(FTE) across each Londonregion and is broken downfurther by age group.Source:Tableau / Population dashboardTableau / Workforce Profile@NHS HealthEdEng
Population vs Role Type (Trainee)This table takes the Londonpopulation and provides thetheoretical Patient toCardiology Trainee ratios(FTE) across each Londonregion and is broken downfurther by age group.Note: Due to some Traineesshowing on TIS asundertaking training outsideof London, this ratio onlycounts the trainees inLondon (120.2 as opposedto 130.2)Source:TIS (Trainee Information System)Tableau / Population dashboardTableau / Workforce Profile@NHS HealthEdEng
Population DataBy EthnicityLondon’s population is themost ethnically diverse in the UK.Across London the breakdown is asfollows: 59.8% - White18.5% - Asians / Asian British13.3% - Black / African / Caribbean5.0% - Mixed / Multiple Ethnic Background3.4% - Other Ethnic GroupsSource: Shapeatlas / ethnicity breakdown@NHS HealthEdEng
Population DataBy EthnicityEast London and North West Londonhave the highest % of Asians / BritishAsians.East LondonNewhamRedbridgeTower HamletsWaltham ForestNorth West LondonHounslowBrentEalingHillingdonWhilst there are pockets of East London, North London and NorthWest London, that have high concentrations of those from a Black /African / Caribbean background, South East London has the highest.South LondonLewishamSouthwarkLambethCroydonEast LondonBarking and DagenhamNewhamAsian / Asian BritishNorth LondonHackneyNorth West LondonBrent@NHS HealthEdEngBlack / African / CaribbeanSource: Shapeatlas / ethnicity breakdown
Index of Multiple Deprivation (IMD)The seven domains were combined using the followingweights to produce the overall Index of Multiple Deprivation(IMD) from the Indices of Deprivation 2019:Health Deprivation (13.5%)Income Deprivation (22.5%)Employment Deprivation (22.5%)Education Deprivation (13.5%)Crime Deprivation (9.3%)Barriers to Housing and Services (9.3%)Living Environment Deprivation (9.3%)Across the London ICSs the Index of Multiple Deprivationaverage score is 21.8.The England-wide Index of Multiple Deprivation distribution is0.54 to 92.73 with a mean value of 21.67.The larger the value and thedeeper the purple, the greaterthe deprivation.Source: shapeatlas@NHS HealthEdEng
Index of Multiple Deprivation (IMD)This chart shows the distribution of small areas (LSOAs) within the nationalquintiles for each London Borough, based on the latest calculation (IMD 2019).Barking and Dagenham had the highest proportion of LSOAs in the mostdeprived quintile in England with more than half of its LSOAs in this group,followed by Hackney and Haringey.Five boroughs had no LSOAs in the least deprived quintile in 2019 – Barking andDagenham, Brent, Hackney, Islington, Lewisham, andNewham.In contrast, almost two thirds of LSOAs inRichmond-upon-Thames ranked in theleast deprived quintile.Definition: LSOA – Lower Layer Super Output AreaSource: London Datastore - Indices of Deprivation 2019@NHS HealthEdEng
Health Deprivation and DisabilityThe indicator focuses the Health Deprivation andDisability domain from the Indices of Deprivation2019.Across the London ICSs the Health Deprivation andDisability average score is -0.37.The England-wide Health Deprivation and Disabilitydistribution is -3.21 to 3.55 with a mean value of 0.The larger the value and the deeper the purple, thegreater the deprivation.Source: shapeatlas@NHS HealthEdEng
Health Deprivation and DisabilityHighest levels of health deprivation and disability canbe seen across many parts of North London, including:Barking and Dagenham, Havering, Enfield, Haringey,Ealing, Harrow, Brent, Barnet.Areas of high deprivation in South London include:Bexley, Croydon.Source: shapeatlas@NHS HealthEdEng
Guided Distribution(Cardiology - London)The Guided Distributions dashboard takes data from NHSE/I, HEE, and the DHSC,and factors in the following: Current training postsInpatient activitiesOutpatient attendances Consultant WTEsDeprivationAge risk factorsThe model applies to HEE funded posts only and also factors in SpecialisedCommissioning. It then provides a “guided change” recommendation for HEEfunded training posts based on these findings.Source: Tableau / Guided Distributions / Redistribution by Trusts – New Baselines / Local Distribution (Dec-21)@NHS HealthEdEngIt is noted that there are 3supernumerary posts.Excluding these posts wouldbring the total “Current Posts”to 97 and the “Guided Posts” to65. However, this does notimpact the “Guided Change”which remains at -32 forLondon.
Medical ExpansionAlongside Medical Distribution is a separate programme looking at Medical Expansion.For Cardiology, it is anticipated that medical expansion will see 1 time limited post added to London inthe first year, with the same number potentially added in 2023/24 and 2024/25 (to be confirmed).@NHS HealthEdEng
2022 London region key dates /timescales January 2022 – HEE London has reported what post movement isplanned in year one and beyond. Summer/autumn 2022 – pace of change will be modified based onthese returns. August 2022 – movement of posts starts.@NHS HealthEdEng
London Project TeamClinical Lead: O&G – Liz CartyWorkforce Transformation – Silvio GiannottoSenior Clinical Leadership – DeansWorkforce Planning and Intelligence –Matthew Rassell, Khalid Adam SaibSenior Managerial Leadership –Angela FletcherCommunications and Engagement –Verity Thomas, Rachel MorrisonAssociate Dean for Distribution –Ruth BrownProject Management Support –Healthcare Education Team (TBC)@NHS HealthEdEng
Further informationLondon Medical Specialty Distribution Programme: Londonmedicaldistribution@hee.nhs.uk bution-programmeNational Medical Specialty Distribution Programme: medicaldistribution@hee.nhs.uk istribution-specialty-training-posts@NHS HealthEdEng
END@NHS HealthEdEng
Tableau / Population dashboard Tableau / Workforce Profile This table takes the London population and provides the theoretical Patient to Cardiology Trainee ratios (FTE) across each London region and is broken down further by age group. Note: Due to some Trainees showing on TIS as undertaking training outside of London, this ratio only