Transcription
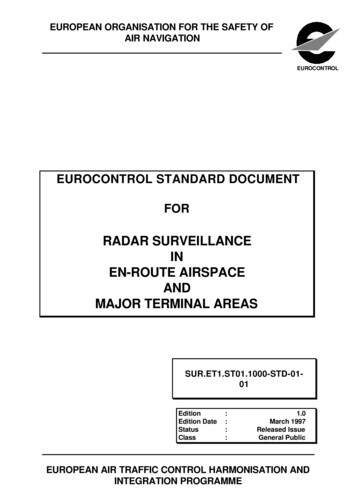
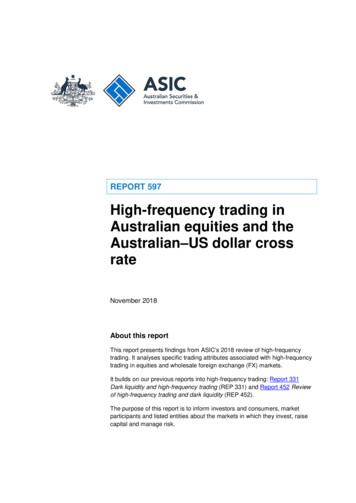
Four-Frequency Radar Measurements of Clouds and Precipitation From NASA ER-2Gerald Heymsfield, Code 612, NASA/GSFCB Three radars installed on the NASA ER-2 high-altitude aircraft (HIWRAP, CRS, EXRAD)provides the first 4-frequency reflectivity and Doppler measurements from precipitation andclouds. Two severe storms on 5/23/2014 observed during the GPM Ground Validation (GV) IntegratedPrecipitation and Hydrology Experiment (IPHEx). The 4 frequencies permit measurements with a broader detection of clouds and precipitation forthe multi-frequency microphysical retrievals that are used in GPM and are planned for futuremissions such as ACE Decadal Mission.Earth Sciences Division - Atmospheres
Gerald Heymsfield, NASA/GSFC, Code 612E-mail: point.of.contact@nasa.govPhone: 301-614-6369References:Li, Lihua, G. Heymsfield, J. Carswell, D. Schaubert, M. McLinden, J. Creticos, M. Perrine, M. Coon, J. Cervantes, M. Vega, L Tian, S. Guimond, A. Emory,2014: The NASA High-altitude Imaging Wind and Rain Airborne Profiler (HIWRAP). In press, IEEE Transactions on Geoscience and Remote Sensing.Heymsfield, G. M., L. Tian, L. Li, M. McLinden, and J. I. Cervantes, 2013: Airborne Radar Observations of Severe Hailstorms: Implications for FutureSpaceborne Radar. Journal Applied Meteorology and Climatology, 52, 1851–1867. doi: dgements: The HIWRAP, CRS, and EXRAD radars have been developed at Goddard Space Flight Center jointly between the MesoscaleAtmospheric Processes Laboratory (612) and the Microwave Instrument Technology Branch (555). Key engineers involved in the development of theseradars are Lihua Li, Matthew McLinden, Michael Coon, and Martin Perrine. This work was funded by the Global Precipitation Mission (GPM) groundvalidation, Aerosol Clouds and Ecosystem (ACE) Decadal Survey algorithm formulation, and NASA PMM. ACE funded the Radar Experiment (RADEX)portion of IPHEx that contributed CRS participation to the campaignHIWRAP was developed under the 2004 NASA ESTO IIP. EXRAD was funded undera 2013 NASA AITT for installation on the ER-2. CRS used an ACE sub-scale antenna that was developed under a 2012 NASA IIP.Data Sources: IPHEx http://har.gsfc.nasa.gov/index.php?section 55Technical Description:Three Goddard radars:- High-altitude Imaging Wind and Rain Airborne Profiler (HIWRAP), Cloud Radar System (CRS), and ER-2 X-band Radar (EXRAD).- HIWRAP has flown on both the Global Hawk during the Hurricane Severe Storm Sentinel (HS3) and in was installed in a non-scanning mode on theNASA ER-2. HIWRAP is Ku-band (13.5 GHz) and Ka-band (35.5 GHz).- CRS is a completely new radar with a solid state transmitter; the original CRS was tube-based built in 1992. It is the first cloud radar utilizing a lowpower solid state power amplifier (SSPA) with pulse compression. The ACE radar concept calls for a Ka- and W-band Doppler radar and this issimulated with the HIWRAP Ka-band radar and CRS.- EXRAD was originally developed for the Global Hawk about 2004 and was then installed on the ER-2. At 9.6 GHz, this radar has significantly betterpenetration into severe weather compared to Ku and shorter wavelengths. EXRAD has a fixed nadir beam and a cross-track or conical scanning beam.The latter is used for horizontal wind measurements.Figure Caption: Radar reflectivity and Doppler velocity corrected for aircraft motions are shown for the four frequencies for two hail storms on 23 May2014 in northern SC during the Integrated Precipitation and Hydrology Experiment (IPHEx) sponsored by GPM. These storms produced large hail ( 2-1inches) and had updrafts exceeding 25 ms (seen by the deep blue colors in the Doppler plot). Strong attenuation and Mie scattering occur in theconvective cores at the shorter wavelengths. Cross sections such as these are being analyzed along with ER-2 radiometric measurements will provideboth a better understanding convective storms and improvement in physics assumptions in satellite retrieval algorithms.Scientific significance, societal relevance, and relationships to future missions: The three radars providing X- through W-band provide a both asimulator for future missions, and additional and higher resolution measurements for current missions such as GPM and CloudSat. This combination ofinstruments provides the first dual-frequency Ka & W-band measurements for development of retrieval algorithms for ACE. It provides GPM-likemeasurements at Ku and Ka-band that along with W-band, can be used to improve the physics in the GPM algorithms and to study significant data issuesin current and future missions such as non-uniform beam filling.Earth Sciences Division - Atmospheres
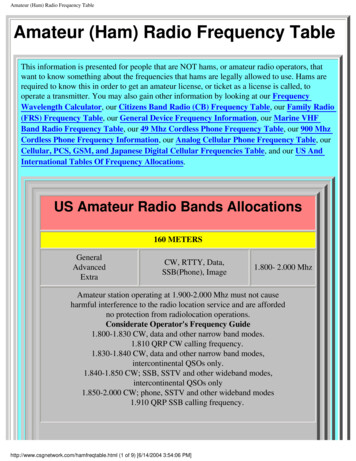
TRMM Extreme Precipitation Monitoring SystemYaping Zhou, William K. Lau, George HuffmanCode 613, NASA/GSFC and Morgan State UniversityThe TRMM Extreme Precipitation Monitoring System (ExPreS) shows precipitationaccumulation and corresponding Average Recurrence Interval (ARI) or Return-Yearfor the past 1 10 days computed from near-real-time TRMM Multi-satellitePrecipitation Analysis (TMPA). The areas with severe extreme precipitation areindicated with colored dots. The system is intended to raise awareness of potentialhazards and support disaster management.Earth Sciences Division - Atmospheres
Name: Yaping Zhou, NASA/GSFC, Code 613 and GESTAR/Morgan State UniversityE-mail: Yaping.Zhou-1@nasa.govPhone: 301-614-6235Reference:Zhou, Y., K. -M. Lau, and G. Huffman (2015), Mapping TRMM TMPA into average recurrence interval for monitoring extreme precipitationevents, Journal of Applied Meteorology and Climatology, 54 (5): 979-995, .gov/publications dir/ari slide show.htmlData Sources: TRMM 3B42RT is the main input data for the monitoring system. Gauge-based daily unified precipitation data used forvalidation come from NOAA’s Climate Prediction Center (CPC) and from the Asian Precipitation - Highly-Resolved Observational DataIntegration Towards Evaluation of Water Resources (APHRODITE) project.Technical Description of Figures:The TRMM extreme precipitation monitoring system (ExPreS) computes local extreme statistics and lookup tables mapping theprecipitation amount with Average Recurrence Interval (ARI) using retrospective 3B42RT data based on Generalized Extreme Value (GEV)distribution functions. The real-time (RT) 3B42RT data is converted to ARI as soon as it becomes available to provide warnings on potentialhazards.The figure shows a sample web display showing the 1-day precipitation accumulation (top panel) and the accompanying clickable ARI map(bottom panel) on April 27, 2011. The ARI map highlights the areas with locally rare extreme precipitation accumulations that could lead topotential hazards, especially over land. The big red dot in the southeastern US captures the heaviest rain episode with ARI 50 yeas duringthe April - May period in 2011, when a series of heavy rain episodes led to massive lower Mississippi River floods - one of the largest andmost damaging floods recorded along this U.S. waterway in the past century.Scientific significance, societal relevance, and relationships to future missions: The TRMM Extreme Precipitation Monitoring Systemconverts TRMM data into easily understood ARI warning system for potential rain-triggered hazards. It facilitates the use of NASA’s scienceand technology for the direct benefit of US and global disaster monitoring communities as well as the general public. The system will befurther improved with better statistics and with upcoming high-resolution GPM IMERG data.Earth Sciences Division - Atmospheres
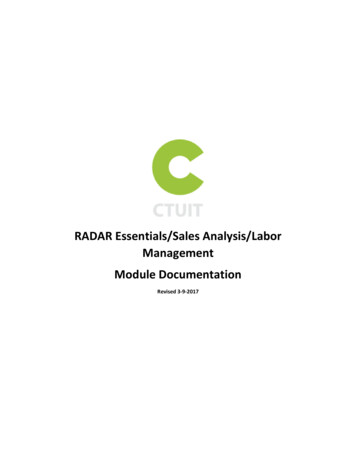
Improvements in the Simulation of Ozone in GEOSCCMLuke Oman and Anne Douglass, Code 614, NASA/GSFCThe Goddard Earth Observing System Chemistry-Climate Model (GEOSCCM) was featuredprominently in the most recent 2014 World Meteorological Organization’s (WMO) quadrennialScientific Assessment of Ozone Depletion. Due to continued model development, the 2014 ozonesimulation compares better with satellite and ground-based observations than prior simulations thatwere contributed to WMO 2006 and 2010 reports.Earth Sciences Division - Atmospheres
Name: Luke Oman, NASA/GSFC, Code 614E-mail: luke.d.oman@nasa.govPhone: 301-614-6032References:Oman, L. D., and A. R. Douglass, 2014: Improvements in Total Column Ozone in GEOSCCM and Comparisons with a New Ozone Depleting SubstancesScenario, Journal of Geophysical Research: Atmospheres, 119, 5613-5624, doi:10.1002/2014JD021590.World Meteorological Organization (WMO), Scientific Assessment of Ozone Depletion: 2014, World Meteorological Organization, Global Ozone Researchand Monitoring Project—Report No. 55, 416 pp., Geneva, Switzerland, 2014.Data Sources:The satellite observations are from NASA’s Total and Profile Merged Ozone Data Set version 8.6 [Bhartia et al., 2013] (http://acbd-ext.gsfc.nasa.gov/Data services/merged/index.html) compiled from a series of NASA and NOAA satellites since 1970. The ground-based total column ozone (TCO)measurements, which are updated from Fioletov et al. [2008], go back to 1964.Bhartia, P. K., R. D. McPeters, L. E. Flynn, S. Taylor, N. A. Kramarova, S. Frith, B. Fisher, and M. DeLand (2013), Solar backscatter UV (SBUV) totalozone and profile algorithm, Atmospheric Measurement Techniques, 6, 2533–2548, doi:10.5194/amt-6-2533-2013.Fioletov, V. E., et al. (2008), The performance of the ground-based total ozone network assessed using satellite data, Journal of Geophysical Research,113, D14313, doi:10.1029/2008JD009809.Technical Description of Figure:The evolution of quasi-global (60 S-60 N) total column ozone (DU) simulated in different versions of the Goddard Earth Observing System ChemistryClimate Model (GEOSCCM) is shown compared to observed satellite and ground-based measurements. Different versions of GEOSCCM are labeled2006, 2010 and 2014 and represent the contributions to the World Meteorological Organization’s (WMO) quadrennial Scientific Assessment of OzoneDepletion reports. Continued model development, including: an internally generated quasi-biennial oscillation, impacts of volcanic eruptions, very shortlived bromine sources, and a better representation of photochemistry at high solar zenith angles, has resulted in a significantly improved simulation ofozone compared to satellite and ground-based data.Scientific significance, societal relevance, and relationships to future missions: GEOSCCM played an important role in the World MeteorologicalOrganization’s (WMO) quadrennial Scientific Assessment of Ozone Depletion (2006, 2010, and 2014) reports, with not only in understanding paststchanges in ozone but also helping to understand and project changes over the 21 century. Data from operational SBUV/2 instruments is being used tocontinue this long climate record of total column ozone from satellites like Suomi National Polar-orbiting Partnership (NPP). Future missions such as JointPolar Satellite System (JPSS) are the next generation of satellites carrying ozone sensors that can continue this critical record well into the future.Earth Sciences Division - Atmospheres
Four-Frequency Radar Measurements of Clouds and Precipitation From NASA ER-2 Gerald Heymsfield, Code 612, NASA/GSFC . EXRAD has a fixed nadir beam and a cross-track or conical scanning beam. . inches) and had updrafts exceeding 25 ms-1 (seen by the deep blue colors in the Doppler