Transcription
FINAL REPORTProfessional Engineering Licensure Statistics for Engineering and EngineeringTechnology FacultySubmitted to the American Society for Engineering EducationEngineering Technology DivisionByRobert Weissbach, Associate Professor and ChairDepartment of Engineering TechnologyIndiana University – Purdue University, IndianapolisMay 2020
IntroductionThe Engineering Technology National Forum (ETNF) has identified licensure of EngineeringTechnology (ET) graduates as a national issue. The National Society of Professional Engineers(NSPE) indicates that as of September 2018, only 20 states allow ET graduates to earn aProfessional Engineering (PE) license in that state [1]. An additional twenty states, plus theDistrict of Columbia, allow ET graduates to earn a PE license “after completing additionaleducation and experience requirements and/or passing supplemental verification” that are notrequired of graduates with engineering degrees. According to [1], nine states do not allow ETgraduates to earn a PE license under any circumstances.As indicated in [2], ET graduates are hired by employers as engineers. In addition, a survey ofemployers of ET graduates, found at [3], indicates that employers of these graduatesoverwhelmingly supported their ability to obtain a PE license should they choose to pursue one.Engineering Technology students are generally taught by faculty members who have eitherengineering or ET undergraduate degrees, and who also have relevant industrial experience. Inboth engineering and ET programs, a percentage of faculty will have obtained a PE license in atleast one state. Such faculty members have demonstrated both technical competence and adedication to “perform under a standard of professional behavior that requires adherence to thehighest principles of ethical conduct” [4]. Their experience, technical competence and ethicalbehavior is invaluable for preparing future engineers to succeed in the workplace.The purpose of this proposal was to provide a snapshot of the percentage of faculty in ABETaccredited programs in both engineering and engineering technology that have obtained a PElicense within the United State. This snapshot enables a comparison of the two sets of faculty,and identifies any similarities and differences within the disciplines identified in Table I.Table I. Disciplines Evaluated for Identifying Faculty with at least one PE License.Engineering DisciplineET DisciplineMechanical Engineering (ME) Mechanical Engineering Technology (MET)Electrical Engineering (EE)Electrical Engineering Technology (EET)Civil Engineering (CE)Civil Engineering Technology (CET)The effort only focuses on full-time faculty members. It is recognized that adjunct facultymembers may play an important role in delivering a particular academic program, but since theircommitment to the program can vary greatly, they are not included in the overall data mining.Additionally, the data mining will discriminate between Research 1 universities and otheruniversity designations, to identify if necessary any skewing of data due to the large number offaculty at larger institutions that focus heavily on research, grants and scholarship.ApproachTwo graduate students were employed to create a set of spreadsheets, one focusing onengineering programs and the other focusing on engineering technology programs. Programswere targeted based on [5]. All programs listed were ABET accredited. The list of programs ineach category are provided in Table II. This list shows that 26 institutions with engineering
programs and 27 institutions with engineering technology programs were contacted. Althoughthe list of institutions was not exhaustive, especially considering the number of engineeringprograms in the United States, there should be enough data to make some assertions about therelative percentage of engineering versus engineering technology faculty that are licensed in atleast one state.Table II. Institutions Contacted.Engineering Technology ProgramsEngineering Programs ContactedContactedVaughn College of Aeronautics andAuburn UniversityTechnologyBoise State UniversityPurdue University Polytechnic InstituteCalifornia State University NorthridgeMichigan Technological UniversityCleveland State UniversityCleveland State UniversityColorado School of MinesUniversity of Houston-College of TechnologyIowa State UniversityMetropolitan State University of DenverIUPUIUniversity of Arkansas at Little RockJohns Hopkins UniversityOklahoma State UniversityMontana State UniversityUniversity of HartfordOhio UniversityUniversity of ToledoOklahoma State UniversityMontana State UniversityOregon State UniversityFerris State UniversityPurdue UniversityAlfred State SUNY College of TechnologySeattle UniversityKennesaw State UniversitySouth Dakota State UniversityRochester Institute of TechnologySouthern Illinois University EdwardsvilleOregon Institute of TechnologyStevens Institute of TechnologyWayne State UniversityStony Brook UniversityPenn State BehrendUniversity of Alabama at BirminghamUniversity of MaineUniversity of GeorgiaUniversity of CincinnatiUniversity of HartfordOld Dominion UniversityUniversity of Nevada, RenoNew Mexico State UniversityUniversity of Notre DameVirginia State UniversityUniversity of VirginiaYoungstown State UniversityUniversity of WyomingUniversity of North TexasUtah State UniversityUNC CharlotteIUPUIOnce an institution was identified, the student went to the program website and attempted toidentify which faculty members were licensed. This entailed potentially looking at thefollowing: Whether the faculty member had “P.E.” after their nameWhether the faculty member included being licensed in their educational and industrybackgroundSearching the internet to see if the person was licensed in the state they were employed
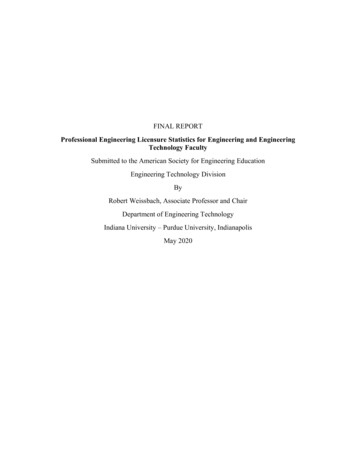
Even with all of these approaches, there was no certainty that a particular faculty member waslicensed. So, the next step was to take the data compiled by the student for each institution anddraft an email to the institution’s program or department chair, asking them to validate the datacompiled by the student for that program. In fact, two emails were sent, one in the fall semester2019 and, if necessary, a follow-up email was sent in the spring semester 2020. Example emailsto a department chair are provided in Appendix A.Responses from a program head or department chair allowed the spreadsheet data to be adjustedas necessary, and validated. This might include identifying faculty members who were licensedthat the students didn’t identify, as well as adding or removing faculty members who either wereno longer at the university full time, or were in a department but not in the program of interest.For example, in one department, there were faculty members in both civil engineering as well asenvironmental science (ENSC), and the department chair was able to extract the ENSC facultymembers so only the CE members who were licensed were tallied. Interestingly, there wereinstances where program faculty had been licensed at one time, but did not pay the fees to renew.In this case, those faculty were not counted as being licensed since their license had expired.Typically, no more than three changes were identified versus the student data, and in many casesthere was only one change or no changes. It is important to know the accuracy of the initialestimates by the students, since a number of programs did not respond, which could skew theoverall data if the students did not perform due diligence in their effort. Figure 1 shows a countof the number of times that a particular difference occurred between the initial estimate by thestudents and the actual number of licensed engineers provided by the program or department. Anegative number indicates that the students over-estimated the number of PEs in a program. Thisoccurred due to the retirement of faculty who had been licensed, for example.Difference in Number of PEs Between InitialEstimate and Validated Total(n 98)6050Count403020100-101234Difference Between Initial Estimate and Validated Total(Negative Initial count was too 18%3.06%1.02%1.02%Figure 1. Count of the Difference in the Number of PEs between the Initial Estimate and theValidated Total
As seen in Figure 1, 55% of the estimates were validated with no change in numbers, and 85% ofthe estimates were within /- 1 of the total provided by the program or department. Only 2% ofthe estimates were off by more than three, with one significant outlier (a civil engineeringprogram). Thus, although a number of programs did not respond to a request to validate the data,the students generally did a very nice job with their estimates. Therefore, results and assessmentprovided here should not be much different than had all the program and departments responded.ResultsResponse rates for Engineering and ET programs are provided in Table III below.Table III. Response Data for Engineering and ET ProgramsProgramCivil EngineeringCivil EngineeringTechnologyElectrical EngineeringElectrical EngineeringTechnologyMechanical EngineeringMechanical EngineeringTechnologyNumber ofProgramsContacted25Number ofProgramsResponded16Percentage ofResponses12108326218124177126155826207764Data has been collected and condensed below into Table IV and V for engineering and ETprograms, respectively. Given that the response rate from all engineering and ET program ordepartment heads was above 60% except for ME (58%), and given that the student estimates ofthe number of PEs at each institution was pretty close based on Figure 1 above, it can beconcluded that the data collected is reasonable.Note that the data for all three engineering programs in Table III showed some consistencybetween the percent of faculty among the responded programs and the unresponsive programs.For example, there was less than 1% difference between the responded and unresponsiveprograms in mechanical engineering, while the largest gap occurred in civil engineering, with anapproximate 11% difference between the responded and unresponsive programs. Lessconsistency between the percentages existed for the EET and MET programs, especially whenlooking at the much higher percentage of licensed MET faculty from the programs thatresponded to those that did not. Responsive programs had a higher percentage of PEs in generalbecause the program or department head was able to identify faculty members who were PEsthat the students were unable to identify. The converse did occur but was uncommon, namely, aprogram or department head identifying a faculty member who wasn’t a PE that had beenidentified as such by the students.The reduced number of CET programs contacted is due to the reduced number of CET programsnationally when compared with the number of EET and MET programs.
Table IV. Engineering Program DataNAME OF INSTITUTIONAuburn UniversityBoise State UniversityCalifornia State University NorthridgeCleveland State UniversityColorado School of MinesIowa State UniversityIUPUIJohns Hopkins UniversityMontana State UniversityOhio UniversityOklahoma State UniversityOregon State UniversityPurdue UniversitySeattle UniversitySouth Dakota State UniversitySouthern Illinois University EdwardsvilleStevens Institute of TechnologyStony Brook UniversityUniversity of Alabama at BirminghamUniversity of GeorgiaUniversity of HartfordUniversity of Nevada, RenoUniversity of Notre DameUniversity of VirginiaUniversity of WyomingUtah State UniversityTotalUnresponded TotalResponded TotalTotal %Unresponded Total %Responded Total %KeyCE-PE CE-Total EE-PE EE-Total ME-PE ME-Total Total PE Total 4.159.8233.051.5410.2142.685.469.54Percentage 46.678.3343.7512.86Faculty Total %: 15.34on university name means email has been sent out to respective department chairson respective department data means data has been confirmed/feedback has been closed/that department doesn’t exist in that university-no action further neededon respective department data means that have been resent to professors but still no responseTable V. ET Program DataNAME OF INSTITUTIONVaughn College of Aeronautics and TechnologyPurdue University Polytechnic InstituteMichigan Technological UniversityCleveland State UniversityUniversity of Houston-College of TechnologyMetropolitan State University of DenverUniversity of Arkansas at Little RockOklahoma State UniversityUniversity of HartfordUniversity of ToledoMontana State UniversityFerris State UniversityAlfred State SUNY College of TechnologyKennesaw State UniversityRochester Institute of TechnologyOregon Institute of TechnologyWayne State UniversityPenn State BehrendUniversity of MaineUniversity of CincinnatiOld Dominion UniversityNew Mexico State UniversityVirginia State UniversityYoungstown State UniversityUniversity of North TexasUNC CharlotteIUPUITotalUnresponded TotalResponded TotalTotal %Unresponded Total %Responded Total %KeyCET-PECET-Total otal MET-PEMET-Total Total PE Total Faculty Percentage 099.2317.4622.79792746on university name means email has been sent out to respective department chairson respective department data means data has been confirmed/feedback has been closed/that department doesn’t exist in that university-no action further neededon respective department data means that have been resent to professors but still no response
Table VI compares the overall percentages for the various engineering and ET programs.Table VI. Comparison of Overall PercentagesProgramCivil EngineeringCivil EngineeringTechnologyElectrical EngineeringElectrical EngineeringTechnologyMechanical EngineeringMechanical EngineeringTechnologyPercent ofPEsUnresponded33.05Percent ofPEsResponded42.68Percent ofPEs 19.549.829.2322.8019.3838.65As we compare the engineering data to the ET data from peer institutions, a pattern does seem toemerge. Clearly, the highest percentage of PEs within the engineering programs exists amongcivil engineering faculty members, with mechanical engineering faculty significantly less, andelectrical engineering faculty even less than that. This also remained true looking at theequivalent ET programs. Noticeably, in virtually all cases in Table VI, the percentage of PEs inthe ET programs was higher than in the peer engineering programs, whether looking at programsthat didn’t respond, programs that responded, or the total of all programs contacted. In the oneoutlying case, the unresponded percentage of licensed MET faculty was only slightly less thanfor the licensed ME faculty. Otherwise, in the case of both electrical and mechanical degreeprograms, the differences were significant. In all cases with the electrical programs, thepercentage of faculty with a PE license in the U.S. was at least 3.5 times greater for EET facultythan for EE faculty. Percentages for faculty in mechanical degree programs were relativelysimilar among those programs that didn’t respond, but were around two times greater for METfaculty than ME faculty for those programs that did respond, as well as for the total percentage.An additional study looked at only the engineering programs from Research I (R1) universities[6]. This data is provided in Table VII below. Table VIII compares the data for engineeringprograms overall with those of only R1 universities. This data shows a reasonably closerelationship between the entire pool of engineering programs and those programs in R1institutions, especially when looking at the total percentage of PEs, covering both thoseinstitutions that responded as well as those that did not respond. There is a slight drop in the lastcolumn of Table VIII when the R1 institutions are considered, most noticeably in the civilengineering programs, but the data does not appear to have any significant impact.
Table VII. Engineering Program Data for Research I UniversitiesNAME OF INSTITUTIONAuburn UniversityIowa State UniversityJohns Hopkins UniversityMontana State UniversityOklahoma State UniversityOregon State UniversityPurdue UniversityStony Brook UniversityUniversity of Alabama at BirminghamUniversity of GeorgiaUniversity of Notre DameUniversity of VirginiaTotalUnresponded TotalResponded TotalTotal %Unresponded Total %Responded Total %KeyCE-PE CE-Total EE-PE EE-Total ME-PE ME-Total Total PE Total 83.697.8633.17Percentage 678.33Faculty Total %: 15.34on university name means email has been sent out to respective department chairson respective department data means data has been confirmed/feedback has been closed/that department doesn’t exist in that university-no action further neededon respective department data means that have been resent to professors but still no responseTable VIII. Comparison of Percentages of Engineering Programs Overall with those of only R1InstitutionsProgramCivil EngineeringCivil Engineering - R1Electrical EngineeringElectrical Engineering –R1Mechanical EngineeringMechanical Engineering- R1Percent ofPEsNonresponded33.0534.881.54Percent ofPEsResponded42.6833.175.46Percent ofPEs .834.15ConclusionAlthough only a subset of all engineering and ET programs were contacted during this study, anumber of conclusions can be drawn. First, the data shows, at a minimum, that ET programsemploy faculty with a PE license in percentages that are comparable to, if not exceeding, those inengineering programs. Civil engineering and CET programs are certainly comparable in termsof percentage of faculty with a PE license. But the data seems to indicate more emphasis in ETprograms on hiring faculty with a PE license in EET and MET programs as compared to EE andME programs. One reason could be that EE and ME programs typically only hire faculty whohave a PhD and who are focused on research productivity, including writing papers and
submitting grant proposals. In the civil engineering field, however, research could be fundedthrough departments of transportation, including federal and state agencies, who may be moreinterested in knowing that investigators they are funding are licensed. Additionally, inengineering technology programs historically, tenure-line faculty candidates have more flexiblybeen hired who have either a PhD, or a Master’s degree with a minimum number of years ofindustry experience along with a PE license.Second, the percentage of faculty who are licensed is especially low in both the electrical andmechanical programs. From the data provided, no set of faculty exceeded 20% who werelicensed. If learning from a licensed engineer is important, then those numbers will need to rise.Third, one element of the data that was not explored concerned the number of faculty holdingboth a doctoral degree as well as a PE license. A question might be raised as to whetherinstitutions are able to recruit and hire new faculty with both sets of credentials. This leads to alarger issue of the importance of licensure in areas such as EE and ME. Faculty members whoare focused on research may see no benefit in becoming licensed if licensure doesn’t help securegrants. It may seem draconian, but suppose grant agencies required researchers to be licensed tosecure grant funding. One might see a much larger percentage of faculty applying to becomelicensed. However, if the grant agencies consider this to be an artificial barrier for faculty, thenthis change will never happen.Overall, it seems clear that NSPE should be aware that students are equally likely, if not morelikely, to learn from a licensed engineer if they are enrolled in an engineering technologyprogram versus an engineering program as an undergraduate.AcknowledgementThe author of this report would like to acknowledge the work of Mr. Souparna Satpati and Mr.Nicholas Kieser, students in the School of Engineering & Technology at IUPUI, for their supportin creating, populating and maintaining the spreadsheets for each institution identified in thisreport.References:[1] NSPE Report, “Can Engineering Technology Graduates Earn a PE License?,” found cense.pdf[2] Land, R. E., “Engineering Technologists are Engineers,” Journal of EngineeringTechnology, pp. 32-39, Spring 2012.[3] Engineering Technology website: www.engtech.org[4] NSPE website: www.nspe.org[5] Profiles of Engineering and Engineering Technology, ASEE, 2018[6] Carnegie Classification of Institutions of Higher Education, kup/srp.php?clq %7B%22basic2005 ids%22%3A%2215%22%7D&start page standard.php&backurl standard.php&limit 0,50Note: Copies of spreadsheets for individual institutions are available from the author.
Appendix ASample First and Second Emails to Program/Department HeadsFirst EmailFrom: Weissbach, Robert StephenSent: Saturday, October 19, 2019 1:15 PMTo: King, BrianSubject: Fw: [External] Licensed Engineers Teaching within Academia- IUPUI EEDear Professor King,I am working on a funded project through the American Society for Engineering Education todetermine the influence of licensed professional engineers (PEs) on engineering education. Aspart of this project, I am trying to determine the number of full-time (tenure line or non-tenureline) faculty members in your department that are registered PEs in at least one state within theUnited States. I am hopeful that you can take a few minutes to review the list and indicate what ifany adjustments to the provided list are necessary.I thank you in advance for taking the time to look at this list and ensure its accuracy.Sincerely,Rob WeissbachDr. Robert WeissbachChair, Department of Engineering TechnologySchool of Engineering and TechnologyIndiana University-Purdue University Indianapolis799 W. Michigan St., ET 201PIndianapolis, IN 46202(317) 274 – 7799Email: rweissba@iupui.eduBrian King0Zina Ben Miled0Stanley Yung-Ping ChienLauren Christopher 0Euzeli Cipriano Dos SantosMohamed El-SharkawyDongsoo Stephen KimSarah Koskie 0John Lee0Lingxi Li0Maher Rizkalla0Steven Rovnyak00000
David RussomannoPaul Salama 0Peter Schubert 0Jeffrey Sears 0Seemein ShayestehJane Simpson 0Qingxue ZhangTotal PE in EE0000---Second EmailFrom: Weissbach, Robert Stephen rweissba@iupui.edu Sent: Thursday, February 27, 2020 4:50 PMTo: King, Brian briking@iupui.edu Subject: Licensed Engineers Teaching within Academia- IUPUI EEHi Brian,Some time ago I reached out to you to identify which of the full-time faculty in your departmentwere licensed as a professional engineer in at least one state in the country. Based on myrecords, it appears that I never received a response from you. I believe that having accurate datacan be valuable in showing the relative importance universities place on professional registrationof their faculty members with engineering backgrounds.I have pasted the original email below. I’m hopeful you’ll take a few minutes to review the listand ensure its accuracy, and to let me know what if any changes are necessary.Thank you in advance Brian for your support of this effort.Sincerely,Rob Weissbach(note: The more personal approach in this second email is due to the author personally knowingthe department head at this institution. More typically, the recipient is addressed as “Professor last name .)
Cleveland State University Cleveland State University . Ohio University University of Toledo Oklahoma State University Montana State University Oregon State University Ferris State University Purdue University Alfred State SUNY College of Technology Seattle University Kennesaw State University South Dakota State University Rochester Institute .