Transcription
Parameter Estimation for Differential Equations: A Generalized Smoothing ApproachJ. O. Ramsay, G. Hooker, D. Campbell and J. CaoJ. O. Ramsay,Department of Psychology,1205 Dr. Penfield Ave.,Montreal, Quebec,Canada, H3A 1B1.ramsay@psych.mcgill.caThe research was supported by Grant 320 from the Natural Science and EngineeringResearch Council of Canada, Grant 107553 from the Canadian Institute for Health Research,and Grant 208683 from Mathematics of Information Technology and Complex Systems(MITACS) to J. O. Ramsay. The authors wish to thank Professors K. McAuley and J.McLellan and Mr. Saeed Varziri of the Department of Chemical Engineering at Queen’sUniversity for instruction in the language and principles of chemical engineering, manyconsultations and much useful advice. Appreciation is also due to the referees, whosecomments on an earlier version of the paper have been invaluable.
Summary. We propose a new method for estimating parameters in non-linear differentialequations. These models represent change in a system by linking the behavior of a derivativeof a process to the behavior of the process itself. Current methods for estimating parametersin differential equations from noisy data are computationally intensive and often poorly suitedto statistical techniques such as inference and interval estimation. This paper describes a newmethod that uses noisy data to estimate the parameters defining a system of nonlinear differential equations. The approach is based on a modification of data smoothing methods alongwith a generalization of profiled estimation. We derive interval estimates and show that thesehave good coverage properties on data simulated from chemical engineering and neurobiology. The method is demonstrated using real-world data from chemistry and from the progressof the auto-immune disease lupus.Keywords: Differential equations, profiled estimation, estimating equations, Gauss-Newtonmethods, functional data analysis1.The challenges in dynamic systems estimationWe have in mind a process that transforms a set of m input functions, with values asfunctions of time t [0, T ] indicated by vector u(t), into a set of d output functions withvalues x(t). Examples are a single neuron whose response is determined by excitation froma number of other neurons, and a chemical reactor that transforms a set of chemical speciesinto a product within the context of additional inputs such as temperature and flow of acoolant and additional outputs such as the temperature of the product. The number ofoutputs may be impressive; d 50 is not unusual in modeling polymer production, forexample, and Deuflhard and Bornemann (2000), in their nice introduction to the world ofdynamic systems models, cite chemical reaction kinetic models where d is in the thousands.It is routine that only some of the outputs will be measured. For example, temperaturesin a chemical process can usually be obtained online cheaply and accurately, but concentrations of chemical species can involve expensive assays that can take months to completeand have relatively high error levels as well. The abundance of a predacious species may beestimable, but the subpopulation of reproducing individuals may be impossible to count.On the other hand, we take the values u(t) to be available with negligible error at all timest.Ordinary differential equations (ODE’s) model output change directly by linking thederivatives of the output to x itself and, possibly, to inputs u. That is, using ẋ(t) to denotethe value of the first derivative of x at time t,ẋ(t) f(x, u, t θ).(1)Solutions of the ODE given initial values x(0) exist and are unique over a neighborhoodof (0, x(0) if f is continuously differentiable with respect to x or, more generally, Lipschitzcontinuous with respect to x. Vector θ contains any parameters defining f whose valuesare not known from experimental data, theoretical considerations or other sources of information. Although (1) appears to cover only first order systems, systems with the highestorder derivative Dn x on the left side are reducible to a first order form by defining n newvariables, x1 x, x2 ẋ1 and so on up to xn 1 Dn 1 x, and (1) can easily be extended to include more general differential equation systems. Dependencies of f on t otherthan through x and u arise when, for example, certain parameters defining the system arethemselves time-varying.
Parameter Estimation for Differential Equations: A Generalized Smoothing Approach3Most ODE systems are not solvable analytically, so that conventional data-fitting methodology is not directly applicable. Exceptions are linear systems with constant coefficients,where the machinery of the Laplace transform and transform functions plays a role, aresolvable, and a statistical treatment of these is available in Bates and Watts (1988) andSeber and Wild (1989). Discrete versions of such systems, that is, stationary systems ofdifference equations for equally spaced time points, are also well treated in the classical timeseries ARIMA and state-space literature, and will not be considered further in this paper,where we consider systems of nonlinear ordinary differential equations or ODE’s. In fact,it is the capacity of relatively simple nonlinear differential equations to define functionalrelations of great complexity that explains why they are so useful.We also set aside stochastic differential equation systems involving inputs or perturbations of parameters that are the derivative of a Wiener process. The mathematicalcomplexities of working with such systems has implied that, in practice, the range of ODEstructures considered has remained extremely restricted, and we focus on modeling situations where much more complex ODE structures are required and where inputs can beconsidered as being at least piecewise smooth.The insolvability of most ODE’s has meant that statistical science has had little impacton the fitting of such models to data. Current methods for estimating ODE’s from noisydata are often slow, uncertain to provide satisfactory results, and do not lend themselves wellcollateral analyses such as interval estimation and inference. Moreover, when only a subsetof variables in a system are actually measured, the remainder are effectively functionallatent variables, a feature that adds further challenges to data analysis. Finally, althoughone would hope that the total number of measured values, along with its distribution overmeasured values, would have a healthy ratio to the dimension of the parameter vector θ,such is often not the case. Measurements in biological, medical and physiology, for example,may require invasive or destructive procedures that can strictly control the number ofmeasurements that can realistically be obtained. These problems can be often be offset,however, by a high level of measurement precision.This paper describes a method that is based an extension of data smoothing methodsalong with a generalization of profiled estimation to estimate the parameters θ defining asystem of nonlinear differential equations. High dimensional basis function expansions areused to represent the functions in x, and the approach depends critically on consideringthe coefficients of these expansions as nuisance parameters. This leads to the notion of aparameter cascade, and the impact of nuisance parameter on the estimation of structuralparameters is controlled through a multi-criterion optimization process rather than the moreusual marginalization procedure.Differential equations as a rule do not define their solutions uniquely, but rather as amanifold of solutions of typical dimension d. For example, ẋ γx and D2 x ω 2 x implysolutions of the form x(t) c1 exp( γt) and x(t) c1 sin(ωt) c2 cos(ωt), respectively,where coefficients c1 and c2 are arbitrary. Thus, at least d observations are required toidentify the solution that best fits the data, and initial value problems supply these valuesas x(0), while boundary value value problems require d values selected from x(0) and x(T ).If initial or boundary values are considered to be available without error, then thelarge collection of numerical methods for estimating these solutions, treated in texts suchas Deuflhard and Bornemann (2000), may be brought into play. On the other hand, ifeither there are no observations at 0 and T or the observations supplied are subject tomeasurement error, than these initial or boundary values, if required, can be consideredparameters that must be included in an augmented parameter vector θ (x(0)0 , θ 0 )0 . Our
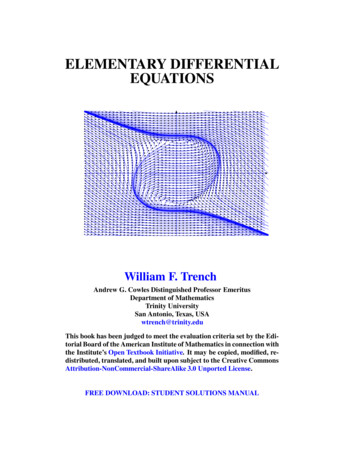
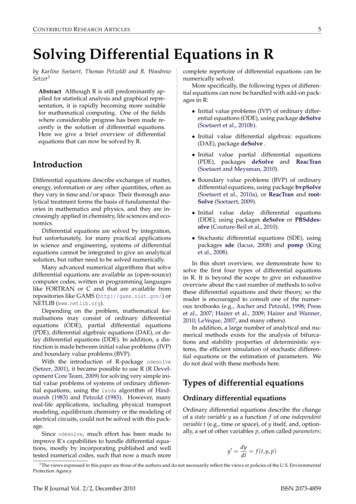
approach may be considered as an extension of methods for these two situations wherethe data over-determine the system, are distributed anywhere in [0, T ], and are subject toobservational error. We may call such a situation a distributed data ODE problem.1.1. The data and error model contextsWe assume that a subset I of the d output variables are measured at time points tij , i I {1, . . . , d}; j 1, ., Ni , and that yij is a corresponding measurement that is subjectto measurement error eij yij xi (tij ). Let ei indicate the vector of errors associatedwith observed variable i I, and let gi (ei σ i ) indicate the joint density of these errorsconditional on a parameter vector σ i . In practice it is common to assume independentlydistributed Gaussian errors with mean 0 and standard deviation σi , but in fact autocorrelation structure and nonstationary variance are often evident in the data, and when thesefeatures are also modeled, these parameters are also incorporated into σ i . Let σ indicatethe concatenation of the σ i vectors. Although our notation is consistent with assumingthat errors are independent across variables, inter-variable error dependencies, too, can beaccommodated by the approach developed in this paper.1.2. Two test-bed problemsTwo elementary problems will be used in the paper to illustrate aspects of the data fittingproblem.1.2.1. The FitzHugh-Nagumo neural spike potential equationsThese equations were developed by FitzHugh (1961) and Nagumo et al. (1962) as simplifications of the Hodgkin and Huxley (1952) model of the behavior of spike potentials in thegiant axon of squid neurons:µ¶V3V̇ c V R u(t)31Ṙ (V a bR)(2)cThe system describes the reciprocal dependencies of the voltage V across an axon membraneand a recovery variable R summarizing outward currents, as well as the impact of a timevarying external input u. Although not intended to provide a close fit to actual neural spikepotential data, solutions to the FitzHugh-Nagumo ODE’s do exhibit features common toelements of biological neural networks (Wilson (1999)).The parameters are θ {a, b, c}, to which we will assign values (0.2, 0.2, 3), respectively.The R equation is the simple constant coefficient linear system Ṙ (b/c)R linearly forcedby V and a. However, the V equation is nonlinear; when V 0 is small, V̇ cV andconsequently exhibits nearly exponential increase, but as V passes 3, the influence of V 3 /3 takes over and turns V back toward 0. Consequently, unforced solutions, whereu(t) 0, quickly converge from a range of starting values to periodic behavior that alternates between the smooth evolution and the sharp changes in direction shown in Figure1.A particular concern in ODE modeling is the possibly complex nature of the fit surface.The existence of many local minima has been commented on in Esposito and Floudas (2000)
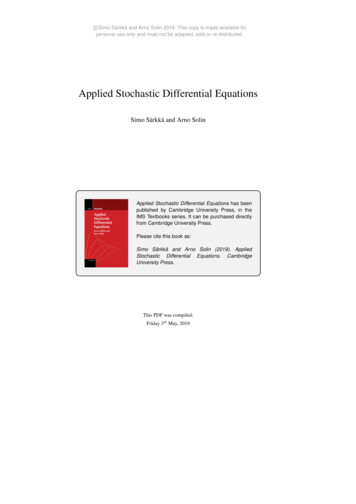
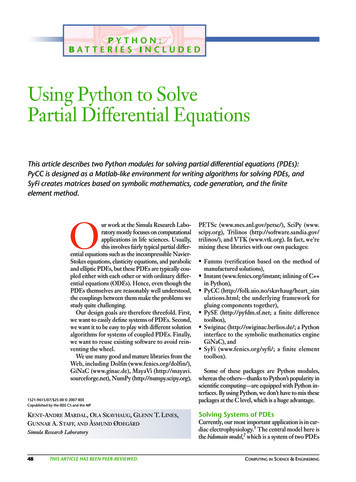
Parameter Estimation for Differential Equations: A Generalized Smoothing Approach5FitzHugh Nagumo Equations: V420 205101520FitzHugh Nagumo Equations: R210 105101520Fig. 1. The solid lines show the limiting behavior of voltage V and recovery R defined by the unforcedFitzHugh-Nagumo equations (2) with parameter values a 0.2, b 0.2 and c 3.0 and initialconditions (V0 , R0 ) ( 1, 1).150010005000 1 0.5010.501a1.5 1bFig. 2. The integrated squared difference between solutions of the FitzHugh-Nagumo equations forparameters (a, b) and (0.2, 0.2) as a and b are varied about (0.2, 0.2).
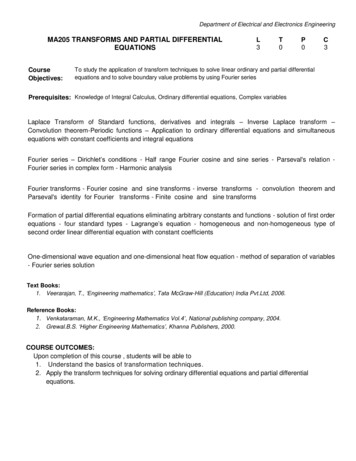
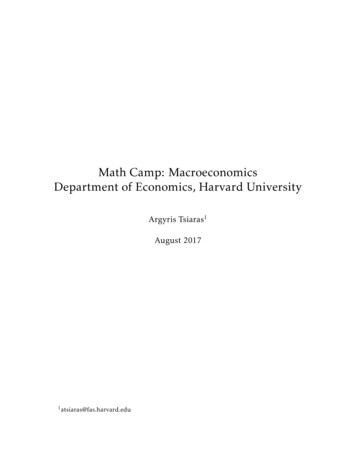
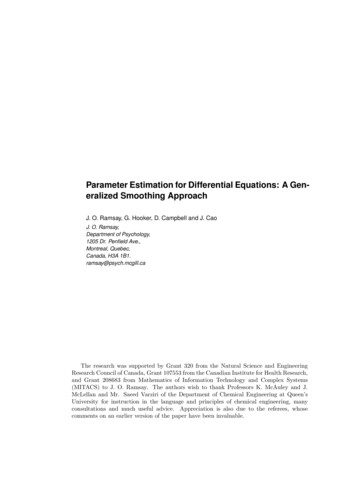
and a number of computationally demanding algorithms, such as simulated annealing, havebeen proposed to overcome this problem. For example, Jaeger et al. (2004) reported usingweeks of computation to compute a point estimate. Figure 2 displays the integrated squareddifference surface obtained by varying only the parameters a and b of the FitzHugh-Nagumoequations (2) in a fit to the errorless paths shown in Figure 1. The features of this surfaceinclude “ripples” due to changes in the shape and period of the limit cycle and breaks dueto bifurcations, or sharp changes in behavior.1.2.2. The tank reactor equationsThe concept of a continuously stirred tank reactor, or a CSTR, in chemical engineeringconsists of a tank surrounded by cooling jacket and an impeller which stirs the contents. Afluid is pumped into the tank containing a reagent with concentration Cin at a flow rate Finand temperature Tin . The reaction produces a product that leaves the tank with concentration Cout and temperature Tout . A coolant enters the cooling jacket with temperatureTcool and flow rate Fcool .The differential equations used to model a CSTR, taken from Marlin (2000) and simplified by setting the volume of the tank to one, areĊoutṪout βCC (Tout , Fin )Cout Fin Cin βT T (Fcool , Fin )Tout βT C (Tout , Fin )Cout Fin Tin α(Fcool )Tcool .(3)The input variables play two roles in the right sides of these equations: Through addedterms such as Fin Cin and Fin Tin , and via the weight functions βCC , βT C , βT T and α thatmultiply the output variables and Tcin , respectively. These time-varying multipliers dependon four system parameters as follows:βCC (Tout , Fin ) κ exp[ 104 τ (1/Tout 1/Tref )] FinβT T (Fcool , Fin ) α(Fcool ) FinβT C (Tout , Fin ) 130βCC (Tout , Fin )b 1bα(Fcool ) aFcool/(Fcool aFcool/2),(4)where Tref a fixed reference temperature within the range of the observed temperatures, andin this case was 350 deg K. These functions are defined by two pairs of parameters: (τ, κ)defining coefficient βCC and (a, b) defining coefficient α. The factor 104 in βCC rescales τ sothat all four parameters are within [0.4, 1.8]. These parameters are gathered in the vectorθ in (1), and determine the rate of the chemical reactions involved, or the reaction kinetics.The plant engineer needs to understand the dynamics of the two output variables Coutand Tout as determined by the five inputs Cin , Fin , Tin , Tcool and Fcool . A typical experimentdesigned to reveal these dynamics is illustrated in Figure 3, where we see each input variablestepped up from a baseline level, stepped down, and then returned to baseline. Two baselinelevels are presented for the most critical input, the coolant temperature Tcool .The behaviors of output variables Cout and Tout under the experimental regime, givenvalues 0.833, 0.461, 1.678 and 0.5 for parameters τ, κ, a and b, respectively, are shown inFigure 4. When the reactor runs in the cool mode, where the baseline coolant temperatureis 335 degrees Kelvin, the two outputs respond smoothly to the step changes in all inputs.However, an increase in baseline coolant temperature by 30 degrees Kelvin generates oscillations that come close to instability when the coolant temperature decreases, and this
Parameter Estimation for Differential Equations: A Generalized Smoothing Approach7Input flow rateF(t)1.510.5010203040506050605060C0(t)Input concentration2.221.8010203040Tcin(t)T0(t)Input temperature350300010203040Coolant temperature (red hot, blue cool)36034001020304050605060Fc(t)Coolant flow rate201510010203040Fig. 3. The five inputs to the chemical reactor modeled by the two equations (3): flow rate F (t), inputconcentration C0 (t), input temperature T0 (t), coolant temperature Tcin (t) and coolant flow F0 (t).Output concentration (red hot, blue cool)2C(t)1.510.5001020304050605060Output temperature420T(t)400380360340010203040Fig. 4. The two outputs, for each of coolant temperatures Tcool of 335 and 365 deg. K, from thechemical reactor modeled by the two equations (3): concentration C(t) and temperature T (t). Theinput functions are shown in Figure 3. Times at which an input variable is changed are shown asvertical dotted lines.
would be highly undesirable in an actual industrial process. These perturbations are due tothe double impact of a decrease in output temperature, which increases the size of both βCCand βT C . Increasing βT C raises the forcing term in the T equation, thus increasing temperature. Increasing βCC makes concentration more responsive to changes in temperature, butdecreases the size of the response. This push–pull process has a resonant frequency thatdepends on the kinetic constants, and when the ambient operating temperature reaches acertain level, the resonance appears. For coolant temperatures either above or below thiscritical zone, the oscillations disappear.The CSTR equations present two challenges that are not an issue for the Fitz-HughNagumo equations. The step changes in inputs induce corresponding discontinuities inthe output derivatives that complicate the estimation of solutions by numerical methods.Moreover, the engineer must estimate the reaction kinetics parameters in order to estimatethe cooling temperature range to avoid, but a key question is whether all four parameters areactually estimable given a particular data configuration. We have noted that step changesin inputs and near over-parameterization are common problems in dynamic modeling.1.3. A review of current ODE parameter estimation strategiesProcedures for estimating the parameters defining an ODE from noisy data tend to fallinto three broad classes: linearization and discretization methods for initial value valueproblems, and basis function expansion or collocation methods for boundary and distributeddata problems. Linearization involves replacing nonlinear structures by first order Taylorseries expansions, and tends only to be useful over short time intervals combined with rathermild nonlinearities, and will not be considered further.1.3.1. Data fitting by numerical approximation of an initial value problemThe numerical methods most often used to approximate solutions of ODE’s over a range[t0 , t1 ] use fixed initial values x0 x(t0 ) and adaptive discretization techniques. Thedata fitting process, often referred to by textbooks as the nonlinear least squares or NLSmethod, goes as follows. A numerical method such as the Runge-Kutta algorithm is usedto approximate the solution given a trial set of parameter values and initial conditions, aprocedure referred to by engineers as simulation. The fit value is input into an optimizationalgorithm that updates parameter estimates. If the initial conditions x(0) are unavailable,they must added to the parameters θ as quantities with respect to which the fit is optimized.The optimization process can proceed without using gradients, or these may be also beapproximated by solving the sensitivity differential equationsµ ¶d dx f f dxdx(0) , with 0.(5)dt dθ θ x dθdθIn the event that x(0) x0 must also be estimated, the corresponding sensitivity equationsareµ¶dx f dxdx(0)d , with I.(6)dt dx0 x dx0dx0There are a number of variants on this theme; any numerical method could conceivablybe used with any optimization algorithm. The most conventional of these are Runge-Kuttaintegration methods, combined with gradient descent in the survey paper Biegler et al.
Parameter Estimation for Differential Equations: A Generalized Smoothing Approach9(1986), and with a Nelder-Mead simplex algorithm in Fussmann et al. (2000). Systems forwhich solutions beginning at varying initial values tend to converge to a common trajectoryare called stiff, and require special methods that make use of the Jacobian f / x.The NLS procedure has many problems. It is computationally intensive since a numericalapproximation to a possibly complex process is required for each update of parameters andinitial conditions. The inaccuracy of the numerical approximation can be a problem, andespecially for stiff systems or for discontinuous inputs such as step functions or functionsconcentrating their masses at discrete points. In any case, numerical solution noise is addedto that of the data so as to further degrade parameter estimates. The size of the parameterset may be increased by the set of initial conditions needed to solve the system. NLS alsoonly produces point estimates of parameters, and where interval estimation is needed, agreat deal more computation can be required. As a consequence of all this, Marlin (2000)warns process control engineers to expect an error level of the order of 25% in parameterestimates. Nevertheless, the wide use of NLS testifies to the fact that, at least for simplesmooth systems, it can meet the goals of the application.A Bayesian approach which avoids the problems of local minima was suggested in Gelman et al. (2004). The authors set up a model where observations yj at times tj , conditionalon θ, are modelled with a density centered on the numerical solution to the differential equation, x̂(tj θ̂), such as yj N [x̂(tj θ), σ 2 ]. Since x̂(tj θ) has no closed form solution, theposterior density for θ has no closed form and inference must be based on simulation froma Metropolis-Hastings algorithm or other sampler. At each iteration of the sampler θ is updated. Since x̂(tj θ) must be numerically approximated conditional on the latest parameterestimates, this approach has some of the problems of the NLS method.1.3.2. Collocation methods using basis function expansionsOur own approach belongs in the family of collocation methods that express xi in terms abasis function expansionKiXxi (t) cik φik (t) c0i φi (t),(7)kwhere the number Ki of basis functions in vector φi is chosen so as to ensure enoughflexibility to capture the variation in xi and its derivatives that is required to satisfy thesystem equations (1). Although the original collocation methods used polynomial bases,spline systems tend to be used currently because of their computational efficiency, but alsobecause they allow control over the smoothness of the solution at specific values of t. Thelatter property is especially useful for dealing with discontinuities in ẋ associated with stepand point changes in inputs u. The problem of estimating xi is transformed into the problemof estimating the coefficients in ci . Collocation, of course, has its analogues everywhere inapplied mathematics and statistics, and is especially close in spirit to finite element methodsfor approximating solutions to partial differential equations. Basis function approaches todata smoothing in statistics adopt the same approach, but in the approach that we propose,xi (t ci ) must come at least close to solving (1), the structure of f being a source of additional“data” that inform the fitting process.Collocation methods were originally developed for boundary value problems, but the useof a spline basis to approximate an initial value problem is equivalent to the use of an implicitRunge-Kutta method for stepping points located at the knots defining the basis (Deuflhardand Bornemann (2000)). Collocation with spline bases was applied to data fitting problems
involving an ODE model by Varah (1982), who suggested a two-stage procedure in whicheach xi is first estimated by data smoothing methods without considering satisfying (1),followed by the minimization of a least squares measure of the fit of ẋ to f(x, u, t θ) withrespect to θ. The method worked well for the simple equations that were considered in thatpaper, but considerable care was required in the smoothing step to ensure a satisfactoryestimate of ẋ, and the technique also required that all variables in the system be measured.Voss et al. (1998) suggested using finite difference methods to approximate ẋ, but differenceapproximations are frequently too noisy and biassed to be useful.Ramsay and Silverman (2005) and Poyton et al. (2006) took Varah’s method furtherby iterating the two steps, and replacing the previous iteration’s roughness penalty by apenalty on the size of ẋ f (x, u, t θ) using the last minimizing value of θ. They found thatthis process, iterated principal differential analysis (iPDA), converged quickly to estimatesof both x and θ that had substantially improved bias and precision. However, iPDA is ajoint estimation procedure in the sense that it optimizes a single roughness-penalized fittingcriterion with respect to both c and θ, an aspect that will be discussed further in the nextsection.Bock (1983) proposed a multiple shooting method for data fitting combined with GaussNewton minimization, and a similar approach is followed in Li et al. (2005). Multipleshooting has been extended to systems of partial differential equations in Müller and Timmer(2004). These methods incorporate parameter estimation into the numerical scheme forsolving the differential equation; an approach also followed in Tjoa and Biegler (1991).They bear some similarity to our own methods in the sense that solutions to the differentialequations are not achieved at intermediate steps. However, our method can be viewedas enforcing an soft-threshold that represents an interpretable compromise between datafitting and solving the ODE.1.4. An overview of the paperOur approach to fitting differential equation models is developed in Section 2, where wedevelop the concepts of estimating functions and a generalization of profiled estimation.Section 2.8 follows up with some results on limiting behavior of estimates as the smoothingparameters increase, and discusses some heuristics.Sections 3 and 4 show how the method performs in practice. Section 3 tests the methodon simulated data for the FitzHugh-Nagumo and CSTR equations, and Section 4 estimatesdifferential equation models for data drawn from chemical engineering and medicine. Generalizations of the method are discussed in Section 5 and some open problems in fittingdifferential equations are given in Section 6. Some consistency results are provided in theAppendix.2.The generalized profiling estimation procedureWe first give an overview of our estimation strategy, and then provide further details below.As we noted above, our method is a variant of the collocation method, and as such, represents each variable in termsP of a basis function expansion (7). Let c indicate the compositevector of length K i I Ki that results from concatenatingP the ci ’s. Let Φi be theNi by Ki matrix of values φk (tij ), and let Φ be the N i I Ni by K super–matrixconstructed by placing the matrices Φi along the diagonals and zeros elsewhere. Accordingto this notation, we have the composite basis expansion x Φc.
Parameter Estimation for Differential Equations: A Generalized Smoothing Approach112.1. An overview of the estimation procedureDefining x as a set of basis function expansions implies that there are two classes of parameters to estimate: the parameters θ defining the equation, such as the four reactionkinetics parameters in the CSTR equations; and the coefficients in ci defining each basisfunction expansion. The equation parameters are structural in the sense of being of primaryinterest, as are the error distribution parameters in σ i , i I. But the coefficients ci areconsidered as nuisance parameters that are essential for fitting the data, but usually not ofdirect concern. The sizes of these vectors are apt to vary with the length of the observationinterval, density of observation, and other aspects of the structure of the data; and thenumber of these nuisance parameters can be orders of magnitude larger than the numberof structural parameters, with a ratio of about 200 applying in the CSTR problem.In our profiling procedure, the nuisance parameter estimates are defined to be implicitfunctions ĉi (θ, σ; λ) of the structural parameters, in the sense that each time θ and σare changed, an inner fitting criterion J(ĉ θ, σ, λ) is re-optimized with respect to ĉ alone.The estimating function ĉi (θ, σ; λ) is regularized by incorporating a penalty term in J thatcontrols the size of the extent that x̂ ĉ0 φ fails to satisfy the differential equation exactly,in a manner specified below. The amount of regularization is controlled by smoothingparameters in vector λ. This process of eliminating the direct impact of nuisance parameterson the fit of the model to the data resembles the common practice of eliminating randomeffect parameters in mixed effect models by marginalization.A data fitting criterion H(θ, σ λ) is then optimized with respect to the structural parameters alone. The dependency of H on (θ, σ) is two-fold: directly, and implicitly throughthe involvement of ĉi (θ, σ; λ) in defining the fit x̂i . Because ĉi (θ, σ; λ) is already regularized, criterion H does not require further regularization, and is a straightforward measureof fit such as error sum of squares, log likelihood or some other measure that is appropriategiven the distribution of the errors eij .While in some applications users may be happy to adjust the values in λ manually,we envisage also the data-driven estimation of λ through the use of a measure F (λ) ofmodel complexity or mean squared error, such as the generalized cross-validation or GCVcriterion often used in least squares spline smoothing. In this event, the vector λ definesa third level of parameters, and leads us to define a parameter cascade in which structuralparameter estimates are in turn defined to be functions θ̂(λ) and σ̂(λ) of regularizationor complexity parameters, and nuisance parameters now also become functions of λ viatheir dependency on structural parameters. Our estimation procedure is, in effect, a multicriterion optimization problem, and we can refer to J, H and F as inner, middle and outercriteria, respectively. We have applied thi
to statistical techniques such as inference and interval estimation. This paper describes a new method that uses noisy data to estimate the parameters defining a system of nonlinear differ-ential equations. The approach is based on a modification of data smoothing methods along with a generalization of profiled estimation.