Transcription
1Paths Through Mathematics and SciencePATHS THROUGHMATHEMATICSAND SCIENCEPatterns and Relationships in High School CoursetakingNCES 2018-118U.S. Department of Education
2Paths Through Mathematics and Science — Patterns and Relationships in High School CoursetakingContentsExecutive Summary3Introduction7Understanding the Results8Pathways Through Mathematics and Science9Relationships Between Mathematics and Science22Technology and Engineering27References31Technical Notes33Appendix A — STEM Course Categories35Appendix B — Supplemental Tables41What is the High School Transcript Study?The High School Transcript Study (HSTS) collects and analyzes transcripts from a representativesample of America’s public and private high school graduates. The study is designed to informthe public about the types of courses that graduates take during high school, how many creditsthey earn, and their grade point averages (GPAs). The HSTS also explores the relationship betweencoursetaking patterns and student achievement, as measured by the National Assessment of Educational Progress (NAEP). High school transcript studies have been conducted periodically for nearlytwo decades, permitting the reporting of trends in coursetaking and GPA, as well as providing information about recent high school graduates. In addition to collecting transcripts, the HSTS collectsstudent information such as gender, graduation status, race/ethnicity, and information about theschools studied.What is the Nation’s Report Card ?The Nation’s Report Card informs the public about the academic achievement of elementary andsecondary students in the United States. Report cards communicate the findings of the NationalAssessment of Educational Progress (NAEP), a continuing and nationally representative measure ofachievement in various subjects over time.Since 1969, NAEP assessments have been conducted periodically in reading, mathematics, science,writing, U.S. history, civics, geography, and other subjects. NAEP collects and reports information onstudent performance at the national, state, and local levels, making the assessment an integral partof our nation’s evaluation of the condition and progress of education. Only academic achievementdata and related background information are collected. The confidentiality of individual studentsand their families is protected.NAEP is a congressionally authorized project of the National Center for Education Statistics(NCES) within the Institute of Education Sciences of the U.S. Department of Education. The Commissioner of Education Statistics is responsible for carrying out the NAEP project. The NationalAssessment Governing Board oversees and sets policy for NAEP.
Paths Through Mathematics and Science — Patterns and Relationships in High School CoursetakingExecutive SummaryMathematics and science are criticalareas of educational focus, seen by manyas particularly important in preparingstudents for a rapidly changing,increasingly competitive global economyand society (BEST 2004; Thomasian2011; Scott 2013). As the policy focus onscience, technology, engineering, andmathematics (STEM) has grown, there isincreasing need for research that describesthe interrelationships between differentquantitative and technical subject areas(Niess 2005; Hansen & Gonzalez 2014; Xin2009). These relationships are important tounderstand because opportunities to learnin one subject may help explain studentopportunities and outcomes in another(Trusty 2002). In addition, understandingcourse trajectories within mathematics,science, and technology provides a portraitof how students might engage withdifferent components of STEM throughoutschool (Xin 2009).This report examines mathematics andscience coursetaking in high school byproviding a description of coursetakingwithin each of the mathematics andscience subject areas across the highschool years, as well as by showing theassociation between early mathematicscoursetaking and subsequent sciencecoursetaking. The report also describescoursetaking in engineering andtechnology, and the associations betweencoursetaking in these subject areas andin mathematics and science. Data onhigh school graduates from the NationalAssessment of Educational Progress’s(NAEP’s) High School Transcript Study(HSTS) serve as the basis for the report.For the purposes of this report, individualcourses taken by students were classifiedinto levels of similar content. For example,algebra I as described in this reportincludes both algebra I and similar coursesat that same level, including unified math1, and algebra and geometry. For moreinformation, see appendix A.3
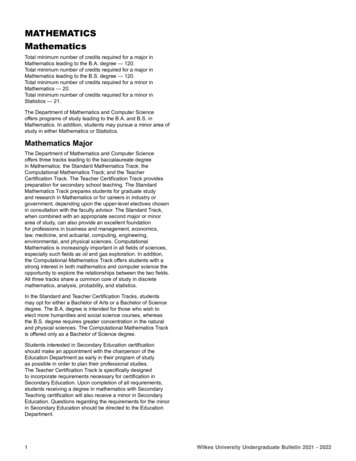
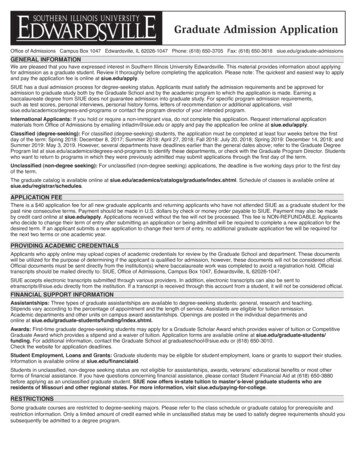
Paths Through Mathematics and Science — Patterns and Relationships in High School CoursetakingPathways through Mathematics and ScienceIn ninth grade, most students took algebra I or a similar-level course; students were increasingly less concentrated in a single course as they progressed through high school.Figure A. Most frequent mathematics courses completed at each grade: 200958%Algebra I46%Geometry39%Algebra II16%15%Other advanced CalculusmathematicsNinth grade Tenth gradeEleventh gradeTwelfth gradeIn ninth grade, more than half of students (58 percent) took algebra I or a course at a similar level(such as unified math 1). In twelfth grade, the two most common course types were other advancedmathematics courses, which include trigonometry, statistics, and probability (16 percent), andcalculus (15 percent) (figure A).More than one quarter (28 percent) of students did not take a mathematics course in twelfth grade.Students completed more than 1,000 distinct 4-year high school mathematicscourse sequences. Ten percent of students each took the two most frequent mathematics sequences. From ninth totwelfth grade, they are: algebra I, geometry, algebra II, and no mathematics; and algebra I, geometry,algebra II, and precalculus.When examining just the first three courses in a 4-year sequence, 33 percent of students took algebraI, geometry, and algebra II in that order.The most frequent overall mathematics pathway (completed by 24 percent of students) was to takealgebra I in the ninth grade and algebra II or a similar-level course (such as unified math 3 or linearalgebra) as their highest course.4
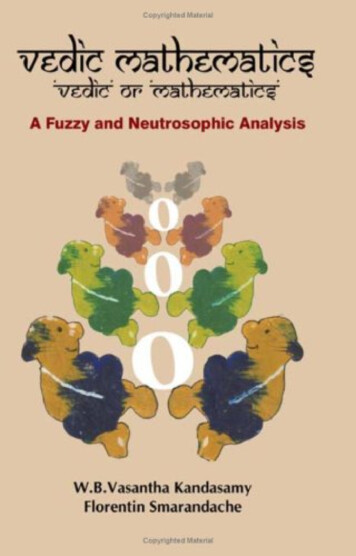
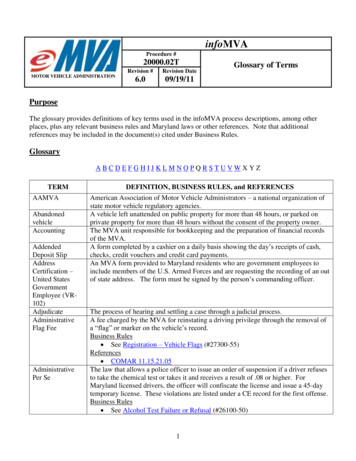
5Paths Through Mathematics and Science — Patterns and Relationships in High School CoursetakingAbout half (51 percent) of tenth-graders earned credit in biology; twelfth-grade coursetakingwas divided among physics, biology, and advanced science.Figure B. Most frequent science courses completed at each grade: 200938%Biology38%SurveyscienceNinth grade51%BiologyTenth ience1Eleventh gradeTwelfth gradeAdvanced science courses include Advanced Placement courses, International Baccalaureate courses, and specialized sciencecourses such as genetics and microbiology.1 About 76 percent of ninth-grade students took one of two science courses: either survey science(38 percent) or biology (38 percent) (figure B).Forty-five percent of students did not earn credit in science in the twelfth grade.Two science pathways were the most frequently completed by students. Fifteen percent of studentsbegan with survey science in the ninth grade and reached chemistry as their highest level sciencecourse. Another 15 percent began with biology and reached physics.Relationships Between Mathematics and ScienceStudents who completed algebra I in the ninth grade completed a range of sciencecourses by the end of high school.Figure C. Percentage of high school graduates who completed algebra I in grade 9 and givenlevel of science by the end of high school: nce1%No biology,chemistry, physics The largest percentage of students (23 percent) took algebra I in the ninth grade and reached chemistry as their highest level course. The second largest percentage of students (16 percent) began withalgebra I and reached physics.
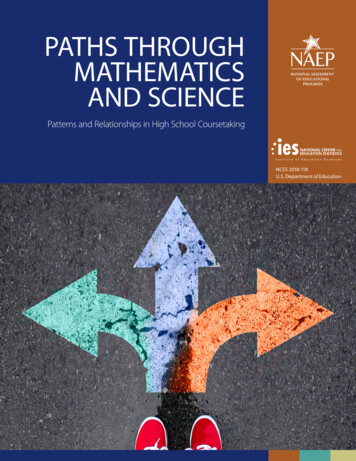
Paths Through Mathematics and Science — Patterns and Relationships in High School CoursetakingHigh-level mathematics and science courses were reached together more frequently than amix of high-level and low-level mathematics and science. Nine percent of students reached both calculus and advanced science such as Advanced Placement orInternational Baccalaureate science courses; in contrast, 2 percent reached calculus and chemistry only(no physics or advanced science courses).Chemistry and physics were often reached with different levels of mathematics courses. The mostcommon combination of highest mathematics and science courses reached was algebra II andchemistry, completed by 14 percent of students. An additional 6 percent of students completedchemistry and other advanced mathematics, and 7 percent completed chemistry and precalculus.Technology and EngineeringStudents who earned no science credit in ninth grade were less likely than their peers to earncredit in technology and engineering courses.Figure D. Percentage of high school graduates who earned credits in technology and engineering, byninth-grade science course taken: 2009Percent earning credit in technology and engineering42%38%12%8%No science Survey scienceEarth scienceBiology,chemistry, or physicsSimilarly, compared with students who completed a course below algebra I or no mathematics in theninth grade, students who completed geometry or higher in the ninth grade took computer sciencemore often (17 vs. 21 percent, respectively).Overall, 93 percent of students attended a school that offered a course in a technology orengineering field. The majority of students attended schools that offered courses in computerscience (85 percent).6
Paths Through Mathematics and Science — Patterns and Relationships in High School CoursetakingIntroductionMathematics and science coursetaking during highAlthough the predominant literature on high schoolschool is associated with subsequent educationalmathematics and science coursetaking focuses onsuccess. Students who take advanced mathemat-individual fields and not on the relationships amongics and science courses in high school have higherthem (Xin 2009; Hansen and Gonzalez 2014), these12th-grade assessment scores in these subjects, arerelationships are important to understand becausemore likely to enroll in college, and are more likely tocoursetaking patterns in one subject may help tocomplete a bachelor’s degree (Bozick and Lauff 2007;explain student trajectories in another. In addition,Chen 2009; Nord et al. 2011). Advanced coursetakingit’s important to better understand the coursetak-in mathematics and science during high school ising sequences within mathematics and science andalso associated with greater labor market returnshow students’ trajectories in these subjects developand higher job satisfaction (Altonji, Blom, andduring high school (Newton 2010; Schneider, Swan-Maghir 2012; National Research Council 2012).son, and Riegle-Crumb 1997). This report examinesMathematics and science education have becomefocal areas in education policy in recent years,especially in the context of preparing students to besuccessful in STEM (science, technology, engineering, and mathematics) careers (U.S. GovernmentAccountability Office 2014; Kuenzi 2008; Thomasian2011). For example, in 2012, the Obama administration had set a goal of increasing by 1 millionthe number of students who earn undergraduatedegrees in STEM fields from 2012–2022 in order tomeet projected workforce needs and enhance theUnited States’ competitiveness in the global economy (Feder 2012). In 2010, the Government Accountability Office estimated that the federal governmentdedicates more than 3 billion to more than 200programs designed to increase STEM learning anddegree attainment (Scott 2013).mathematics and science coursetaking in highschool by providing a description of coursetakingwithin each of the mathematics and science subjectareas across the high school years, as well as byshowing the association between early mathematicscoursetaking and subsequent science coursetaking.Given the recent focus on STEM education, this report also describes coursetaking in engineering andtechnology, and the associations between coursetaking in these subject areas and in mathematicsand science.7
Paths Through Mathematics and Science — Patterns and Relationships in High School CoursetakingUnderstanding the ResultsThis report presents results from the 2009vary by content and level, even among thoseNational Assessment of Educational Progresswith similar titles. Therefore, to compare the(NAEP) High School Transcript Study (HSTS),thousands of transcripts included from schoolswhich includes a nationally representative sam-in the NAEP HSTS sample and to ensure thatple of 37,700 high school graduates represent-each course is uniquely identified, a commoning approximately 3 million 2009 public andcourse coding system, the Classification ofprivate high school students. All of the analysesSecondary School Courses (CSSC), was used.presented in this report only include dataFor the purposes of this report, individualfor graduates who earned regular or honorsCSSC courses were further classified into levelsdiplomas. Graduates who received a specialof similar content, as defined in appendix A.education diploma or certificate of comple-For example, algebra I as described in thistion (or attendance) were not included. Thereport includes both algebra I courses as wellanalytic sample was weighted to represent theas similar courses at that same level, includinghigh school graduating class of 2009, who areunified math 1, and algebra and geometry. Itreferred to as “students” throughout this report.is important to note that course titles do notThe NAEP HSTS applies consistent methodsfor classifying courses. High school coursescapture all of the variation in coursetakingexperience. For example, algebra I in the ninthgrade may be designated as remedial or honors level courses (designations not capturedby NAEP HSTS) and reflect different curricularexperiences (Tyson and Roksa 2016).High schools also vary in the way they assigncourse credits, so the NAEP HSTS also appliedconsistent methods for reporting course credits.Course credits were converted to standardizedCarnegie units or credits, in which a single unitequals 120 hours of classroom time over thecourse of a year. In this report, findings are reported only for courses in which credit was earned.All differences in coursetaking discussed in thisreport are determined to be statistically significant (p .05). No adjustments were made formultiple comparisons. Information on interpreting figure results is provided in the notes beloweach figure. The symbol (*) is used in tables andfigures to indicate selected statistically significant differences. More information about theNAEP HSTS and the analytic methods used inthis report can be found in the Technical Notes.8
Paths Through Mathematics and Science — Patterns and Relationships in High School CoursetakingPathways ThroughMathematics and SciencePrior studies have shown that reaching advanced mathematics and sciencecourses depends on early coursetaking choices (Bozick and Ingels 2008;Stevenson, Schiller, and Schneider 1994; Leow et al. 2004). However, thepathways that students take in mathematics and science through highschool can vary substantially. This section examines mathematics andscience coursetaking separately. Coursetaking in each subject is examinedby grade and as an overall pathway.MathematicsCoursetaking by GradeThe mathematics coursetaking pattern most commonlyschool grades, high school course offerings, graduationexpected for high school students is algebra I in therequirements, and personal interest and motivationninth grade, geometry in the tenth grade, algebra II(Lee et al. 1998; Newton 2010). Therefore, this expect-in the eleventh grade, and higher level courses (i.e.,ed coursetaking pattern may not be common to alltrigonometry, precalculus, or calculus) in the twelfthstudents. This section of the report describes studentgrade (Domina and Saldana 2012). This pattern reflectsmathematics coursetaking patterns by showing thethe progression in focus on specific mathematics topicsdistribution of mathematics courses completed in eachand the cognitive complexity of skills required to com-grade and the grade-to-grade course progressions ofplete tasks within each course. However, the coursesstudents. Note that courses referenced in this sectionthat students take are also influenced by students’represent a set of courses taken at that level—e.g.,mathematics coursetaking and achievement in middle“algebra I” includes both algebra I courses as well as9
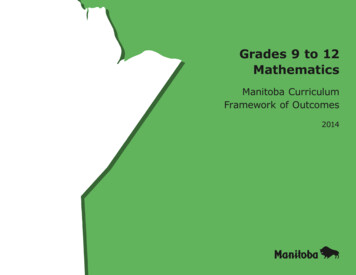
Paths Through Mathematics and Science — Patterns and Relationships in High School CoursetakingIn ninth grade, most students took algebra I or a similar-level course;students were increasingly less concentrated in a single course as theyprogressed through high school.Figure 1. Percentage distribution of high school graduates who earned credits in various mathematicscourses, by grade level: 2009Mathematics #*Other advancedmathematics#*Algebra II6*27*3913*Geometry24*4615*4*Algebra I5814*5*2*Below Algebra I8*4*5*7*No mathematics4*4*7*289101112Grade# Rounds to zero.‡ Reporting standards not met.* Significantly different (p .05) from the following courses in each grade: algebra I in ninth grade, geometry in tenth grade, algebra II in eleventh grade, and nomathematics in twelfth grade.FIGURE READS: 58 percent of students completed algebra I or a similar-level course in ninth grade, more than any other course in that grade.NOTE: The course categories shown in this figure are mutually exclusive. Graduates who earned credit in more than one category during one year are credited withthe highest course they earned credit in that year. “Other advanced mathematics” includes algebra III, trigonometry, statistics, and probability.SOURCE: U.S. Department of Education, Institute of Education Sciences, National Center for Education Statistics, High School Transcript Study (HSTS), 2009.10
Paths Through Mathematics and Science — Patterns and Relationships in High School CoursetakingGrade-to-grade mathematics progressions were more variedbetween higher grades.courses such as math 1, unified, and algebra and ge-Figure 2 shows the percentage of all students who pro-ometry. See appendix A for more information.gressed from one course to another as they moved fromFigure 1 shows the percentage of high school students who completed various mathematics courses bygrade. In the ninth grade, more than half of studentscompleted algebra I or a similar-level course, but bythe twelfth grade, most students did not completea common mathematics course. The majority ofstudents completed an algebra I course (58 percent)in the ninth grade, and the largest percentage ofstudents completed a geometry course in the tenthgrade (46 percent). Thirty-nine percent of students inthe eleventh grade completed an algebra II course.The coursetaking patterns of twelfth-grade studentswere more diverse. For example, the two coursesmost frequently completed in the twelfth grade werecalculus and other advanced mathematics, completedby 15 and 16 percent of students, respectively. However,more than one-quarter of students (28 percent) did notcomplete a mathematics course in the twelfth grade.This may be related to the fact that only 10 states (at thetime of this study) required four credits of mathematicsfor graduation (NCES 2016).one grade to the next. Only those grade-to-grade courseprogressions that include 5 percent or more of studentsare shown (see appendix table B-1 for all progressions).There are some clear progressions in mathematicscoursetaking as students move from one grade to thenext. The most frequent progression from ninth to tenthgrade was algebra I to geometry (42 percent). The mostfrequent progression from tenth to eleventh grade wasgeometry to algebra II (34 percent), followed by algebraII to precalculus (16 percent). However, the grade-tograde progressions of students between the eleventhand twelfth grade are less concentrated. The mostcommon of these progressions are taken by 11 percentto 12 percent of students (12 percent from algebra II tono mathematics and 11 percent from precalculus to calculus). In addition, 11 percent of all students completedalgebra II in the eleventh grade and then progressed toprecalculus in the twelfth grade, and 9 percent completed algebra II and then other advanced mathematics.11
12Paths Through Mathematics and Science — Patterns and Relationships in High School CoursetakingFigure 2. Percentage of high school graduates who progressed to selected mathematics coursesacross grades: thematicsAlgebra IIGeometry 2475*Algebra II2721*6*2714Precalculus 19OtheradvancedmathematicsAlgebra II 3939169*5*13344646Geometry15Geometry 159*4258Algebra I8*Algebra I 141412Nomathematics9101011112812Grade and percent moving from course to course* Significantly different (p .05) from the following course progressions across each grade pair: algebra I to geometry from ninth to tenth grade, geometry toalgebra II from tenth to eleventh grade, and algebra II to no mathematics from eleventh to twelfth grade.FIGURE READS: 42 percent of students completed algebra I or similar-level course in ninth grade followed by geometry or similar-level course in tenth grade.58 percent of ninth-graders completed algebra I and 46 percent of tenth-graders completed geometry.NOTE: The course categories shown in this figure are mutually exclusive. Graduates who earned credit in more than one category during one year are creditedwith the highest course they earned credit in that year. The arrows represent graduates progressing from one course to the next grade’s course, and areshown when the percentage is 5 percent or greater. The full results for mathematics course progressions are shown in appendix table B-1. “Other advancedmathematics” includes algebra III, trigonometry, statistics, and probability.SOURCE: U.S. Department of Education, Institute of Education Sciences, National Center for Education Statistics, High School Transcript Study (HSTS), 2009.
13Paths Through Mathematics and Science — Patterns and Relationships in High School CoursetakingOverallMathematics Pathwaysgebra. When examining just the first 3 courses in theThis section examines the overall course pathwaysalgebra II, in that order (data not shown in table). Ancompleted by students, in two ways. First, it examinesadditional 8 percent started their high school math-the full 4-year mathematics course sequences com-ematics sequence with geometry in the ninth grade,pleted during high school. Next, comparisons of thefollowed by algebra II in the tenth grade, precalculusbeginning and ending points of students’ mathematicsin the eleventh grade, and calculus in the twelfthcoursetaking are presented—that is, the course thatgrade. In addition to these five most frequent 4-yearstudents completed in the ninth grade compared withcourse sequences, students completed another 1,015the highest level course that they completed by the endunique mathematics course sequences during highof high school.school. The data show that there was not one 4-yearTable 1 shows the percentage of students who com-4-year course sequence, one-third (33 percent) of allstudents earned credit in algebra I, geometry, andcourse sequence completed by most students.pleted the most frequent 4-year mathematics courseFigure 3 shows the highest level course completed insequences. About 10 percent each of students earnedhigh school by the ninth-grade mathematics coursescredit in the two most frequent sequences. The orderin which credit was earned. Because the majority ofof those sequences is algebra I, geometry, algebra II,students completed algebra I in the ninth grade (58and no mathematics and algebra I, geometry, algebrapercent, see figure 1), some of the most frequentII, and precalculus. Note that the course names hereoverall pathways involved this group of students.and in other tables and figures refer to multipleThe most frequent overall mathematics pathway forcourses. For example, algebra II, which is listed twicestudents was to take algebra I in the ninth grade andin the last pathway, may involve a two-year se-algebra II as their highest level course (24 percent).quence of algebra II or courses in math 3 or linear al-Completing algebra I in the ninth grade was also aStudents completed more than 1,000 distinct 4-year high schoolmathematics course sequences.Table 1. Percentage distribution of high school graduates who earned credit in various 4-yearmathematics course sequences: 2009Most frequently taken mathematics pathwaysAlgebra I - Geometry - Algebra II - No mathPercent10.1Algebra I - Geometry - Algebra II - Precalculus9.7Geometry - Algebra II - Precalculus - Calculus7.8Algebra I - Geometry - Algebra II - Other advanced mathematics7.4Algebra I - Geometry - Algebra II - Algebra II3.2All other math pathways (1,015 Total)61.8NOTE: Course labels reflect a set of courses at that level, including courses with that specific title. For example, the “Algebra II” labelincludes algebra II courses as well as courses in linear algebra and math 3, unified. See appendix A for more information. “Otheradvanced mathematics” includes algebra III, trigonometry, statistics, and probability. Other math pathways include any othercombination of eight course levels, such as “Geometry – Algebra II – Precalculus – Other advanced mathematics” and “Algebra I –Geometry – Algebra II – Below algebra I.”SOURCE: U.S. Department of Education, Institute of Education Sciences, National Center for Education Statistics, High School TranscriptStudy (HSTS), 2009.
14Paths Through Mathematics and Science — Patterns and Relationships in High School CoursetakingStudents who completed algebra I in the ninth grade subsequentlytook a variety of higher and lower level mathematics courses.pathway to reaching an advanced mathematics course.below algebra I in the ninth grade, or did not take aTen percent of students completed algebra I in themathematics course, and reached a higher level course,ninth grade and reached an advanced mathematicssuch as calculus, precalculus, or an advanced mathe-course below precalculus (e.g., algebra III, trigonome-matics course below precalculus (1 percent combined).try, and probability or statistics) as their highest levelCompleting a course below algebra I or no mathemat-course by the time they graduated. Another 12 percentics in the ninth grade and reaching geometry or belowreached precalculus, and 3 percent reached calculus.was the most frequent lower pathway, one that wasNine percent of students completed algebra I in thecompleted by 7 percent of all students. Similarly, fewerninth grade but did not take a course more rigorousstudents completed geometry or above in the ninththan geometry. This percentage is not statistically dif-grade and did not complete calculus, precalculus, or anferent from the 10 percent of students who reached anadvanced mathematics course below precalculusadvanced mathematics course below precalculus.(3 percent combined) as their highest level course.Rather, 9 percent of students reached precalculus,In contrast, fewer students earned credit in a courseFigure 3. Percentage distribution of high school graduates, by ninth grade mathematics course completedand highest level of mathematics course completed: 2009Highest mathematics level reachedOther advanced mathematicsAlgebra IIGeometry or 10*9*7*3*1*3*3*#*4*#*#!*0Below Algebra I orno mathematicsAlgebra IGeometry or higherNinth-grade mathematics course# Rounds to zero.! Interpret data with caution. The coefficient of variation (CV) for this estimate is 30 percent or greater.* Significantly different (p .05) from algebra I in the ninth-grade plus algebra II as the highest mathematics level reached.FIGURE READS: 24 percent of all high school graduates completed algebra I in the ninth grade and algebra II as their highest course level by the end of highschool, more than took algebra I in the ninth grade and geometry or below as their highest course level.NOTE: The course categories shown in this figure are mutually exclusive. Graduates who earned credit in more than one category are credited with the highestcourse. “Other advanced mathematics” includes algebra III, trigonometry, statistics, and probability.SOURCE: U.S. Department of Education, Institute of Education Sciences, National Center for Education Statistics, High School Transcript Study (HSTS), 2009.
Paths Through Mathematics and Science — Patterns and Relationships in High School Coursetakingand 14 percent reached calculus. Collectively, moreTo provide information about how students movestudents completed these two higher pathways (23through this more limited, but less defined, set of sci-percent) than completed the lower pathways startingence courses, this section presents the distribution ofwith courses below algebra I or no mathematics inscience courses completed in each grade and the mostninth grade (12 percent).frequent grade-to-grade science progressions. NoteScienceCoursetaking by GradeIn contrast to high school mathematics, there is nothat courses referenced in this section represent a setof courses taken at that level—e.g., “survey science”covers courses such as science, unified, and physicalscience. See appendix A for more information.generally agreed-upon hierarchy for high schoolFigure 4 shows the percentage of high schoolscience coursetaking (Schneider, Swanson, and Rie-students who completed various science coursesgle-Crumb 1997). The science coursetaking patternby grade. In comparison to mathematics, scienceconsidered most common for high school
during high school (Newton 2010; Schneider, Swan-son, and Riegle-Crumb 1997). This report examines mathematics and science coursetaking in high school by providing a description of coursetaking within each of the mathematics and science subject areas across the high school years, as well as by showing the association between early mathematics