Transcription
www.projectsmartmap.eu#euSMARTmap7.2 Deliverable (D 7.2) of theH2020 SMART-MapProjectFORMATIVE AND SUMMATIVEEVALUATIONFINAL REPORTSally Randles, Mohammad Hajhashem, Monica Gonzales,Eniko Demeny, Peter Kakuk1
www.projectsmartmap.euContents1. RATIONALE: The Role and Contribution of Formative/SummativeEvaluation .42. METHODOLOGY.123. FINDINGS .434. DISCUSSION AND CONCLUSIONS .555. REFERENCES.606. APPENDICES.627. ACKNOWLEDGEMENTS.96List of Tables:Table 1 – Definition of each actor groupTable 2 – Merged dataset: 6 countries, 3 technologies, and total analyzed bystakeholder categoryTable 3 – Schedule of the SMART-Map Industrial DialoguesTable 4 – Actor categories in the sampleTable 5 – TechnologyTable 6 – De-facto responsible research by actor groupTable 7 – De-facto responsible research by technology areaTable 8 – De-facto responsible innovation by actor groupTable 9 – De-facto responsible innovation by technology areaTable 10 – Awareness and recall of RRI2
www.projectsmartmap.euTable 11 – Awareness and recall of RRI by actor categoryTable 12 – Awareness and recall of RRI by technology areaTable 13 – Awareness and recall of RRI by stakeholder groupTable 14 – Awareness and recall of RRI by technology areaTable 15 – Relevance of EC ‘5 keys’ of RRI by technology areaTable 16 – Benefits for individualsTable 17 – Benefits for society – by technology areaTable 18 – Challenges for individuals – by technology areaTable 19 – Challenges for society – by technology areaTable 20 – Challenges for society – by actor groupList of Figures:Figure 1 – Potential Stakeholders for Precision Medicine (responsible)innovation ecosystem.Figure 2 – Potential Stakeholders for Synthetic Biology (responsible)innovation ecosystem (UK).Figure 3 – SMART-Map Stakeholder BreakdownFigure 4 – Stakeholder Groups per CountryFigure 5 – Coalition of the Willing3
www.projectsmartmap.eu1.RATIONALE: The Role and Contribution ofFormative/Summative Evaluation1.1A brief literature review.The establishment of a specific stream within the field of Evaluation Studies seeking to providedefinitional clarity between formative VERSUS summative evaluation, reaches back at least50 years. Early origins are attributed to Scriven (1967) working in the area of educationperformance. Motivated by the desire to more effectively assess pupils’ learning and out-turnattainments, Scriven’s foundational work provided a framework for discussing thephilosophical and practical distinction between formative and summative evaluation .Similarly, in the context of student performance in N.American Universities, Murray (1980) saysthat formative evaluation is developmental, with the primary objective being to positivelysupport learning through longitudinal monitoring and systematic feed-back to the learners.Whilst summative evaluation by contrast, provides ‘judgements’ by evaluating end-pointperformance against pre-set criteria and has a focus on supporting out-turn decisionmaking.A comparison of summative and formative assessment methods in education highlights thekey differences1:Summative AssessmentFormative AssessmentWhenAt the end of a learning activityDuring a learning activityGoalTo make a decisionTo improve learningFeedbackFinal judgementReturn to the materialFrame of ReferenceSometimes normative (comparingAlways criterion (evaluating studentsa student against all others);according to the same critera)sometimes criterion1Adapted from R. Pregent, Charting your course: How to prepare to teach more effectively, Atwood, 2000.https://en.wikipedia.org/wiki/Formative assessment4
www.projectsmartmap.euIn a different area, evaluating a new and experimental medical intervention, Stetler et al(2006), provide a useful commentary on the contexts that are best suited to formativeevaluation. The authors stress its appropriateness in situations where the project orprogramme being evaluated is novel, experimental, dynamic and unfolding. Formativeevaluation helpfully accompanies such a process and is appropriate as a recursive(learn/evaluate/feedback/adapt/learn) approach. Its primary aim being to help the actorsinvolved in the process to learn and adapt alongside the intervention. They say:Formative Evaluation is:“ a method of judging the worth of a program while the programactivities are forming or happening”It comprises:“ .evaluative activities undertaken during the design and pretestingof programs to guide the design process”As an assessment method it focuses on:“ the internal dynamics and actual operations of a program inorder to understand its strengths and weaknesses and changesthat occur in it over time”It is well suited to situations and research settings where theevaluators are seeking:i)Rapid-response learn and adjust processes during thelength of the projectii)Understanding the nature and significance of the localimplementation settingStetler et al , 2006.5
www.projectsmartmap.euToday, the early origins of formative and summative evaluation studies continue intocontemporary scholarship and practice, with significant attention paid to education policyand practice at all levels, from Bloom’s edited volume (1971) Handbook of Formative andSummative Evaluation of Student Learning; to Guyot (1978) who focuses on businesseducation; to Murray (1980) and Harlen and James (1997). Most recently in the educationcontext, attention moves to different branches and disciplines within education, such asBrophy’s Ed (2019) handbook of assessment, policy and practice in music education.Critical thinking on formative and summative evaluation as an object of study ie ‘evaluatingevaluation’, has extended from its origins in Education, to new policy areas such as medicine,health and social policy (Stetler et al 2006, Greve 2017). And yet, only relatively recently haveissues of comparative evaluation and impact assessment been taken up to evaluateprogrammes in science, research and innovation policy (Edler et al eds., 2016). This extension,and the proliferation of applications to an ever-wider array of public policy areas, can likelybe attributed to greater demand for evidence-based scrutiny of policy programmes, underthe narrative of increased accountability to the tax-payer. It sits against a backdrop ofreductions in government spending at all policy levels: local, regional, national andinternational, and is accompanied by increased use of evaluation instruments at all levels.More recently, a powerful driver is the demand from policy audiences for evidence-based ex-post justification to support policy-spend in particular areas and defend budgets from beingswitched to alternative priorities. By demonstrating positive policy impact to the benefit of thefull range of beneficiaries targeted under a particular instrument, these pressures can in-partbe mitigated. This demonstrable-impact agenda has become a particularly acute policyimperative.Interestingly, the OECD Directorate of Education has also picked up the formative/summativeevaluation debate, producing a critique of the overly polarised representation offormative/summative evaluation methods (Looney, 2011). Looney argues for greaterintegration of formative and summative elements within evaluation study designs. The authorshifts attention to declare that formative evaluation captures bottom-up learning whilstsummative evaluation is appropriate for assessing system-level impact. Summativeevaluation addresses questions of accountability, value for money, and effectiveness inmeeting the original policy objectives. Thus both formative and summative approaches are6
gramme/policy contexts and conditions. Here, the motivation and aims of theevaluators and the funders of the projects and programmes is an important consideration.Under this interpretation, formative and summative elements can be combined or blendedinto study-designs, in a complementary rather than polemic fashion.It is this more ‘blended’ approach that characterises the SMART-Map evaluation.1.2Formative and Summative Evaluation Applied to the SMARTmap project.WP7 of the SMART-Map project implemented a blended formative and summative evaluationprocess, designed to ‘track’ the learning journey of the project across six countries , threeemerging technologies (Precision Medicine, Synthetic Biology, and3D biomed); andlongitudinally across the full 30 months length of the SMART-Map project (1st May 2016 to31stOctober 2018).In line with the ethos of summative evaluation, the project’s own objectives and goals providethe opening criterion against which to evaluate the project’s performance and achievements:The SMART-Map goal: .to define and implement concrete roadmaps for the responsibledevelopment of technologies and services in three key game-changingfields: precision medicine, synthetic biology and 3D printing in biomedicine.http://projectsmartmap.eu/about/ accessed 10 October2018In addition, the evaluation team were keen to establish a ‘Baseline’ position at the beginningof SMART-Maps project. One important aim of the Baseline (quantitative) survey was to7
www.projectsmartmap.eucapture respondents’ understandings and interpretation of responsible research andinnovation before they engaged in the SMART-Map longitudinal process. Lets call this rri, or‘little rri’ as it captures respondents de-facto position on what responsibility in research andinnovation means to them before they are exposed to the European Commission’s definitionof RRI through the instrument of the SMART-Map Industrial Dialogues (IDs). Let’s call this ECpolicy definition of RRI, and indeed other policy-defined frameworks2 of Responsible Researchand Innovation ‘Big RRI’.The dynamic relationship between the participants de-factounderstanding of what it means to practice research and innovation in a responsible way(rri); and their awareness, views and experiences of top-down policy framework of RRIaccording to the European Commission (or the different interpretation of RRI in the UK andelsewhere) we can call rri/RRI.The Baseline survey was implemented with all those who had agreed to attend their respectivecountry- level SMART-Map Industrial Dialogues (IDs), with the Baseline interview taking placearound a week before they actually did so. The primary purpose of this Baseline was toestablish the opening views of the full range of SMART-Map participants, across the differentactor groups (Industry, University researchers, Civil Society, Intermediaries, Funders, andRegulatory & Political), in order to ascertain whether actor-group made a difference toparticipant’s awareness, views, and disposition towards rri/RRI. Likewise, analysing the Baselinesurvey enabled the evaluators to test whether the working context of engagement with thethree technologies made a difference to either the understanding of rri/RRI or theirpredisposition to engage with rri/RRI; comparing opinions before and after the IDs. The resultsof the ‘before’ Baseline survey was reported back to the consortium members and the IDparticipants at the start of each ID event. This before/after approach thus enabled a formative2In the UK, RRI is implemented by the UK Engineering and Physical Sciences Research Council (EPSRC) under the AREA framework: Anticipate, Reflect, Engageand Act. This framework was influenced by the work of UK academics Jack Stilgoe, Richard Owen and Phil Macnaghten who proposed the four-dimensionframework Anticipation, Reflexivity, Inclusivity, Responsiveness (Stilgoe et al 2013) under the term Responsible Innovation (rather than Responsible Researchand Innovation). A longer history of reflection on Responsible Innovation (and the originator of the term) can be attributed to David Guston and colleaguesin the USA, sustained today under the international network funded by the US National Science Foundation, the Virtual Institute of Responsible Innovation(VIRI). Within Europe, leading academic thinkers, hail from the direction of philosophy in Science/Society relations, colleagues at the Universities of Twente(Arie Rip, Stefan Kuhlmann), Delft (Jeroen Van Den Hoven and colleagues), and Waggeningen (where Vincent Blok and colleagues pay particular attentionto the connection with Business Ethics ) and Germany’s Karlsruhe Institute of Technology (Armin Grunwald and colleagues). This work saw a particulartake-off in 2010, and at the same point saw an extension in technology scope, from origins in Nanotechnology. An important actor working from a morepractitioner perspective is the Bassetti Foundation in Italy.8
www.projectsmartmap.eu(learning) step, as the ID participants were able to reflect on what, as a collective, theyunderstood rri/RRI to be, and the challenges, opportunities benefits and costs that rri/RRIpresented. In so-doing, we were able to feed these collective views back to the ID participantsas part of the opening/introductory steps of the ID deliberative process. This process alsoenabled the participants to begin to see, and appreciate, how participants different pre-IDactor-group positions informed the ID deliberations.By returning to a selection of the ID participants after the Industrial Dialogues the Baselinesurvey enabled the evaluation team to undertake ‘before/after’ quantitative telephone orskype interviews in order to evaluate how the experience of participating in the IDs influencedtheir views on rri/RRI and the extent to which the immersive co-constructio experience of theIDs increased awareness and reflection on RRI (partly in terms of highlighted what activitiesthey currently undertook which came under the banner of RRI even if they hadn’t come acrossthe term RRI or RI before).The ‘after’ interviews also ascertained whether respondents were more, or less, positivelydisposed towards rr/RRI after the IDs than they had been before the event, in terms ofawareness and knowledge of the concept, and whether they would be more (or less) likely tothink and act with an eye to RRI pronciples, after the ID workshops than before. The post-IDcall-back interviews therefore aimed to gain some insight into the extent to which concreteand practical immersive participation in the IDs changed participantsviews and theirdisposition towards thinking and acting in a way that was more positively oriented towardsRRI, than they had before, where this criterion of increase in positive orientation to RRI wasconsidered an intermediate positive impact of the project. The ‘after ID’ Baseline interviewswere therefore more summative in orientation.This example from the two stages of the SMART-Map evaluation, ‘before/after the Baseline’,shows how formative and summative elements were blended into the first stage of theSMART-Map evaluation. A similar approach was taken to the qualitative interviews undertakenbefore/after the 2nd stage of SMART-Map, ie to evaluate the learning and experiences of themuch smaller cohorts who participated in the 5- month ‘Tool development pilots’ which tookplace in three of the six countries which had implemented the IDs (Spain on precisionmedicine; Italy on 3D printing in biomed; and UK on synthetic biology).The two-stagedSMART-Map design (the six Industrial Dialogues which prototyped three RRI tools per country,9
www.projectsmartmap.eufollowed by the 5-month development of one tool in each of 3 countries) produced thesystematic methodology and process which became the basis of the three‘ concreteroadmaps for the responsible development of technologies and services in three gamechanging fields ‘ (ie the primary objective and success-criterion of the SMART-Map project.Legacy and multiplier effectsIn addition to the primary goal of the SMART-Map project, to define and implement concreteroadmaps for the responsible development of technologies and services in three gamechanging fields; the project was also keen, as a secondary objective to affect, and provideevidence of transformative change; and to provide a lasting legacy of impact, scale-up andmultiplier effects.Legacy and multiplier effects were anticipated as a project outcome, in the original SMART-Map Description of Action, p.24. as:a) Creating learning material which can be shared, reused and capable to penetrateteaching expertise of other people as well as the SMART-Map participantsthemselves.b) Training involving the SMART-Map Champions.In total, the SMART-Map evaluation uses a rich blend of formative and summativeapproaches, to ‘track’ the experiences, learning, outputs and outcomes, legacy and impact ofthe SMART-Map project, across 6 countries, 3 technologies and multiple participant actorcategories, longitudinally through the 30month journey of the SMART-Map project.It comprises formative evaluation elements to assist learning, and summative elements toenable the comparative evaluation of outputs, outcomes, challenges and benefits, legacy andimpact, to aid decision making. Together, the formative and summative evaluation of theSMART-Map projects enables us to assist the following audiences:10
www.projectsmartmap.euThe SMART-Map consortium : to provide early/recursive learning, feedback and adjustment, by highlightingsuccesses, but also highlighting signs of ambiguity or misunderstandings from the participants perspective inthe projects aims, methods, processes, to enable the project consortium to improve reflexive clarity along theSMART-map journey.The SMART-Map participants : to provide a mode of collective learning and feedback during the course of theproject and to support participants expressing themselves through anonyous ‘voicing’.The funder : to facilitate systematic longitudinal/learning and evaluation of publicly funded projects by trackingthe progress of an EU-funded RRI project, in order to assist policy learning and decision making.The researcher : to demonstrate the use of blended formative and summative evaluation designand techiques, applicable to the contexts of publicly funded, new and experimental interventionsacross a range of reseach and innovation policy areas.In sum our approach can be defined as:Baking recursive learning into the fabric of the project.(Randles et al 2017)11
www.projectsmartmap.eu2. MethodologyThe SMART-Map evaluation used multiple quantitative/qualitative methods across 5 stagesof the evaluation process:Stage1TitleBrief Description of Research Objectives andTimeframeCreating aTo produce a combined data-set of 100 Sept-Oct 2016multiplenetworks, directories, snowballing and otherData-set ofactorseligible forparticipationin dactors per country/technology, using socialmethods to collect contact information.Quota: no less than 50% of the contactsprovided by each country to be industrycontacts.This data-set was used to survey IDparticipants for Stage 2; Baseline ‘Before’.To design and undertake a quantitativeDec 2016 – June 2017 ie twobefore each Industrial Dialogue in order to(Aarhus 16-17 Jan 2017) to‘Baseline’ survey of participants, 1-2 weekscapture participants awareness and views ofrri/RRI before attending the ID.weeks before the first IDtwo weeks before final ID(Hungary, 12-13 June 2017).The Baseline surveymethodology comprised aprogramme of ‘rolling’ telephoneand skype Interviews process ieundertaken in each country withthe ID participants 1-2 weeksbefore the ID.StageBaselineThis comprised a smaller/shorter ‘call-back’Jan 2017- end June 2017.3‘After’interview with a selection of participants inTelephone and skype ‘rolling’the ID, and any changes in their predispositionundertaken in each country withorder to capture their experiences of attendingto rri/RRI as a result of attending the ID.interview programme,ID participants one week after12
www.projectsmartmap.euthe first Aarhus ID to one weekafter the Hungary ID.Stage4Pilots ‘Before’This comprised qualitative interviewsOct 2017- April 2018.consortium members in the three countriesthe 5-month pilots (pilots tookundertaken with ID participants and relevant(Spain, Italy, UK) about to embark on the ‘RRIIe commencing at the start ofplace Nov 2017-March 2018).Tool selection and piloting’ stage of SMARTMap. It sought to establish participants’expectations of the pilot’s process, so thatbefore/after views on the pilots process couldbe gleaned.Stage5Pilots ‘After’A smaller set of qualitative interviews wereApril 2018-May 2018.the three countries (Spain, Italy and UK ) atmonth long pilotsundertaken with key ‘Champion’ participants in3the end of the piloting process in order toIe spanning before/after the 5ascertain their views on the process andoutcomes, (ie what did they expect and didthe piloting experience meet or exceed theirexpectations?). Key participants in eachcountry/technology were also asked whetherand how, the pilots experience had produced,or had the opportunity to produce, lastingtransformative change, legacy and impact,beyond the immediate life-span of theSMART-Map project.3For the Synbio pilot in UK, two practitioner participants from the Hungary ID were also interviewed under Stages 4 & 5 (a small biotech company, and thehead of a research institute in Hungary), in order to maintain the cross-national knowledge exchange and learning dimension in the UK study. In the Italianpilot, the focus of piloting attention was training undertaken through the conduit of the EU project network SYMBIONICA, which wasn’t limited to Italy, thereforerespondents under Stages 4 & 5 on 3D Printing in Biomed included respondenst from beyond Italy.13
www.projectsmartmap.euStage 1 Creating a Data-set of multiple actors eligible for participation in theSMART-Map projectThe SMART-Map consortium leaders for each country were asked to provide an Excelspreadsheet giving contact information for the multiple stakeholder groups (Industry,University researchers, Civil Society, Intermediaries, Funders, Regulators and Political actors)relevant to the particular country/technology focus under their jurisdiction.By way ofguidance, given the industry focus of the SMART-Map project, a quota of 50% industrial actorswas requested of those compiling the list in each country.Table 1, below, provides a working definition of each actor group.Table 1 Definition of each actor group:IndustryNew products and services development andMulti-nationals; Nationals; and SMEs, inc university spin-sales organisations, with a commercial and/orouts.market interest4IntermediaryInterdisciplinary actors who their main task andCovers both formal intermediaries (industry and traderole liaises between other actorsassociations) and de-facto intermediaries. 4UniversityUniversity scientists, both natural and socialFundingEntities in charge of providing finance for differentEg. Research Funding Councils; Charities providing funds toprivate. Seed funds, VCs,Banks; Ethical investment;RegulatoryNational Quality infrastructure (NQI) actorsEg. Testing labs, Quality assurance bodies, StandardsPoliticalPolitical and policy actors, at regional, nationalEg. MPs, MEPs, National government departments and civiland European levels.service.scientistsprojects. They can be public, private or semi-science and research; Venture Capitalists; Business Angels;development organizationsWe need to crucially consider individuals who sit astride (and indeed in both) of two or more categories: ’two-hatted’ individuals, eg scientists who alsowork in spin-out companies; actors in one category (scientists, companies) who are also have policy-influencingor political roles; who have highreputation and legitimacy to bridge two communities. For the purpose of our Stakeholder boxes we have put them in a ‘first/main’ category according totheir self-description. But this is conceptually flawed and in one or two examples directly flies in the face of how they wish to be categorised (as sitting withintwo or astride two or more categories). The asymmetric influence of these individuals in the system also makes it conceptually inappropriate to put themin one category. A ‘network’ mapping would be a better way to capture their intermediary role and its significance as boundary -spanning actors. See theclassic text by Star and Griesemer (1989) on Boundary Objects. These observations are material to our conceptual work questioning the existence andconceptualisation of ‘Responsible Innovation (eco)systems’ (See SMART-Map deliverable report D7.1).14
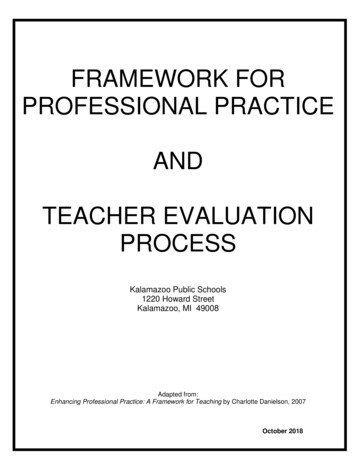
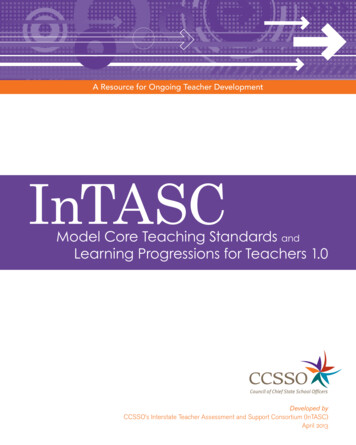
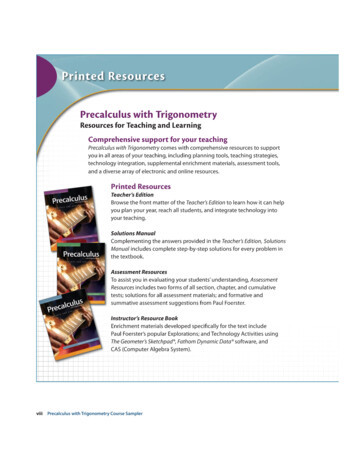
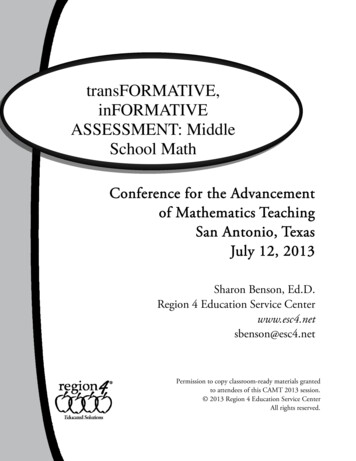
www.projectsmartmap.euCivil entativeEg- NGOs, charities, lobbyingand campaigning forconsumers, environment, health and patients’ groups,public participation in science, civil society expertise inresponsible governance of new and emerging technologiesetc.By way of a guide, each country first produced a ‘mapping’ of the actor-landscape relevantto their country/technology. Below provides the actor mapping for Precision Medicine(responsible) innovation ecosystem, ie all actors, including civil society actors.Figure 1 - Actor Mapping for Precision Medicine (Source: Kaisa Granquist, ZSI)A further depiction of a potential actor-mapping for Synbio (responsible) innovationecosystem in UK is provided below (Figure 2, source: Ros Le Feuvre, University ofManchester).15
www.projectsmartmap.euUsing these guidance mappings as templates, the amalgamated contact lists provided byeach country translates into the total SMART-Map dataset used in Stage 1 of the SMART-Mapevaluation.16
www.projectsmartmap.euThe combined Stakeholder datasetBelow are presented tables and graphs which display the key descriptive statistics of the merged 6 country dataset analysis (where the totalnumber of entries N 738). Table 2 Merged dataset: 6 countries, 3 technologies, and total analyzed by Stakeholder nSP94617FundingDK183112055GE3D PrintingIT81352310in MedicineGEIT3D printing in .812.115.517.05.010.811.415.713.21
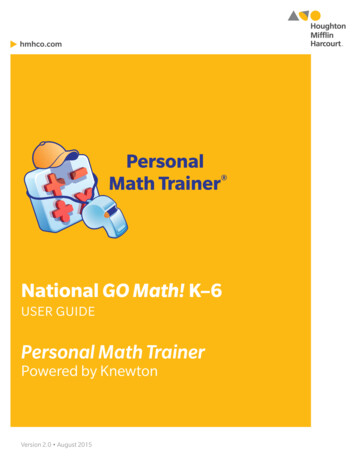
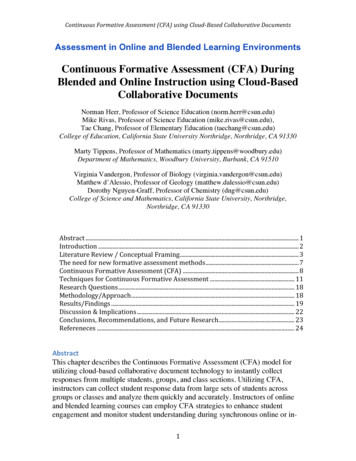
www.projectsmartmap.euFig 3, below provides a breakdown of the SMART-Map Combined Dataset by actor type.Fig 3 : SMART-Map ally, Fig 4 provides the dataset analysed by country, technology and actor groups innumbers where N 738.Fig 4 : Stakeholder Groups perCountry (numbers). N T18
www.projectsmartmap.euStage 2 – the Baseline ‘Before’ surveyRecruiting strategy for survey participantsThe Baseline survey was ‘wrapped’ around the Industrial Dialogues (IDs). The first of the twoBaseline surveys, ie Baseline ‘Before’ took place on a ‘rolling’ schedule, one to two weeks beforeeach ID took place. The six IDs took place at approximately monthly intervals, from January2017 to June 2017. The survey comprised telephone or skype interviews with a selection of theID participants (those who responded to our requests to participate in an interview). Interviewswere conducted in the respondents’ mother-tongue in Italy and Spain ie Italian for the MilanID; Spanish for the Valencia ID. Responses were translated into English by the interviewer. Theother four IDs were conducted in English.The same applied to Stage 2: Baseline ‘After’ interviews.Each ID lasted 1.5days, to the schedule detailed below:Table 3 – Schedule of the SMART-Map Industrial DialoguesCityTechnology FocusDatesAarhus (DK)Precision Medicine16-17 January 2017Munich (GE)3D Printing in Biomedical6-7 Feb 2017fieldManchester (UK)Synthetic Biology9-10 March 2017Valencia (SP)Precision Medicine5-6 April 2017Milan (IT)3D Printing in Biomedical10-11 May 2017Budapest (HU)Synthetic Biologyfield12-13 June2017In fact, this was a different recruitment methodology to that which was originally conceived.Our original plan had been to undertake interviews following a quota sampling procedurefrom the ‘stakeholder mapping’ contact list produced at Stage 1 above. However the rate of19
www.projectsmartmap.eurefusal to participate in an interview was very high indeed. In addition, we felt the reasonsgiven for refusal were not reliable (lack of interest, lack of time, or the view that the projectwas not relevant to them). In addition, as the Hungarian case exemplified, a number ofpotential industry respondents reported that their organisation was a subsidiary of an HQlocated in a different country. Decision making was therefore not done locally and for thisreason respondents felt it was not helpful or appropriate for them to participate. The highrefusal rates were particularly true of industry respondents, and was our first indication thatwe were struggling with the concept ‘
It is this more 'blended' approach that characterises the SMART-Map evaluation. 1.2 Formative and Summative Evaluation Applied to the SMART-map project. WP7 of the SMART-Map project implemented a blended formative and summative evaluation process, designed to 'track' the learning journey of the project across six countries , three