Transcription
COMPOUND COSTS:HOW CLIMATECHANGE IS DAMAGINGAUSTRALIA’S ECONOMYCLIMATECOUNCIL.ORG.AU
Thank you forsupporting theClimate Council.The Climate Council is an independent, crowd-funded organisationproviding quality information on climate change to the Australian public.Published by the Climate Council of Australia LimitedISBN:978-1-925573-96-1 (print)978-1-925573-97-8 (digital)Professor Will SteffenClimate Councillor Climate Council of Australia Ltd 2019This work is copyright the Climate Council of Australia Ltd. All materialcontained in this work is copyright the Climate Council of Australia Ltd exceptwhere a third party source is indicated.Climate Council of Australia Ltd copyright material is licensed under theCreative Commons Attribution 3.0 Australia License. To view a copy of thislicense visit http://creativecommons.org.au.Dr Karl MallonDirector of Science andSystems, XDI Pty Ltd.You are free to copy, communicate and adapt the Climate Council of AustraliaLtd copyright material so long as you attribute the ClimateCouncil of Australia Ltd and the authors in the following manner:Compound Costs: How climate change is damaging Australia’s economy.Authors: Will Steffen, Karl Mallon, Tom Kompas, Annika Dean and Martin Rice.Reviewers: Mark Stafford Smith.Professor Tom KompasEnvironmental Economist,School of Biosciences andthe School of Ecosystem andForest Sciences, Universityof Melbourne—Cover image: ‘Townsville Floods’ by Andrew Rankin. Australian AssociatedPress.This report is printed on 100% recycled paper.Dr Annika DeanSenior cil.org.auDr Martin RiceHead of Research
CLIMATE COUNCILContentsKey Findings. ii1.Introduction.12.Modelling Results. 52.12.2Impacts on insurance costs and property value in Australia6Insurance costs will increase6Costs will be highly uneven7Relative property values will decrease10It’s going to get uncomfortably hot10Impacts of rising temperatures on agricultural and labour productivity11Case study: The cost of the 2009 heatwave across southeastern Australia12Case study: Costs of climate change to the food system14Case study: Costs of climate change on infrastructure173.Conclusion and Recommendations. 194.Annex A: Methods and assumptions of the agricultural and labour productivity analysis.215.Annex B: Methods and assumptions of the property impacts analysis. 23References. 25Image Credits. 26i
iiCOMPOUND COSTS:HOW CLIMATE CHANGE IS DAMAGING AUSTRALIA’S ECONOMYKey Findings21Climate change is a majorthreat to Australia’s financialstability, and poses substantialsystemic economic risks.›› Direct macroeconomicshocks from climate change,including reduced agriculturalyields, damage to propertyand infrastructure andcommodity price hikes, arelikely to lead to painful marketcorrections and could triggerserious financial instability inAustralia and the region.›› Australia’s financial regulatorsacknowledge that climatechange is now a centralconcern for the economyand financial stability.Detailed new modelling,based on the FederalGovernment’s currentapproach to climate change,finds that the economicdamage to Australia’sproperty and agriculturalsectors will be verysignificant.›› Australia’s greenhouse gasemissions have been risingfor four years and we are noton track to meet our weak2030 emissions reductiontarget. If the world followedAustralia’s approach we wouldbe on track for at least 3-4 C ofglobal warming, which wouldhave catastrophic economicconsequences.3The property market isexpected to lose 571 billion invalue by 2030 due to climatechange and extreme weather,and will continue to lose valuein the coming decades ifemissions remain high.›› One in every 19 propertyowners face the prospect ofinsurance premiums that willbe effectively unaffordable by2030 (costing 1% or more of theproperty value per year).›› Some Australians will be acutelyand catastrophically affected.Low-lying properties near riversand coastlines are particularly atrisk, with flood risks increasingprogressively and coastalinundation risks emerging as amajor threat around 2050.›› Certain events which are likelyto become more commonbecause of climate change arenot covered by commercialinsurance, including coastalinundation and erosion.›› More than 226 billion incommercial, industrial, road,rail, and residential assets willbe at risk from sea level risealone by 2100, if greenhousegas emissions continue athigh levels.
KEY FINDINGS4Extreme events like droughts,heatwaves, cyclones andfloods have an impacton agriculture and foodproduction; this is alreadyaffecting Australia’s economyand will cost us much morein the future.›› Climate change is increasingthe severity and intensity ofextreme weather events inAustralia.›› On current trends, theaccumulated loss of wealthdue to reduced agriculturalproductivity and labourproductivity as a result ofclimate change is projectedto exceed 19 billion by 2030, 211 billion by 2050 and 4trillion by 2100.›› By 2050, climate change isprojected to halve the irrigatedagricultural output of theMurray-Darling Basin region,which currently accounts for50% of Australia’s irrigatedagricultural output by value(about 7.2 billion per year).iii5›› By 2090, wheat yields on the4,200 family farms in WA thatproduce half of Australia’swheat are projected to fallby 41-49% if greenhouse gasemissions remain high.›› Previous severe droughtshave reduced Australia’s GrossDomestic Product by around1%; estimates suggest thatincreasing drought frequencyand impacts in the future mayreduce GDP by 1% every year.The severe costs of climatechange outlined in this reportare not inevitable. To avoidthe costs of climate changeincreasing exponentially,greenhouse gas emissionsmust decline to net zeroemissions before 2050.Investments in resilience andadaptation will be essential toreduce or prevent losses in thecoming decades.›› Increasing resilience toextreme weather and climatechange should become a keycomponent of urban planning,infrastructure design andbuilding standards.›› Buildings and infrastructuremust be built to withstandfuture climate hazards and tofacilitate the transition to a netzero emissions economy.›› A credible national climatepolicy is needed to safeguardour economy by reducing thedirect costs of climate change,and avoiding economic risksassociated with a sudden,disruptive or disorderlytransition to net zero emissions.climatecouncil.org.au
1COMPOUND COSTS:HOW CLIMATE CHANGE IS DAMAGING AUSTRALIA’S ECONOMY1.IntroductionThere are few forces affecting theAustralian economy that can matchthe scale, persistence and systemicrisk associated with climate change.1Australia’s financial regulators haverecently made a call for action to dealwith climate change, with the ReserveBank of Australia, the AustralianPrudential Regulation Authorityand the Australian Securities andInvestment Commission citingrisks posed by climate change asa central concern for the economyand financial stability. As theDeputy Governor of the ReserveBank of Australia noted, the risksthat climate change poses to theAustralian economy are “first order”and have knock-on implications formacroeconomic policy (Debelle 2019).Australia’s financialregulators haveacknowledged thatclimate changeposes significantand systemic risksto our economy.Australia has always been a land of droughtsand flooding rains. However, in the past,extreme weather events were cyclicalaround a stable average, allowing enoughtime for recovery between events. Now,climate change is driving a trend change,increasing both the frequency and severityof many extreme weather events (ClimateCouncil 2019). This is shrinking the recoverytimes between events, and increasingthe probability of simultaneous events inmultiple locations. Climate change is alsoincreasing the probability of compoundevents, where two or more extreme weatherevents combine to produce impacts thatare worse than the effects of each eventindependently (e.g. coincident droughts andheatwaves worsening bushfires).There are many examples of extreme weatherand climate events creating supply shocksthat reduce output, cause unemployment andincrease prices and inflation. The agriculturesector is particularly sensitive to climateand weather, so despite being a relativelysmall sector (around 2-3% of Gross DomesticProduct or GDP), the impacts of drought areapparent in aggregate GDP. Previous severedroughts have reduced economic growthby about 1% (e.g. the 2002-03 drought andthe 1994-95 drought) (Commonwealth ofAustralia 2005). Extreme weather eventscan also generate supply shocks that pushup commodity prices and increase inflation– for instance Tropical Cyclone Yasi droveup banana prices, boosting inflation by justunder 1% (Debelle 2019). Inflation returnedto normal the following season, but theprospect of near permanent supply shocksdriven by climate change poses threatsSystemic risks are imposed by interlinkages and interdependencies within a system, where the failure of a single component orcluster can cause a cascading failure, resulting in system instability and potential collapse.1
CHAPTER 01INTRODUCTIONIf climate change continues unabated,extreme weather and climate events willincreasingly cause economic shocks thatwill cascade through the economy.to economic resilience. Climate changecan also erode the productive capacity ofthe economy. For instance, funds may bediverted towards recovery and away frominvestments in new technology, machineryor research, leading to long-term reductionsin productivity growth.Climate change also presents broad risksto other sectors. Direct macroeconomicshocks will arise from the impacts ofclimate change on housing, temporary orpermanent contractions of some industriesand subsequent reductions in employment,commodity price adjustments, and damagesand disruption to critical infrastructurethat provide essential services and facilitateeconomic activity. Australia’s economywill also continue to be affected by climatechange impacts on our trading partners.There has been recent media coverage andcommentary on modelling that looks at thecosts of deeper emissions reductions thanthe current Federal Government target of26-28% by 2030 on 2005 levels. It is pointlessto do this without actually looking at thecosts of inaction. Studies such as the GarnautReview (2008) and the Stern Review (2006)clearly show that the costs of inaction greatlyoutweigh the costs of action. Over the pastfive years, the Federal Government hassquandered opportunities to tackle climatechange, putting Australian lives, our well-2being and the economy at risk. The longer wedelay swift and decisive action, the more itwill cost the Australian economy.The modelling done for this report2 showsthat climate change is likely to result in sharpadjustments in residential property valuesin some areas. The total estimated damagerelated loss of property value – excludingany disruptions to productivity – is expectedto rise to 571 billion by 2030, 611 billion by2050 and 770 billion by 2100.These costs are likely to be highlyconcentrated on about 5-6% of properties,and will represent an enormous cost forthose affected, with likely flow-on effects tothe whole economy, as governments becomethe insurers of last resort. The annualaverage risk costs of extreme weather andclimate change to properties is projected torise to 91 billion per year in 2050 and 117billion per year in 2100. These will be feltthrough increased insurance costs and willpredominantly impact the same householdsthat will experience the steepest losses inproperty values.Failure to tackle climate change will alsocome at a cost to agriculture and labourproductivity. The cumulative loss of wealth forAustralia from the impacts of climate changeon agricultural and labour productivity isexpected to reach 4.2 trillion by 2100.The methods and assumptions behind the modelling can be found in Annex A and B at the back of this report.2
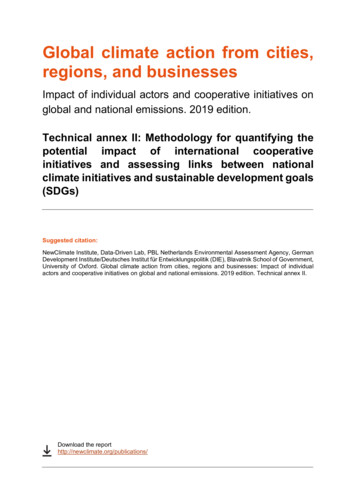
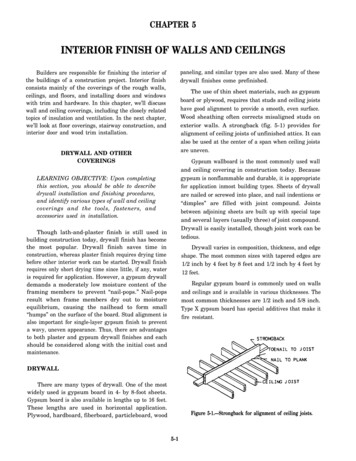
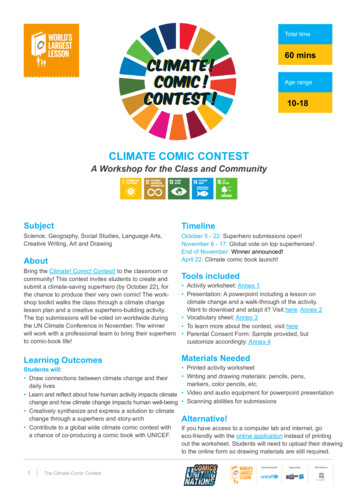
Figure 1: Australian properties have been battered by powerful storms in the past; as climate change intensifies propertyvalue loss could reach 571 billion by 2030. Impacts like coastal inundation are not covered by insurance policies.The costs explored here represent a partialsnapshot of some of the direct costs ofclimate change in a business-as-usualemissions scenario (i.e. if greenhouse gasemissions continue unabated). Three casestudies are also presented to show thesystemic nature of climate change costs, andhow they may cascade through the economy,affecting households, governments andbusinesses. There are also many verysignificant costs of climate change thatcannot be adequately captured through aneconomic lens, and have not been exploredin this report. These include loss of life,health and wellbeing, reduced safety, andloss of species and biodiversity. 3 This reportfocuses on synthesising systemic impactsof climate change on the economy that havepreviously been very partially estimated, orhave been greatly underestimated.Decisions taken now will have major impactson future climate trends and impacts. Untilaround 2050, a considerable increase inclimate impacts is locked in from greenhousegas emissions that have already been released.Therefore, it is important to ensure that wellplanned adaptation is underway at all levelsnow, within a strong framework that should befacilitated by government, but also involve theprivate sector. It is also important to acceleratethe transition to a net zero emissionseconomy by 2050 at the latest and preferablymuch earlier, or else the costs of adaptationand residual loss and damage will increaserapidly after 2050. Steering the economyto net zero emissions through stable andcredible policies is crucial for managing boththe physical risks from climate change andthe risks and opportunities associated withdecarbonisation of the economy.Climate change and extreme weather areprojected to reduce property values by 571 billion by 2030, 611 billion by 2050and 770 billion by 2100.Some costs to biodiversity have direct and quantifiable impacts. For instance, loss of the Great Barrier Reef due to climatechange would mean loss of the reef’s annual economic contribution of 6.4 billion per year (Deloitte 2017a). In other ways, theGreat Barrier Reef is arguably priceless.3
CHAPTER 01INTRODUCTIONCumulative damages to agricultural andlabour productivity from climate changeare expected to reach 4.2 trillion by 2100.The Climate Council of Australiacommissioned new modelling to inform theresults outlined in this report. The modellingwas conducted in two parts. First, damagesfrom climate change to agriculturalproductivity and labour productivity weremodelled using the Global Trade AnalysisProject Computable General EquilibriumModel. The potential economic damagesfrom climate change in this computationalplatform were limited principally to reducedagricultural and labour productivity, loss ofarable land due to sea level rise and somehealth impacts. Results were obtainedat various global temperature increases,and are presented in this report as the netpresent value of cumulative damages from2017 at different points in time. More detailson the methods can be found in Annex A.To incorporate impacts of climate changeon the Australian property sector, a separateanalysis was undertaken by the CrossDependency Initiative (XDI). This includedan assessment of the 15 million addresses inAustralia, with each property tested againstsix extreme weather hazards – flood, coastalinundation, bushfire, wind storms, heatwaves and soil subsidence. The number ofproperties was assumed to remain stablein the future, but the influence of climatechange on the six hazards was modelledto assess annual average risk costs (used toinform insurance premiums) and propertyvalue losses. This assessment was one of thelargest climate change risk assessments ofproperty in Australia. See Annex B for moredetails on methods and assumptions.Failure to act would result in significanteconomic damages. The FederalGovernment must implement credibleclimate policies that set us on a coursefor net zero emissions before 2050.4
5COMPOUND COSTS:HOW CLIMATE CHANGE IS DAMAGING AUSTRALIA’S ECONOMY2. Modelling ResultsThe modelling scenario adopted inthis report is one that assumes globalgreenhouse gas emissions continue torise on a business-as-usual trajectory.This scenario was chosen as it is the futurethat would eventuate if the world were toadopt similarly dismal levels of policy effortto Australia in addressing climate change.Australia’s greenhouse gas emissions haverisen over the past four consecutive years,and are set to continue to rise based oncurrent policies. If the world were to adopta similar policy trajectory to Australia, theglobal average temperature would increaseby between 3 C and 4 C by the end of thiscentury (CAT 2019), which is aligned withthe highest emissions scenario outlined bythe Intergovernmental Panel on ClimateChange (IPCC) and used in this report.The purpose of highlighting the highemissions scenario is to illustrate thatthere are substantial costs associated withinaction on climate change. These costs arenot inevitable. Many future costs could beavoided through credible policies that drivedown greenhouse gas emissions to netzero by 2050 or earlier, and increase climatechange resilience across society.
CHAPTER 02MODELLING RESULTS2.1Impacts on insurancecosts and propertyvalue in AustraliaThe property sector has a larger “footprint”on the Australian economy than any otherindustry (AEC Group 2015). The market forresidential properties is valued at around 6.6 trillion (significantly larger than theAustralian Stock Exchange and aboutthreefold larger than the superannuationindustry). Activities involved in facilitatingthe property industry (e.g. construction,architecture and engineering, banking,insurance and property and businessservices) directly contribute around 11.5%to GDP (AEC Group 2015). The propertyindustry also contributes around 16%to revenues of governments at all levelsvia taxes, rates and levees (AEC Group2015). The industry employs around 1.17million Australians and at least 14.1 millionAustralians also have a stake in the industryvia their super funds (AEC Group 2015).INSURANCE COSTS WILL INCREASEThe probability of extreme weather events isincreasing due to climate change, putting theeconomy at risk. Reinsurance companies likeMunich RE have stated clearly that insurerscannot keep using the past as a guide to thefuture (Munich RE 2019). In the absence ofadaptation, it is inevitable that insurancepremiums will have to rise. Currently, notall hazards are covered by commercialinsurance. Hazards such as bushfires,riverine flooding and storm damage aregenerally covered, but events such as coastalinundation, erosion, landslip and subsidenceare all generally excluded, which meanspeople and business are effectively selfinsured against these hazards (or insured bythe taxpayer). For example, 3% of propertiesare built on soils that can contract and breakfoundations in a severe drought. Ideally theseimportant hazards will become includedin standard policies, though this wouldalso require higher insurance premiums.Assuming that these excluded hazards areincorporated into insurance policies, andaccounting for the increased risks associatedwith hazards that are currently generallycovered, modelling undertaken by XDIestimates that the annual average cost ofdamage from extreme weather and climatehazards to properties will rise to 85 billionin 2030, 91 billion in 2050 and 117 billion in2100 (see Table 1).6
7COMPOUND COSTS:HOW CLIMATE CHANGE IS DAMAGING AUSTRALIA’S ECONOMYTable 1: Annual average risks costs (used to inform insurance premiums) in 2030, 2050 and 2100.203020502100Total annual average risk cost 85 billion 91 billion 117 billionPercentage of properties over 1% risk cost threshold5.3%5.5%6.6%Number of houses over 1% risk cost threshold795,000 (1 in 19)825,000 (1 in 18)990,000 (1 in 15)COSTS WILL BE HIGHLY UNEVENThe major impact of this increased costwill be concentrated on about 5-6%of properties, which will experienceaverage annual risk costs (used to informthe pricing of insurance premiums) thatare effectively unaffordable (costing theequivalent to 1% or more of the propertyvalue per annum). This would be theequivalent of a person with a homeworth 500,000 having to set asidemore than 5,000 every year for extremeweather losses for the building alone(not including contents, consequentiallosses, and normal insurance items likehouse fires and burglary).If we don’t rapidlyreduce greenhousegas emissions, by 2030about 1 in every 19properties could haveeffectively unaffordableinsurance premiums.The results indicate that by 2030 about 1 inevery 19 properties is projected to fall intothis category, by 2050 about 1 in every 18properties, and by 2100 about 1 in every 15properties is projected to fall into this category(see Table 1). The properties in this categoryare not spread out evenly, but are insteadconcentrated in areas that are highly exposedto current and future hazards – like flooding,bushfires and coastal inundation – and thatwere not built to withstand such events.These figures assume that the type, numberand location of properties remains constantover time. This means that these figures arehighly conservative. Building new propertiesin areas exposed to current and emerginghazards could substantially increase thenumber of at-risk properties. The LocalGovernment Areas (LGAs) with the highestnumber of impacted properties tend to beurban LGAs that have a higher number ofproperties in total. To convey a normalisedpicture of the most impacted LGAs, Table2 displays the top ten LGAs in each stateand territory with the highest percentage ofimpacted properties by 2100, as a proportionof all properties in each LGA.
CHAPTER 02MODELLING RESULTSTable 2: Top ten most impacted LGAs in each state and territory, by the percentage of impacted properties. Impactedproperties are defined as those where the annual average risk cost is 1% or more of the property value by 2100.Rank NSWVICQLDSATASWANT1Moree PlainsFlood; SoilSwan HillFloodGold CoastFlood;InundationMid scoyneFlood;BushfireRoper GulfFlood; Soil2CoonambleFlood; SoilCampaspeFloodIpswichFlood; ushfireCentral DesertFlood3BrewarrinaFlood; SoilGannawarraFloodSunshineCoastInundationThe CoorongFlood;InundationWest CoastFloodBeverleyFloodVictoria DalyFlood4BoganFlood; SoilBenallaFloodToowoombaMixedNaracoorteand LucindaleFloodBreak landsFloodYorkFloodAlice SpringsFlood6BourkeFlood; SoilMoiraFloodWesternDownsFlood; SoilKingstonFlood;InundationKing IslandFloodMooraFloodUnincorporatedNT Flood;Inundation7InverellFlood; lood;InundationHuon ixed8NarrabriFlood; SoilHorshamFlood; SoilTownsvilleFlood;InundationMurray BridgeFlood;InundationDevonportFloodEast ton t ArnhemMixed10WalgettFlood; SoilHindmarshFlood; SoilFraser CoastInundationBarossaFloodMeanderValleyFloodPort HedlandInundationDarwinInundation8
9COMPOUND COSTS:HOW CLIMATE CHANGE IS DAMAGING AUSTRALIA’S ECONOMYQueensland has a disproportionate numberof LGAs that will be highly impacted byclimate change and extreme weather. InQueensland, 64% of LGAs have 10% or moreof their properties with an annual averagerisk cost that is 1% or more of the propertyvalue by 2100. In the Northern Territory,24% of the LGAs meet this definition andin New South Wales 28% of LGAs meet thisdefinition. Table 3 displays these figures forall states and territories.Table 3: Percentage of impacted* LGAs out to 2100 in each state and territory.203020502100New South South Australia8%8%10%Western Australia11%11%12%Tasmania3%3%3%Northern Territory24%24%24%Australian Capital TerritoryNegligibleNegligibleNegligible*An impacted LGA is classified as one where 10% or more of the properties will have an annual average risk cost that is 1% ormore of the property value by 2100.
CHAPTER 02MODELLING RESULTSRELATIVE PROPERTYVALUES WILL DECREASEIT’S GOING TO GETUNCOMFORTABLY HOTHousehold budgets are not elastic. Extramoney that is spent on insurance mustcome from spending less on something else.When considering lending for mortgages,banks look carefully at the annual costsof the borrower, including the cost ofinsurance. Therefore, banks in principlewill have to lend less for houses with higherinsurance costs. Thus, for two equivalenthomes, the one that is more exposed andvulnerable to climate exacerbated extremeweather impacts is expected to decrease invalue compared to less affected properties.There is some evidence that climate changeis already altering property values in partsof the United States (such as Miami), wherehigher elevation properties are essentiallyworth more now, and increasingly will beworth more in the future (Keenan et al.2018). Based on research commissionedfrom XDI for this report, the total estimateddamage-related loss of property value –excluding any disruptions to productivityor physical damage or replacement costs ofbuildings – is expected to rise to 611 billionby 2050 and 770 billion by 2100.The number of days which are dangerouslyhot has been increasing since the 1950s.These are days when people experienceheat stress, which can result in respiratoryand cardiovascular illness and evenpremature death. The design of buildingshas a strong impact on the cooling needs ofoccupants, and most existing dwellings inAustralia are not able to adequately protectpeople from severe heatwaves. There aresome known approaches for reducingheat gain in existing dwellings, but asthese are not effective in all situations, airconditioning may be required to reducethe heat stress of occupants. In general,investing in improving the thermalcomfort of existing dwellings that areunable to protect people from heatwavesis a cost-effective preventative healthmeasure. The average cost of a singleacute hospital admission costs the healthsystem approximately 5,171 in Australia(IHPA 2019). When the health benefits areconsidered alongside the social, financialand environmental benefits of moresustainable housing, there is a clear case forinvesting in thermal and energy efficiencyupgrades in existing buildings. For newbuildings, significant opportunities exist tostrengthen building codes to cost-efficientlyimprove energy and thermal efficiencyperformance whilst protecting occupantsfrom increased heat stress. Urban planningand design can also significantly influenceheat build-up in urban areas. Designingurban spaces to take consideration of heatgain in the first instance is much less costlythan retrofitting spaces retrospectively.Table 4: Damage-related loss in property valuesexpected in 2030, 2050 and 2100.203020502100 571 billion 611 billion 770 billionInvesting in improving energy and thermalefficiency of new and existing buildings hasconsiderable economic and health benefits.10
11COMPOUND COSTS:HOW CLIMATE CHANGE IS DAMAGING AUSTRALIA’S ECONOMY2.2 Impacts of risingtemperatures on agriculturaland labour productivityAllowing greenhouse gas emissions tocontinue on a business-as-usual trajectoryis not an economically and sociallyresponsible option for Australia. If thiswere to occur, cumulative damages fromreduced agricultural and labour productivity(including via some human health effects)would reach 19 billion by 2030 and 211billion by 2050. Damages would ramp updramatically after 2050, with cumulativeloss of wealth between now and 2100reaching 4.2 trillion or roughly 61,000per person on average. This is assumingthat the Australian population increasesto over 60 million in 2100 (i.e. a smallerpopulation increase would naturally implyan increase in per person damages). Thesefigures only account for damages arisingfrom reduced agricultural and labourproductivity, loss of arable land due to sealevel rise and some health impacts. Lossesfrom riverine flooding, bushfires and otherextreme weather events such as storms andtropical cyclones – which are all projectedto rise in frequency and/or severity becauseof climate change, and are expected tosubstantially increase economic losses – arenot included in these figures.Neighbouring countries, many of whom aremajor trading partners with Australia, areprojected to experience much more severedamages than Australia. Total cumulativedamages to 2100 in Southeast Asia aremore than 16
increasing the probability of compound events, where two or more extreme weather events combine to produce impacts that are worse than the effects of each event independently (e.g. coincident droughts and heatwaves worsening bushfires). There are many examples of extreme weather and climate events creating supply shocks