Transcription
ANALYSIS OF LEBANON’SEXTERNAL SECTORBankmed - Market & Economic Research Division
SPECIAL REPORTAnalysis of Lebanon’s External Sector - September 2016Table of ContentsPart I: Global Trade3Merchandise Trade5Merchandise Exports5Merchandise Imports8Commodities Dynamics11Trade Services12Trade Balance14FDI flows16FDI Inflows by Economic Group16FDI Inflows by Region17FDI Inflows by Country18Cross-Border M&As19Remittances and Current Account Balance21Global Growth Outlook23Part II - Lebanon's Trade Sector24Merchandise Imports25Merchandise Exports27FDI Inflows29Remittances31External Sector Indicators35Trade and Investment Risk Score36SWOT Analysis – Lebanon's Trade Sector37ConclusionBankmed - Market & Economic Research Division382
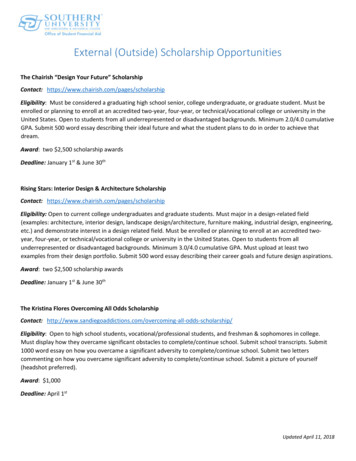
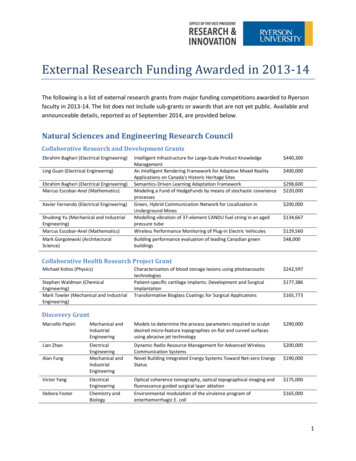
SPECIAL REPORTAnalysis of Lebanon’s External Sector - September 2016GLOBAL TRADEOver the past years, major macroeconomic developments have been affecting the realeconomic activity across several regions mirroring subdued economic aggregates andweak global growth prospects. The decline in commodity prices coupled with the slowdownand rebalancing in the Chinese economy have hindered global growth and levied largeredistributive costs across many countries. Moreover, the uncertainty accompaniedby the recent “Brexit” in the United Kingdom and the surrounding geopolitical tensionshave contributed to a slowdown in global investment and trade, a decline in capital flowsto emerging markets and developing economies, and a subdued outlook for the worldeconomy.With regard to global trade, growth in the trade of goods and services by volume has recentlyslowed dropping from 12.5% in 2010 to 2.8% in 2015. Weak import and export volumes,particularly in emerging markets, deceleration of growth in China, and the sluggish globaleconomic activity amid continued geopolitical tensions repressed global trade in 2015.Source: IMF, Bankmed ResearchBankmed - Market & Economic Research Division3
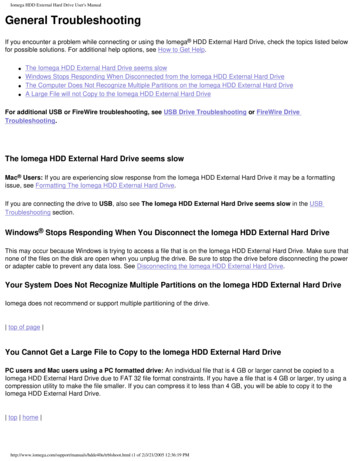
SPECIAL REPORTAnalysis of Lebanon’s External Sector - September 2016GLOBAL TRADEMoreover, both merchandise and services trade growth has decelerated over the past fiveyears with services growing at a slightly higher rate.Source: IMF, Bankmed ResearchBankmed - Market & Economic Research Division4
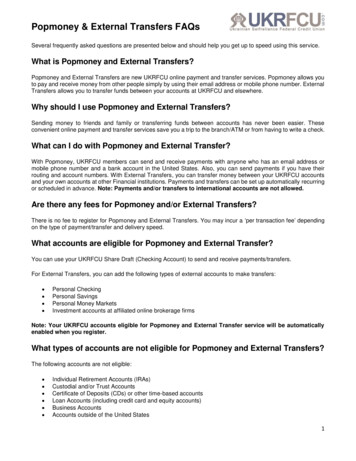
SPECIAL REPORTAnalysis of Lebanon’s External Sector - September 2016MERCHANDISE TRADEMerchandise ExportsA closer look on the merchandise trade reveals that petroleum oils and crude oil standat the top of the world’s merchandise exports by product accounting for around 8.6% oftotal exports, followed by motor vehicles (4.1%), telecommunication equipment (3.9%), andcathode valves and tubes (3.8%).Source: UNCTAD STAT, Bankmed ResearchBankmed - Market & Economic Research Division5
SPECIAL REPORTAnalysis of Lebanon’s External Sector - September 2016MERCHANDISE TRADENonetheless, a detailed analysis on the evolution of the world’s top 10 exports by productreveals that the year 2015 witnessed a sharp fall in merchandise exports to record USD16,521.3 billion when compared to an average of USD 17,754.8 billion in the period 20102013 and USD 18,965.1 billion in 2014.Particularly, petroleum oils and crude oil declined by a yearly 42.8% to reach USD 1,416.3billion in 2015. This is attributed to the sharp fall in oil prices as a result of abundant oilsupply and weak demand from China. Moreover, exports of natural gas also witnessed a30% plunge in 2015 to reach USD 257.8 billion. The overall 12.9% decline in the world’smerchandise exports reveals a strident deceleration in global trade reflecting a weak globaldemand and a suppressed purchasing power.Source: UNCTAD STAT, Bankmed ResearchBankmed - Market & Economic Research Division6
SPECIAL REPORTAnalysis of Lebanon’s External Sector - September 2016MERCHANDISE TRADEWith regard to the world’s top exporter countries, Chinese exports accounted for the highestshare of exports of goods and services at 11.7% in 2015 with its top exported productsincluding electronic equipment, machines and engines, furniture, plastics, medical andtechnical equipment, vehicles, iron and steel products, and clothing and foot wear.The United States comes second after China with a share of 10.8% in 2015 mainly exportingmachines and engines, electronic equipment, aircrafts and vehicles, and oil.Source: UNCTAD STAT, Bankmed ResearchBankmed - Market & Economic Research Division7
SPECIAL REPORTAnalysis of Lebanon’s External Sector - September 2016MERCHANDISE TRADEMerchandise ImportsWith regard to merchandise imports, petroleum oils and crude oil also ranked as theworld’s most imported products in 2015 with a 10.9% share of total merchandise imports.It was followed by cathode valves and tubes (4.5%) as well as motor vehicles (4.2%) andtelecommunication equipment (4.1%).Source: UNCTAD STAT, Bankmed ResearchBankmed - Market & Economic Research Division8
SPECIAL REPORTAnalysis of Lebanon’s External Sector - September 2016MERCHANDISE TRADESimilar to the drop in merchandise exports, merchandise imports also witnessed a sharpfall of 11.9% in 2015 to reach USD 16,611.3 billion. Moreover, an analysis of the evolution ofimports by product reveals that imports of petroleum products also witnessed a yearly dropof 14.5% in 2015 to reach USD 1,805.9 billion down from USD 2,112.3 billion in 2014 and anaverage of USD 2,092 billion in the period 2010-2013.Source: UNCTAD STAT, Bankmed ResearchBankmed - Market & Economic Research Division9
SPECIAL REPORTAnalysis of Lebanon’s External Sector - September 2016MERCHANDISE TRADEAs to the world’s top importer countries, the United States topped the list with a share of13.7% of the world’s total imports including electronic equipment, machines and engines,vehicles, oil, and pharmaceuticals. China ranked second in the world’s top imports with a10.1% share of total imports where electronic equipment, oil, machines and engines, andmedical equipment comprise the bulk of Chinese imports.Source: UNCTAD STAT, Bankmed ResearchBankmed - Market & Economic Research Division10
SPECIAL REPORTAnalysis of Lebanon’s External Sector - September 2016MERCHANDISE TRADECommodities' DynamicsThe main reason behind the drop in the value of global exports and imports is attributedto the sharp decline in commodities' prices. A closer look on commodities' indices showsthat the energy index witnessed the sharpest fall in recent years which is attributed to themajor plunge in oil prices. In particular, the price of crude oil fell from an average of 95.5USD/barrel in 2011 to an average of 48 USD/barrel in 2015 due to its oversupply and thedeceleration in the Chinese economy.Nonetheless, the non-energy index which includes agricultural products, food, raw materials,fertilizers, as well as metals and minerals also witnessed a decline ever since the fall in oilprices. For instance, iron ore which is one of the main raw materials and a component ofthe non-energy index witnessed a sharp decline from 154 USD/Dry metric ton unit in 2011 to52 USD/Dry metric ton unit in 2015. The tightening in the Chinese steel market, which actsas the main driver of iron ore prices, and the current ample supply levels highly contributedto the decrease in prices.Source: World Bank, Bankmed ResearchSource: World BankBankmed - Market & Economic Research Division11
SPECIAL REPORTAnalysis of Lebanon’s External Sector - September 2016TRADE SERVICESThe world’s trade by service category reveals that the travel sector make up to 26% of total tradeservices. It is followed by business services (22%), transport (18%), telecommunications,computer and information services (10%), as well as financial services (9%).Source: UNCTAD STAT, Bankmed ResearchBankmed - Market & Economic Research Division12
SPECIAL REPORTAnalysis of Lebanon’s External Sector - September 2016TRADE SERVICESA closer look on geographical trade services reveals that the United States stands at thetop of both the world’s service exporters and importers. European countries such as UnitedKingdom, Germany, France, Netherlands, and Ireland also make up a large share of globaltrade services.Source: UNCTAD STAT, Bankmed ResearchSource: UNCTAD STAT, Bankmed ResearchBankmed - Market & Economic Research Division13
SPECIAL REPORTAnalysis of Lebanon’s External Sector - September 2016TRADE BALANCEGoods and services trade balance by region shows that Europe has maintained a tradesurplus over the period 2010-2015 and recorded a surplus of USD 661,267 million. Itis followed by the BRICS which witnessed a rise in its trade surplus in 2015 in face ofdepreciation in the Brazilian Real, the Russian Ruble, the Chinese Renminbi, and the SouthAfrican Rand which, spurred exports in 2015. Within this context and according to the IMF, a10% real effective depreciation of a currency raised real net exports by an average of 1.5%of gross domestic product. Therefore, a higher trade surplus in the BRICS stemmed from arise in exports and a fall in import bills.With regard to the MENA region, lower oil prices took its toll on net exports across oilexporting countries within the region which in turn caused a trade deficit in 2015.On the other side, America has long suffered from a trade deficit over the period 2010-2015.Moreover, though it is hard to explain the United States' "trade deficit trap", it is fundamentallycaused by the lack of competitiveness of US products with respect to foreign rivals coupledwith a series of appreciation in the dollar relative to a basket of currencies. Moreover, financiallinkages tend to play a role in amplifying the trade deficit where investment opportunitiesexceed savings by the Americans, driving the country into borrowing from abroad.Source: UNCTAD STAT, Bankmed ResearchBankmed - Market & Economic Research Division14
SPECIAL REPORTAnalysis of Lebanon’s External Sector - September 2016TRADE BALANCEAnalysis of the world's net exporters and importers reveals that China had the highest tradesurplus of USD 384,642 million ranking at the top of net exporters in 2015. Second comesGermany with USD 252,820 in trade surplus. It is followed by Russia (USD 111,902 million),Netherlands (USD 109,667 million), and Korea (USD 104,666 million). It is important to notethat the United Arab Emirates stood at the 10th position recording a trade surplus of USD49,775 million. Qatar came in the 14th position with a total trade surplus amounting to USD33,020 million.With regard to trade deficit, the United States recorded the highest trade deficit in the worldwith a total of USD 539,750 million in 2015. It was followed by India (USD 104,561 million)and United Kingdom (USD 54,045 million). Egypt and Saudi Arabia ranked in 5th and 6thposition with a total trade deficit of USD 30,142 million and USD 28,448 million in 2015,respectively.Source: UNCTAD STAT, Bankmed ResearchBankmed - Market & Economic Research Division15
SPECIAL REPORTAnalysis of Lebanon’s External Sector - September 2016FDI FLOWSFDI Inflows by Economic GroupGlobal FDI inflows increased by a yearly 36% in 2015 to reach USD 1.76 trillion, the highestlevel reached over the period 2010-2015. The principal factor behind this substantial reboundwas a yearly 84% surge in FDI inflows targeting developed economies which accountedfor 55% of global FDI inflows and reached USD 962,496 million in 2015. Furthermore,developing economies also witnessed record high FDI inflows of USD 764,670 million in2015 increasing by a yearly 9% and accounting for 43% of global FDI inflows.Source: UNCTAD STAT, Bankmed ResearchBankmed - Market & Economic Research Division16
SPECIAL REPORTAnalysis of Lebanon’s External Sector - September 2016FDI FLOWSFDI Inflows by RegionIn particular, FDI inflows to the North American region witnessed a yearly growth of morethan 160% reaching USD 428,537 million in 2015 up from a historically low level of USD165,120 million in 2014. Moreover, FDI inflows to the European Union recorded a yearly50% rise to reach USD 439,458 million in 2015. Nonetheless, developing Asia remained thelargest FDI recipient region in the world with more than half a trillion US dollars of FDI inflows(USD 540,722 million) in 2015. Specifically, FDI inflows into East Asia accounted for 60%of FDI inflows into Asia and increased by a yearly 16.8% in 2015 reaching USD 322,144million 1.1East Asia includes: China, Hong Kong, Korea, Taiwan, and MongoliaSource: UNCTAD STAT, Bankmed ResearchBankmed - Market & Economic Research Division17
SPECIAL REPORTAnalysis of Lebanon’s External Sector - September 2016FDI FLOWSFDI Inflows by CountryAmong host economies, the United States ranked as the world’s largest recipient of FDIinflows amounting to USD 379,894 million in 2015. It was followed by Hong Kong (USD174,892 million) and China (USD 135,610 million).Source: Global Investment Trends Monitor, January 2016 – United NationsBankmed - Market & Economic Research Division18
SPECIAL REPORTAnalysis of Lebanon’s External Sector - September 2016FDI FLOWSCross-Border M&AsA closer look on growth rates of the integral composition of FDI inflows reveals that thegrowth was largely attributed to cross-border merger and acquisitions (M&A) with limitedcontribution of new greenfield investment projects between countries in productive assets.Moreover, according to the Global Investment Trend Monitor published by the UnitedNations, a part of FDI flows was related to corporate restructuring which involved large flowsin the financial account of the balance of payments and little movement in actual resources.Cross–border M&A registered a yearly 61.4% increase in 2015 while announced greenfieldprojects merely changed. The decline in the latter, specifically in developing economies,points out to a weakness in growing capital expenditures and new investment projects.Source: UNCTAD STATBankmed - Market & Economic Research Division19
SPECIAL REPORTAnalysis of Lebanon’s External Sector - September 2016FDI FLOWSFurthermore, analysis of net capital flows by regi
SWOT Analysis – Lebanon's Trade Sector 37 Conclusion 38 2 Table of Contents Bankmed - Market & Economic Research Division. SPECIAL REPORT Analysis o Lebanons Eternal Sector September 2016 3 GLOBAL TRADE Bankmed - Market & Economic Research Division Source: IMF, Bankmed Research .