Transcription
Fort Peck2016Community Health Assessment
ContentsAcknowledgementsIntroductionKey Health ConcernsContributing FactorsDisparitiesAssets and ResourcesDemographicsSubstance AbuseMental Health and TraumaChronic DiseaseCommunicable DiseaseMaternal and Child HealthInjuryAccess to CareOverall Health Status1234455689101213141519
AcknowledgementsThe Fort Peck Tribal Health Department thanks the following members of the CommunityHealth Assessment Committee that contributed to the development of this document.Audrey Stromberg, Roosevelt Medical centerChristine Eggar, Frontier SchoolDennis FourBear-Fort Peck Tribal Health DepartmentGary Scott-Wolf Point SchoolsJay Kirk-Northeast Mental Health ServicesKarla Thompson-Roosevelt County Health DepartmentPatty Presser-Roosevelt County Health DepartmentRene Rasmussen-Bainville SchoolsRuth Jackson-Roosevelt County Board of Health MemberShelli Isle-Roosevelt County Board of Health MemberSue Snitker-Vern E Gibbs Health CenterTomina Kinze-Chief Redstone ClinicMichelle Barness-Roosevelt County Health DepartmentVicki Bisbee-South Side SchoolMark Zilkoski-Roosevelt County Health DepartmentTarrah Poitra-Roosevelt County Health DepartmentNatasha Kemp-Roosevelt County Health DepartmentJames Baldwin-Poplar SchoolsRuth Jackson-Youth Services CenterCindy Dufner-DCFSErnie Bighorn-Fort Peck Tribes Tribal Action PlanMyrle Zilkoski-Wolf Point SchoolsGary Macdonald-Roosevelt CountyDarrell Synan-Roosevelt CountyChristine Hollar-Dinsemore-Ministerial AssociationRachel Hawker-HPDP, Kenny Smoker-HPDPDale Decoteau-Fort Peck Health Promotion Disease PreventionDuane Nygard-Roosevelt County CommissionersJessica SchmitzTom Escarcaga Jr.-Fort Peck TribesRon Kemp-Youth Probation District CourtGreg Hollar-Dinsmore2
IntroductionThe Fort Peck Reservation in rural,northeastern Montana, is home totwo American Indian Nations, theAssiniboine and Sioux Tribes. The reservation, which spans 180 miles andencompasses a total of 3200 squaremiles, is home to more than 7,000tribal members. The four main communities on the Fort Peck Reservation-Wolf Point, Poplar, Brockton andFrazer-lie just north of the MIssouri River. The reservation encompasses parts of frontier counties of Roosevelt, Valley, Daniels and Sheridan.The Fort Peck Tribes are governed by the Tribal Executive Board, composed of twelve votingmembers, plus a chairman, vice-chairman, secretary-accountant, and sergeant-at-arms.Tribal executive board members are elected every two years. The tribal government operates a wide variety of tribal government programs, including the Fort Peck Tribal HealthDepartment.In 2015, the Fort Peck Tribal Health Department applied for and received funding from theMontana Public Health and Safety Division to develop a comprehensive health assessmentof the Fort Peck Reservation. Dennis Four Bear, the director of the Fort Peck Tribal HealthDepartment, worked with a third party consultant to convene a group of community stakeholders to guide the healthassessment process. The stakeholder group met quarterlyin 2016 to guide the process.The following document contains an analysis of the mostup to date population-leveldata for the Fort Peck Reservation. For question regardingthe information containedin this report, contact DennisFour Bear at 406-768-2200 ord.fourbear@fortpecktribes.net.3
Key Health ConcernsIn January, 2016, the Community Health Assessment Committee made up of stakeholdersfrom Fort Peck and Roosvelt County, identified a number of key health concerns in our community based on their experience working in the community.Substance AbuseMethamphetamineAlcohol AbuseGamblingMental HealthOpiatesTobaccoTraumaChronic DiseaseCommunicable DiseaseDiabetesCancerHepatitis CHead LiceSexually Transmitted InfectionsHeart DiseaseObesityMaternal and Child HealthTeen PregnancyDevelopmental delayDrug use in pregnancySchool supportContributing FactorsCommunity Health Assessment Committee members identified the following factors thatcontribute to the health concerns in Fort Peck and Roosevelt County.Socioeconomic StatusTraumaPovertyLow education ratesInsufficient and poor housingDependence on a broken systemFamily breakdownNeglectRacismHopelessnessAdverse Childhood ExperiencesLack of on“Night” lifestyleAccess to exercise opportunitiesAging population Frontier communityEffects of Bakken Lack of youth activitiesAccess to Care, Services and EducationLack of: Dental careProvidersMental Health ServicesElder assisted living, home health and hospiceTreatment facilitiesAccess to family planning4
DisparitiesThe Community Health Assessment Committee identified the following groups as those thatexperience health disparities in Fort Peck and Roosevelt CountyChildrenAdolescentsAmerican IndiansTransients from the BakkenPregnant women and teen mothersThe elderlyAssets and ResourcesThe Community Health Assessment Committee identified a number of community assets andresources that Fort Peck can draw upon to improve the health of our community.Extension servicesCommunity libraryLaw enforcementSchools and school counseling servicesHealth Promotion Disease Prevention ProgramSchool Based ClinicsMental health centerThree hospitals, ER and several health clinicsTwo midwivesFaith based organizations and churchesLocal clinicsIHSCommunity hotlinesPrenatal classesBest BeginningsFort Peck Transit ServiceStat Air (Airlift)Cultural center open gymWellness centerHome visiting programs5Family planningHi-line HomesParenting ClassesGreat Northern Development CorporationFort Peck Community CollegeHead StartLoy Sprague Grant-Sexual BehaviorsYouth Dynamics Inc.Youth GroupsAdult Education ClassesMeals on Wheels4-H ClubsWomen’s ClubYouth Advisory BoardsSwimming pool in the summersHealth department services: WIC, Immunizations, Family Planning, Home VisitingGenerational depth-families
DemographicsTable 1. DemographicsPopulationMedian AgeUnder 5Under 1865 and OlderMaleFemaleWhiteAmerican Indian33% ofyoung adultsaged 18-24in Fort Peckdo not havea high schooldegreecompared to15% in MT.Fort Peck 86.3%22.6%14.8%50.2%49.8%89.4%6.3%The demographics of the Fort Peck reservation are very different than those inMontana as a whole. Compared to only6% of Montanans, 70% of Fort Peck residents are American Indians. Fort Peckhas a significantly younger populationthan the state of Montana, with one inten residents of the reservation under theage of 5 and nearly one in three residents under the age of 18. (See Table 1).In terms of socioeconomic status, residents of Fort Peck face manychallenges. The median household income in Fort Peck more than 12,000 less than that in Montana. One in four households in FortPeck report that there are no workers present and 36% of familieswith children under 18 live in poverty. Seven out of ten familieswith children in Fort Peck participate in the Supplemental NutritionAssistance Program (also known as food stamps).In terms of education, Fort Peck residents are 3 times less likely tohave a bachelor’s degree than all Montanans. Educational disparities are evident early on in our population, as fewer 3 and 4year olds are enrolled in preschools and only four in five 15 to 17year olds still attending school (See Table 2).Table 2. Education, income, andemploymentBachelor’s degree or higher3 and 4 year olds enrolled in preschool15 to 17 year olds enrolled in schoolsMedian household incomeHouseholds with no workers in the past yearPercent in poverty (all people)Poverty (under 18)Households receiving SNAPHouseholds with children under 18 receiving SNAPFort PeckMontana11%32%81% 34,34524%28%36%18%70%29%41%96% 46,76615%15%20%11%52%Source: American Community Survey (ACS) 5 Year Estimates, 2009-201411% of theAmericanIndianpopulationof Montanalives in FortPeck.6
DemographicsHousing is also a pressing issues in Fort Peck. Residents ofOwner occupied housing57%68%the reservation are less likelyRenter occupied housing43%32%than residents elsewhere inVacant housing23%16%Montana to own their ownHousing built in year 2000 or later3%17%homes and the housing stockNo vehicle available7%5%in Fort Peck is much olderHousing lacks complete plumbing facilities1%1%than that in rest of the state,No telephone service14%3%with only 3% of homes build inthe year 2000 or later. 1 in 14Fort Peck residents have no vehicle available (7%) and 1 in 6 do not have telephone service(14%). (See Table 3) These limitations pose barriers for residents of Fort Peck who wish to access services, as transportation and communication limitations arise.Table 3. HousingFort Peck MontanaHousing is also a pressing issues in Fort Peck. Residents of thereservation are less likely than residents elsewhere in Montana to own their own homes and the housing stock in FortPeck is much older than that in rest of the state, with only 3%of homes build in the year 2000 or later. Almost 1 in 10 FortPeck residents have not vehicle available (7%) and 1 in 6 donot have telephone service (14%). These limitation pose barriers for residents of Fort Peck who wish to access services, astransporation and scheduling pose greater issues to those individuals without access to reliable transportation and/or phoneDisabilities are also a concern in our community, especiallylater in life, with half of the seniors in For Peck reporting a disability.1 in 14 FortPeck adultsTable 4. Disabilitydoes not have Disability statusDisability aged 5-17a car and 1Disability 65 and overin 6 has notelephoneservice7Source: ACS 5 Year Estimates, 2009-2014Only 3% of thehomes in FortPeck were builtafter the year2000. 23% ofhomes are vacant.Fort Peck Montana12%4%50%13%5%36%
Substance AbuseYouthTable 5. Alcohol UseAmong YouthFort Peck MontanaLifetime alcohol useCurrent alcohol useBinge drinking in the last month54%24%13%Table 6. Illicit Drug UseAmong YouthLifetime marijuana useLifetime cocaine useLifetime inhalant useLifetime heroin useLifetime methamphetamine useLifetime ecstasy useLifetime misuse of prescription drugsAdultsOn in five adults inRoosevelt County report excessive drinking.The percent of drivingfatalists that are attributable to alcoholis sharply elevatedin Roosevelt Countycompared to the USand Montana. Adults inRoosevelt County aretwice as likely as adultsin Montana to reportmisusing prescriptionpain medication.70%34%21%Youth in Fort Peck report less alcohol usethan youth in Montanaor the US, however theyare more likely to reportdrug use, and the ratesof use are particularlyhigh for harder drugssuch as heroin, methamphetamine andcocaine.US63%33%18%Fort 3%5%17%Table 7. Alcohol UseAmong AdultsExcessive drinking (binge or heavydrinking in the last monthPercent of driving deaths that arealcohol impairedTable 8. Prescription drugmisuseMisused prescribed pain 1%RooseveltMontanaCounty6%Source: Youth Risk Behavior Survey (YRBS), 2015Behavioral Risk Factor Surveillance Survey (BRFSS), 2014 and pain medicaionmodule, MT BRFSS 2011 - County Health Rankings 20163%8
Mental Health andTraumaYouthTable 9. Mental Health and TraumaFort Peckamong YouthMTUSSymptoms of depression in the last yearSuicide attempts in the last yearCarried a weapon in the past 30 daysIn a physical fight in the past yearPhysically forced to have sexual intercourseExperienced dating violenceExperienced sexual dating violenceBullied on school property in the last yearElectronically bulled in the last 16%18%13%15%26%8%8%6%27%20%Youth in Fort Peck are more likely to report attempting suicide in the last year compared tohigh school students in Montana and the US. They are also more likely to report being in aphysical fight and to have experienced bullying on school property in the last year.AdultsTable 10. Mental Health among AdultsPoor mental health days in the last monthRatio of population to mental health 3.4529:1Adults in Roosevelt County report an average of 4.4 poor mental health days in the lastmonth. However, there is a severe shortage of access to mental health providers in Fort Peckrelative to Montana and the US as a whole.9Source: YRBS 2015 - BRFSS, 2014 - County Health Rankings 2016
Chronic DiseaseTobacco UseTable 11. Tobacco Use among Youth Fort PeckMTUSCurrent cigarette useCurrent chewing tobacco useLifetime e-cigarette use13%12%45%11%7%45%Table 12. Tobacco Use among AdultsCurrent cigarette useCurrent chewing tobacco use (Eastern th in Fort Peckare more likely tocurrently use cigarettes than highschools students inthe US as a whole.Nutrition and Physical ActivityMore than 1/3 Table 13. Nutrition and Physical ActivityFort Peckof Fort PeckAmong Youthhigh school stu- Self described overweight35%dents describeDid not eat fruit in the past 7 days16%themselves asDrank pop every day in last 7 days25%overweight andWere not physically active one day in the last week13%35% of adultsare obese.Table 14. Nutrition and Physical RooseveltActivity Among AdultsCountyMTMTUS30%5%19%11%32%5%20%14%USYouth in FortObese35%25%27%Peck are threePhysically Inactive31%22%23%times morelikely to report Table 15. Screen Time Among Youth Fort PeckMTUSnot eatingWatched TV three or more hours per day26%22%25%fruit in the last3 or more hours of video games or computer31%34%42%7 days comtime per daypared to otherhigh schoolers and are also more likely to report drinking pop every day in the last7 days. Adults in Roosevelt County are also more physically inactive than adultsin Montana as a whole. More than a quarter of high school students in Fort Peckreport watching three or more hours of TV per day and one third report three ormore hours of computer of video games per day.Source: YRBS 2015 - BRFSS, 2014 - County Health Rankings 201610
Chronic Disease Prevalence, ERVisits and HospitalizationsTable 16. ChronicEasternDisease Prevalence MontanaMTUSAsthma (Fort Peck youth)Asthma (adults)Diabetes (adults)Arthritis (adults)22%9%9%27%22%9%10%26%22%10%10%28%Cancer incidence rates in Roosevelt Countyare elevated relative to Montana. Of note, incidence rates of colon and rectum cancer arealmost twice that seen in the entire state.Table 17. Chronic DiseaseInpatient Hospital iovascular disease859.6Diabetes (types 1 and 2)1277.9* Rate per 100,000 Roosevelt County 2011-2013Admission rates in the emergencyroom for chronic diseases are alsoelevated in Fort Peck. Asthmarates are double and cardiovascular disease admission rates arealmost four times higher thoseseen in the rest of the state.11More than one in five youth inFort Peck reports that they currently have asthma. The ratesof chronic illnesses in EasternMontana is similar to that ofMontana as a whole, but,based on our ED and hospitaladmissions data, we believethese rates are higher in FortPeck.Table 17. Lung and bronchus64.956.4Colon and rectum61.236.9*Rate per 100,000, Roosevelt County 2011-2013MT47.7716.8746.7822.5Rates of inpatient admissions forchronic diseases are elevatedin Roosevelt County comparedto Montana. Of particular concern, asthma admission rates are6 times higher in Fort Peck compared to Montana as a whole.Table 18. Chronic DiseaseEmergency Room ovascular disease1140.5Diabetes (types 1 and 2)1765.2* Rate per 100,000 Roosevelt County 2011-2013Source: YRBS 2015 - BRFSS, 2014Montana Hospital Discharge Data System, DPHHS, 2011-2013MT260804.9372.71235.6
CommunicableDiseaseSexual Risk BehaviorsTable 20. Sexual risk behaviors among youthEver had sexual intercourseCurrently sexually active-last three monthsDid not use a condom at last intercourse (among currentlysexually active HS students)Fort PeckMTUS44%28%44%32%41%30%30%41%43%Almost half of students in Fort Peck report ever having sexual intercourse and almost a thirdof sexually active teens did not use a condom at last intercourse.Disease IncidenceTable 21. Communiciabledisease case .2123.013.844.622.2ChlamydiaHepatitis CGonorrheaPertussisCampylobactereioisis*Rates per 100,000, DPHHS 2011-2013Rates of sexually transmitted diseases in Fort Peck are sharply elevated compared toMontana has a whole. Chlamydia rates are almost quadruple those in Montana andGonorrhea rates are 20 times higher. The rate of Hepatitis C in Fort Peck, which is a bloodborn pathogen and is often transmitted through the sharing of needles, is 7 times higher inFort Peck than in Montana.Source: YRBS 2015 - BRFSS, 2014 - Fort Peck Tribal BRFSS, 2016Montana Communicable Disease Bureau, DPHHS, 2011-201312
Maternal and ChildHealthBirth RatesTable 22. Birth Rates*Number of births**Birth rate overall***Teen birth ratePreterm birth****Born weighing less than 2500 gramsFort PeckMT54643.2162.210%6%37,35312.2329%7%Data from Fort Peck indicate thehealth disparities begin affectingour population early in life. Theteen birth rate in Roosevelt County is three times higher than thatrate in Montana.* Rates per 1000 population 2011-2013 ** 2015-2015 *** 2013-2014****Born less than 37 weeksBabies are less likely to be breastfed at discharge in Fort Peckand womenRooseveltparticipatingMTTable 23. Maternal and Child Nutrition*in the WICCountyprogram inChildren aged 2-5 years on WIC who are overweight or obese38%28%Fort PeckWomen in the WIC program who initiate breastfeeding53%85%are also*2011-2013less likely toreport initiatingRooseveltbreastfeedingMTTable 24. Maternal Child Health Indicators*and 2-5 year oldCountyWIC participantsWomen entering prenatal care after first trimester50%27%are more likely toWomen whose Kotelchuck Index is 80%45%75%be overweight orSmoking during pregnancy29%16%obese.Mother’s education less than high school graduate38%12%Any insuranceReceiving WICBreastfeeding at discharge97%55%56%92%35%89%*Birth certificate data 2011-2013Women in Fort Peck are almost twice as likely to enter prenatal care later in their pregnancy and are more likely to smoke during their pregnancy. Pregnant women in Fort Peckdo have good access to health insurance and more than half have access to the WICprogram13Source: Montana Vital Statistics and Montana WIC Program, DPHHS
InjuryDriving Risk BehaviorsTable 25. Driving risk behaviorsamong youthNever or rarely wears a seat belt whendriving in a car driven by someone elseIn a vehicle driven by someone who hadbeen drinking alcohol in last monthText or email while driving in last monthFort PeckMTUS14%10%6%22%23%20%30%55%42%Seat belt use amonghigh school studentsin Fort Peck is lowerthan that in the USand in Montana.ER visits for InjuryTable 26. Emergency room visits for injury* Roosevelt CountyMontanaER visits for all unintentional injuryER visits for fallsER visits for motor vehicle injuriesER visits for Intentional self harmER visits for Traumatic Brain Injury*Rates per 100,000, 0.0104.5649.9For many types of injuries, emergency room admission rates are higher in Roosevelt Countycompared to Montana as a whole. Of particular concern is the rate for intentional self harm,which is almost three times the rate for Montana.Source: YRBS 2015 - Montana Hospital Discharge Data System, DPHHS, 2011-201314
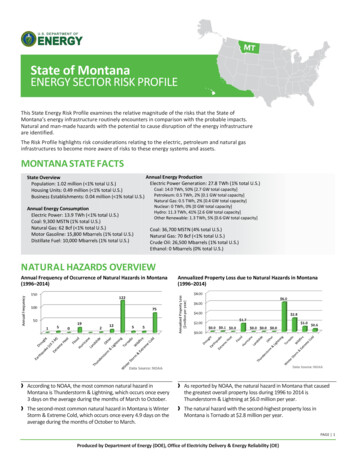
Access to CareInsurance TypeInsurance Type, ACS 5 Year Estimates 2014605550Percent5040313024201814 1312181612910422In terms of insurance, almost 1/3of individuals in FortPeck have Medicaid and only 1/4have employmentbased insurance.The rate of privateinsurance in FortPeck is less than halfthat in Montana as awhole.0MedicaidMedicareVADirect PurchaseInsurance TypeFort PeckMontanaEmploymentBasedUnited StatesUninsuredPercent Uninsured, by Race, ACS 5 Year Estimates t PeckMontanaAll15WhiteUnited StatesAmerican IndianSource: ACS 5 Year Estimates, 2009-2014Almost 1/3 of all residentsof Fort Peck are uninsured,driven by a racial disparityin insurance status. AmongAmerican Indians 42% areuninsured compared toonly 14% of the white population.
Disparities in AccessA number of populations in Fort Peck experience disparities in access to insurance: 60% of 19 to 25 year olds in Fort Peck are uninsured 85% of unemployed individuals in Fort Peck are uninsured 43% of those making 25,000 to 49,999 annually are uninsured compared to only 30% ofthose making less than 25,000 Men are more likely to be uninsured than womenAccess to Dental CareTable 27. Dental careDid not see a dentist during the past year (youth)Population to dentist ratio (Roosevelt County)Fort PeckMTUS32%2266:125%1477:126%1583:1Almost one third of high school students report not seeing a dentist in thepast year. Population to dentist ratio in Roosevelt County is higher than thatin Montana and the US.Access to Primary CareTable 28. Access to Primary CareRooseveltCountyMTUSPopulation to primary care provider ratio5563:11312:11342:1Access to primary care providers is a severely limited in Fort Peck. Thepopulation to primary care provider ratio is more than 4 times that inMontana and the US as a whole.Source: ACS 5 Year Estimates, 2009-2014YRBS 2015 - BRFSS, 201416
Access to CareIndian Health ServiceThe Billings Area Indian Health Service (IHS) operates the Fort Peck Service Unit on theFort Peck Reservation with health centers in Poplar and Wolf Point. The mission of IHS isto“Strive to raise the physical, mental, social and spiritual health of American Indiansand Alaska Natives to the highest level.Table 29. Top Ten Diagnosisat the Fort Peck IHS ServiceUnit, 2013-2015Dental examAcute upper respiratory infectionType II DiabetesHypertensionOtitis media (ear infection)Acute pharyngitisBack PainUrinary tract infectionPulpitis (infected tooth)BronchitisThe Fort Peck Service Unit operates two clinics in FortPeck, the Verne E. Gibbs Health Center in Poplar andthe Chief Redstone Clinic in Wolf Point.The Fort Peck Tribes also operates a number of servicesthrough a 638 contract, including the Health Promotion Disease Prevention that operates 5 school basedclinics that provide medical, dental and behavioralhealth services to students and the Spotted Bull Recovery Center that provides individualized, comprehensive, and culturally based chemical dependencyservices.Table 30. IHS Services in Fort PeckVerne E Gibbs l HealthRadiologyPharmacyLaboratoryPublic HealthNutritionCase Management17Chief Redstone Clinic- Services Provided through aWolf Point638 ContractMedicalDentalOptometryBehavioral HealthRadiologyPharmacyLaboratoryPublic HealthNutritionCase ManagementHealth Promotion Disease PreventionSafety and Environment of CareHousekeepingTribal healthSpotted Bull Recovery CenterSource: Fort Peck Service Unit clinical data, Billings Area IHS
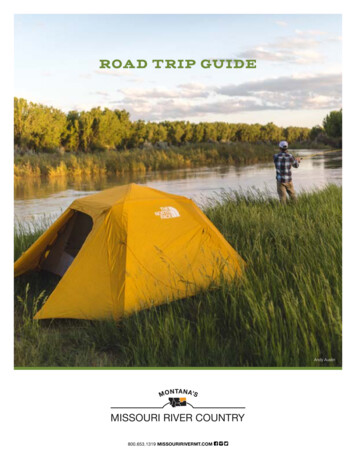
Number of filled positions and vacancies at the Fort PeckIHS Service Unit in the first three quarters of 2016One barrier to providing effective health services in FortPeck is recruiting and retaininglicensed providers. In the firstthree quarters of 2016, the FortPeck Service units were approximately 75% OthervacanciesNumber of visits to the Fort Peck Service Unit Health Programs,January through August 2016Through the first three976660943099quarters of 2016,there were more than27,500 visits to the IHSservice unit ALOPTOMETRYOPTOMETRYHEALTHHEALTHTable 31. IHS PrescriptionsPoplarWolfPoint2016 Quarter 1-3 Total PrescriptionsPrescriptions for Controlled Substances% Controlled Substances54,94033766.1%40,65819654.8%Source: Fort Peck Service Unit clinical data, Billings Area IHSPOPLARWPMEDICALMEDICALThe service unit also dispensed almost 100,00prescriptions during thefirst three quarters of 2016,including more than 5,300prescriptions for controlledsubstances.18
Overall Health StatusOverallTable 32. Overall health statusSelf rated fair or poor health (adults)Poor physical health days per month (adults)Years of Potential Life Lost 3.76,622*Age-adjusted years of potential life lost before aged 75 per 100,000 populationAlmost one quarter of all adults in Roosevelt County rate theirhealth as fair or poor and, on average, adults reports havingalmost 5 days per month of poor physical health. Compared tothe US, adults in Roosevelt County experience more than 3 timesthe rate of Years of Potential Life lost.One in fouradults in our arearate their healthas fair or poorand adults reportan average ofalmost 5 daysper month ofpoor physicalhealth.Median Age of DeathAgeMedian age of death, by age and gender in Roosevelt County and Montana, .062.558.576.080.5 83.063.547.0American Indian American IndianMaleFemaleWhite MaleWhite FemaleRace and GenderRoosevelt County19MontanaSource: BRFSS, 2014 - Fort Peck Tribal BRFSS, 2016Montana Office of Vital StatisticsAmerican Indians in FortPeck face a substantialdisparity in life expectancy, with a median ageof death 35 years less forAmerican Indian malesthan White males in FortPeck and 28 years forAmerican Indian Femalescompared to White females. American Indiansin Fort Peck have medianage if death 10 to 15 yearsless than other AmericanIndians in Montana.
Leading Causes of DeathAll of the age adjusted rates for the leading causes of deathCirculatory, Heart Disease348.7151.6in Roosevelt CountyNeoplasm, malignant249.7155.2are elevated relativeInjury, Unintentional injuries122.154.2to Montana. HeartCirculatory, cerebrovascular diseases75.135.9disease, Injury, andAlzheimer's disease28.920.1cerebrovascular disDiabetes mellitus68.221.2ease death rates areChronic liver disease and cirrhosis101.013.7more than twice thatOverall1465.4749.7seen in Montana. The*Age adjusted death rate per 100,000, 2013-2015death rate for diabetes is more than threetimes the rate for the rest of the state and the chronic liver disease death rate is morethan 7 times higher than Montana’s rate for CKD.Table 33. Leading Causes of t500MT155.2Source: Montana Office of Vital ovasculardiseases400Circulatory,HeartDiseaseAge adjusted death rate per 100,000Leading causes of death, 2013-2015, Roosevelt County and Montana20
SummaryThere are many pressing health concerns facing the residents of the Fort Peck Reservation. This document is an attempt to quantify, using the available public health data,some of the needs that our community currently faces. This report is the result of acollaborative effort by stakeholders on our reservation to paint a picture of the overallhealth of our community.A number of key health concerns were highlighted in the population level data analyzed in this report. The following health indicators are elevated in Fort Peck relative tothe US and Montana:Youth Illegal drug and tobacco use Suicide attempts and bullying Nutrition and overweight Teen pregnancy Access to dental careAdults Access to mental health, primary care and dental care Access to insurance, particularly among American Indians Impaired driving and alcohol related motor vehicle accidents Tobacco use, including during pregnancy Initiation of prenatal care and breastfeeding Obesity and physical inactivity Sexually Transmitted Infections and Hepatits C Chronic disease rates for hospital and ER visits and deaths SuicideClearly there is much work that can be done to improve the health of the residents ofFort Peck. And with the strong partnerships and many organizations working together toimprove our community’s health, we are confident that we can reduce risk factors andincrease the quality of life for all Fort Peck residents.21
The Fort Peck Tribes are governed by the Tribal Executive Board, composed of twelve voting members, plus a chairman, vice-chairman, secretary-accountant, and sergeant-at-arms. Tribal executive board members are elected every two years. The tribal government op-erates a wide variety of tribal government programs, including the Fort Peck Tribal .


![The Book of the Damned, by Charles Fort, [1919], at sacred .](/img/24/book-of-the-damned.jpg)