Transcription
Climate Change on Arid Lands – A Vulnerability Assessment ofTribal Nations in the American WestA thesis presented tothe faculty ofthe Voinovich School of Leadership and Public Affairs of Ohio UniversityIn partial fulfillmentof the requirements for the degreeMaster of ScienceAnna E. PalmerAugust 2017 2017 Anna E. Palmer. All Rights Reserved.
2This thesis titledClimate Change on Arid Lands - A Vulnerability Assessment ofTribal Nations in the American WestbyANNA E. PALMERhas been approved forthe Program of Environmental Studiesand the Voinovich School of Leadership and Public Affairs byDerek KauneckisAssociate Professor of Environmental StudiesMark WeinbergDean, Voinovich School of Leadership and Public Affairs
3AbstractPALMER, ANNA E., M.S., August 2017, Environmental StudiesClimate Change on Arid Lands - A Vulnerability Assessment of Tribal Nations in the AmericanWestDirector of Thesis: Derek KauneckisHistoric marginalization has left many tribal communities in the American West facing aunique set of water resource management challenges associated with climate change. Severalapproaches have emerged to measure and compare climate vulnerability using techniques fromnational-level climate vulnerability assessments, applied on a community-level scale to examineand map the relative vulnerability of sovereign tribal territories to climate-induced waterchallenges. These approaches draw on the literature on integrated vulnerability assessments andcan be used to construct a composite index of agricultural vulnerability for 72 western triballands. Nineteen empirical indicators were deductively selected and grouped into exposure,sensitivity and adaptive capacity. Exposure indicators include numerous measures of climatevariability such as drought and other extreme weather events, temperature and precipitationchange. Sensitivity indicators featured three types; human, livelihood, and physical capital.Adaptive capacity examined social, economic and institutional dimensions.Final results include four vulnerability maps offering a comprehensive picture of howdifferences in access to resources, class, and other socio-economic factors result in drasticallydifferent vulnerabilities across tribes that are located in a similar biophysical context. Thediscussion addresses both the utility and limitations of traditional climate vulnerabilityassessments for understanding tribal water challenges. These include the sovereign status ofnative lands, their connectivity to surrounding regions, nestedness within state and nationalgovernance systems, importance of cultural integrity, and evolving legal institutions surroundingwater rights. The thesis concludes with a call for a more dynamic approach to understanding theinherent adaptive capacity and resilience of tribal populations, and paths forward for improvingwater resource management on sovereign tribal territories.
4AcknowledgmentsI begin by thanking my advisor, Dr. Derek Kauneckis, for providing me with the amazingopportunity to pursue this fascinating project and the valuable feedback he has providedthroughout the past two years. A special thank you is extended to my committee members, Dr.Ani Ruhil, and Dr. Amy Lynch for their insights that helped me to structure and refine this thesis.My deepest gratitude to my family; Julian, Maria and Sara Palmer, for believing in meand encouraging me to pursue my passion. Moreover, I cannot give enough appreciation to myclosest loved one Declan, for his consistent support and understanding throughout this academicpursuit.A great thanks also goes out to the project partners and all of the stakeholders involved inthe Native Waters on Arid Lands project. I am grateful to the tribal members and natural resourcemanagers who presented and participated at the Native Waters on Arid Lands Conferences forsharing their valuable experience. I will forever be inspired by the deeply resilient and forwardthinking tradition of Native people. Without the inspiration and insights they provided at theseconferences, this thesis would not have been possible.Finally, I would like to acknowledge the United States Department of Agriculture(USDA) and the National Institute of Food and Agriculture (NIFA) for their valuable funding ofthis project.
5Table of ContentsPageAbstract . . . 3Acknowledgments .4List of Tables. . . . . . . . . .8Chapter 1: Introduction .111.1 Rationale . 131.2 Research Questions, Objectives and Organization . 14Chapter 2: A Brief History of America’s Indigenous People .162.1 Overview of Current Socioeconomic Conditions . .182.1.1 The federal trust responsibility . 202.1.2 Tribal water rights. . 20Chapter 3: Concepts & Analytical Framework . . 223.1 Overview of Vulnerability Assessment . 223.1.1 Four basic criteria for vulnerability assessments. . 223.2 Key Definitions. 253.2.1 Vulnerability. . 253.2.2 Exposure. . 263.2.3 Sensitivity. . 263.2.4 Adaptive capacity. . 273.3 The Roots of Vulnerability Assessment . 273.3.1 Risk/hazard approach (RHA). . 273.3.2 Political economy/ecology approach (PEA). . 283.3.3 Integrated assessment approach (IAA). . 303.4 Distinction Between Two Frameworks Interpreting Climate ChangeVulnerablity . . 313.4.1 Outcome vulnerability/end-point assessment methods. 313.4.2 Contextual vulnerability/starting-point assessment methods. . 333.5 Contrasting Approaches for Selecting Indicators and Collecting Data . 343.5.1 Deductive indicator selection method. . 343.5.2 Inductive indicator selection method. . 353.6 Contrasting Methods for Data Collection (Top-Down vs. Bottoms-Up). 35
63.7 Gaps, Challenges and Uncertainty in Vulnerability Analysis .38Chapter 4: Study Area Background & Drought . .394.1 The Ecological Setting . 394.1.2 Climate change impacts in Southwestern US. . 434.2 Westward Expansion, Climate Change, Drought and Adaptation Planning. 444.3 Drought as a Natural Hazard . 464.3.1 Meteorological drought. . 474.3.2 Hydrological drought. . 474.3.3. Agricultural drought. . 484.3.4 Misunderstanding of drought leads to community vulnerability . 494.3.5 US Drought Monitor. 494.3.6 National Drought Mitigation Center. 504.3.7 Strengths and weaknesses of current drought monitoring. . 514.3.8 Challenges of monitoring drought on tribal lands. . 524.3.9 Benefits of drought preparedness. . 53Chapter 5: Methodology . 555.1 Overview . 555.2 The Study Area - Seventy-two Native American Communities. . 555.2.1. Criteria for sample selection. . 585.3 General Procedure. . 585.4 Analytical Procedure. 595.4.1 Normalizing indices. . 605.4.2 Equal weights. . 615.4.3 Summarizing. 615.5.4 Data display and classification. . 625.5 Vulnerability Indicators . 625.5.1 Exposure index (EI). . 655.5.2 Sensitivity index (SI). . 715.3.3 Adaptive capacity index (ACI) . 745.5.4 Summary of data sources. . 82Chapter 6: Results & Discussion 846.1 Final Sub Indicator Values . 84
76.1.1 EI map and quantile classification. . 876.1.2 SI map and quantile classification. . 896.1.3 ACI map and quantile classification. . 916.1.4 Composite AVI map and quantile classification . 926.2 Drawing Conclusions from Correlation Analysis Between Variables. 936.4 Alternative Data Visualization Spider Diagrams. 986.5 Limitations of this Model . 101Chapter 7: Conclusions .1047.1 Adaptation in Action – Confronting Climate Change Vulnerability on TribalLands . .1057.1.1 Tribal drought contingency, and grazing management plans. . 1057.1.2 Sustainable agriculture 1067.2 Practical Application of this Model . 1117.3 Conclusion . 112References . .114Appendix A: Internal Biophysical Areas of Concern; Descriptions, Symptoms and Indices thatCould Potentially Be Included in a Future Vulnerability Assessment .126Appendix B: Data Source and Technical Documentation . . 127
8List of TablesPageTable 1 Classification scheme for vulnerability factors . 24Table 2 Tribal lands and populations in five southwestern states . 57Table 3 Indicators selected and hypothesized functional relationship chosen for theconstruction of tribal vulnerability assessment .63Table 4 Sub-indicator values . 85Table 5 Comparison of sub-indicators values for tribes with the highest and lowest highestagricultural vulnerability . .86Table 6 Correlation results . 95Table 7 Selected tribal nations sub-indicators values . 97Table 8 Correlations between exposure sub-indices . 103Table 9 Examples of adaptation in action . 106
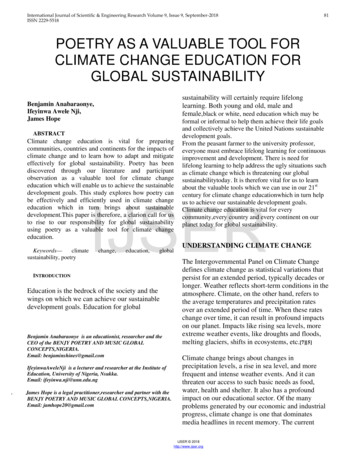
9List of FiguresPageFigure 1. Study Area . 12Figure 2. VSD blank Vulnerability Scoping Diagram (VSD) . 37Figure 3. VSD based on research presented in this thesis. 37Figure 4. Rough geographic boundaries of the Southwest . 39Figure 5. Study area located in a semi-arid climate . 40Figure 6. Average annual precipitation in the US . 41Figure 7. Lower Colorado River diversion canal . 43Figure 8. Lake Mead water supply hits record lows . 43Figure 9. US Drought Monitor . 50Figure 10. Navajo drought monitor . 53Figure 11. Hopi drought monitor . 53Figure 12. Approach for vulnerability assessment. 59Figure 13. Contribution indicators to composite vulnerability index . 62Figure 14. Components of Exposure Index (EI) . 65Figure 15. Palmer Drought Severity Index (mean 2001-2016). 66Figure 16. Temperature change 2001-2016 relative to 1895-2000 . 67Figure 17. Precipitation change 1901-2015 . 68Figure 18. Flood on Navajo Nation . 69Figure 19. Climate divisions . 69Figure 20. Exposure Index study area. 70Figure 21. Histogram-number of tribes within each corresponding climate division . 70Figure 22. Components of the Sensitivity Index (SI) . 71Figure 23. Components of the Adaptive Capacity Index (ACI) . 75Figure 24. Current status of federally adjudicated water rights on tribal lands . 77Figure 25. Composite EI map . 87Figure 26. Composite EI quantiles. 88Figure 27. Climate divisions with the largest number of corresponding tribes . 88Figure 28. Boxplot of composite EI . 88Figure 29. Q-Q plot of composite EI . 88
10Figure 30. Composite SI map . 89Figure 31. Composite SI quantiles . 90Figure 32. Boxplot of composite SI . 90Figure 33 Q-Q plot of the normally distributed composite SI . 90Figure 34. Composite ACI map . 91Figure 35. Composite ACI quantiles . 91Figure 36. Boxplot checking for normality in the composite ACI distribution . 91Figure 37. Q-Q plot of composite ACI . 92Figure 38. Composite AVI map . 92Figure 39. Composite AVI quantiles . 93Figure 40. Boxplot checking for normality in the composite AVI distribution . 93Figure 41.Q-Q plot of composite AVI . 93Figure 42. Scatter plot of three component indicators . 95Figure 43. Spider diagram of two tribes with the highest and lowest AVI scores . 98Figure 44. Duck Valley’s new and improved water system . 99Figure 45. Map of tribes determined to have the highest and lowest overall AVI . 99Figure 46. Yomba reservation. 100Figure 47. Spider diagram of two tribes with low AVI scores . 100Figure 48. Map of tribes both categorized into the same quintile indicating low AVI scores . 101Figure 49. Scatter plot showing a relationship between PDSI PRECIP and TEMP . 103Figure 50. Significant linear relationship between PDSI and PRECIP . 103Figure 51. Dead cow killed by drought on Hualapai reservation . 104Figure 52. Cattle watering system . 105Figure 53. Sixteen types of drought resistant corn used by the Hopi tribe . 107Figure 54. Geo-Dome on Navajo Nation . 108Figure 55. Innovative Farmer Emigdio Ballon on the Tesuque reservation . 108Figure 56. Zoning updates on the Salt River Pima Maricopa Indian community reservation . 110
11Chapter 1: IntroductionClimate change has grave implications for water stressed communities in theSouthwestern United States (US). Tribal nations1 in this semi-arid region are on the front lines ofconfronting several adverse effects of climate change, including extended drought, soil erosion,extreme heat events, flooding, longer dry seasons, decreased snowpack, and less dependableauxiliary water flows from ground and surface water supplies. Negative impacts will becompounded in the coming decades as scientists predict that multi-decadal droughts will emergein Southwest during the 21st Century unlike anything experienced during the last millennium(Macdonald, 2010; Cook, Ault, & Smerdon, 2015; Barnston, & Lyon, 2016). Drought imposessevere and massive costs to society ranging from economic damages, disruption of livelihoods,infrastructure expenditures and a range of environmental harm. However, any comprehensiveaccounting of drought should also consider the indirect costs of social malaise and deterioration.Indigenous communities are disproportionately harmed by climate change as they depend moreon local natural resources than the US population as a whole. Furthermore, American Indianpopulations tend to have lower socioeconomic status, making it more challenging for them toprepare for natural hazards such as floods and droughts or to recover from them. Byacknowledging the unique challenges that tribes are currently facing, the authors of the thirdofficial National Climate Assessment (NCA) asserted that tribal populations living on sovereignterritories in the Southwestern US are some of the most vulnerable to the impacts of climatechange (Reedster et al., 2013).Planning for the adverse effects of climate change is essential for policy makers, resourcemanagers, farmers, ranchers and citizens to mitigate its consequences. Vulnerability assessmentsare increasingly being used by several city, state and nationwide planners and emergency officersto mitigate and adapt to climate change (Wiréhn, Danielsson, & Neset., 2015). Such assessmentsare effective for identifying sectors, populations and geographic areas that merit particularconcern and remedial action. They also are useful for informing decision makers in developingeffective policy interventions. To provide a broad overview of tribal vulnerability and to1Tribal nations, Native American communities, First Nations, indigenous communities and tribes will beused interchangeably throughout this thesis and refers to American Indian Alaskan/Hawaiian Nativecommunities who are ethnologically similar and also distinguished by historical and cultural differences aswell as their legal-political status.
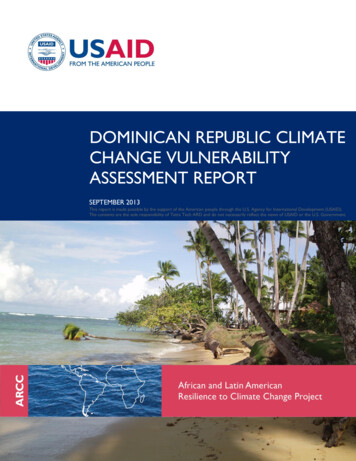
12demonstrate the effectiveness of applying vulnerability assessments as a tool to address emergingchallenges this thesis presents the first ever large-scale assessment of tribal lands.The study area includes seventy-two federally recognized American Indian tribes,nations, pueblos, bands, colonies, and reservations located primarily in five Southwestern statesArizona (AZ), New Mexico (NM), Nevada (NV), Utah (UT) and Colorado (CO) (see Figure 1).Vulnerability is measured as a function of: exposure, sensitivity, and adaptive capacity (Adger,2006). Composite indices were composed to represent these three thematic categories ofvulnerability using nineteen sub-indicators. The main outputs of this empirical analysis arecomposite vulnerability index scores and maps that illustrate differences in biophysical and socialcharacteristics across tribal lands. Results represent the relative agricultural vulnerability ofseventy-two tribal nations located across five states.Figure 1. Study Area - Tribal lands concentrated in the American Southwest (Retrieved fromNative Waters on Arid Lands, 2017).
131.1 RationaleProblem Statement - Due to geographic exposure, agricultural sensitivity, cultural ties tothe natural world and socioeconomic imbalances that occur on Native American reservations,American Indian agriculturalists have been characterized as some of the most vulnerablepopulations to climate change impacts (Reedster et al., 2013; Bennet et al., 2014). Agriculturalvulnerability to drought and climate variability are emerging concerns on tribal lands in theAmerican Southwest, yet to date, there are no published comparative climate change vulnerabilitystudies focusing on tribal nations.This thesis operationalizes a cutting-edge tool that can help tribal communities overcomemodern challenges related to climate change. It also contributes to the growing body of basic andapplied research that is needed to support tribal climate adaptation (Cozzetto et al., 2013;Guatam, Chief, & Smith, 2013; Reedster et al., 2013; Singletary et al. 2015). It builds on therecommendations called for by several studies as it translates climate change information andassessment techniques in ways that integrate indigenous perspectives and directly involve tribalcommunities to inform meaningful action (Maldonado, Bennet, & Chief, 2016).Gathering data from secondary sources was deemed the most appropriate research designrather than implementing a case study mixed method approach. As Vasquez-Leon, West andFinan’s (2003) study illustrated, comparative studies are beneficial for revealing the differentialeffects of climate on society. Looking beyond the political boundaries of specific tribal nationsallows for an examination of how differences in access to resources, infrastructure andinstitutional capacity contribute to general vulnerabilities that are similar across tribal borders.The hazard potential of current and future droughts in the Southwest is of upmost importance.The general framework and methods operationalized in this thesis can be used to assessvulnerability on several scales and the composite indices applied are flexible and can becustomized or swapped to more accurately represent emerging concerns in tribal lands.Methods and results are transparent and the final products will be distributed to interestedNative Waters on Arid Lands project team members, tribal citizens, natural resource managers,government agencies (such as the USDA), non-governmental organizations (NGOs) and otherscientists. Relevant basic research regarding long term climate trends in the Southwest aredescribed, filling a gap that is noted in Bennet et al.’s (2014) study:There is little available data to establish baseline climatic conditions on triballands without scientific monitoring tribal decision makers lack the data needed to
14quantify and evaluate the current conditions and emerging trends in precipitation, streamflow, and soil moisture, and to plan and manage resources accordingly (pp. 303-304).Given the lack of existing data on tribal lands, this study also contributes to geographical andscientific debates on the development and application of integrated assessment approaches ingeographical areas for which more detailed data is not available (Antwi-Agyei et al., 2012). Moredetailed information is also provided in Appendix B “Westward Expansion, Climate Change,Drought and Adaptation Planning,” which encompasses a longer discussion of: (i) the multifaceted nature of drought the several definitions and indices for quantifying drought, (ii)publically available climate data sources that can be used for future research, and (iii) the currentdrought monitoring and mitigation efforts ongoing in the United States.1.2 Research Questions, Objectives and OrganizationThis empirical research is intended to answer three primary research questions:1. How vulnerable are tribal nations in the American Southwest to drought and climatevariability?2. What forms of exposures/sensitivities are faced by tribal nations and what are theiradaptive capacities?3. How can quantitative indicators help identify tribal nations and climate regions wherevulnerability is high enough to merit special concern?In order to address the aforementioned research questions this thesis will achieve five specificresearch objectives. The objectives of this research are to:1. Offer an organization of representative literature that enables the reader to betterunderstand the roots of vulnerability assessment methods.2. Identify and the most appropriate conceptual framework for assessing vulnerability.3. Operationalize a methodology that combines determinants of drought vulnerabilityusing existing climate data as well as proxy indicators of exposure, sensitivity andadaptive capacity so that accurate cross comparisons of 72 tribal nations can occur.4. Display final results in the form of vulnerability maps and spider diagrams.5. Provide insights into the causes of differences in vulnerability status as determined bythis assessment.The remainder of this document assumes the following organization. Chapter 2 identifiesthe seminal papers in vulnerability research and an organization of representative literature toenable the reader to have a strong understanding and theoretical foundation of vulnerability
15assessment and methods. Chapter 3 provides an overview of the ecological setting as well as thehistorical background of America’s indigenous people and current socioeconomic conditions.Chapter 4 details the step-by-step methodology applied in this thesis, including: i) the proceduresused to select the geographic study area and tribal nations, ii) the hypothesized functionalrelationship between sub-indicators and vulnerability, iii) the data sources used, iv) the rationalefor applying equal weights, and, v) the specific equations involved in normalizing data andaggregating composite indices so that consistent cross-tribal comparisons could be made. Chapter5 provides the results of the comparative vulnerability assessment for 72 tribal nations, reportedas exposure, sensitivity, adaptive capacity and vulnerability index scores and correspondingmaps. Followed by the results of relevant statistical analysis that helped validate the results arereported. Concluding the section with, the limitations of this research and areas for future work.Chapter 6 outlines the practical applications of this model. It also presents meaningful examplesof current tribal adaptation efforts underway on tribal lands. Finally, the ultimate conclusions arepresented.
16Chapt
the Voinovich School of Leadership and Public Affairs of Ohio University In partial fulfillment of the requirements for the degree Master of Science . Tribal nations1 in this semi-arid region are on the front lines of confronting several adverse effects of climate change, including extended drought, soil erosion, extreme heat events, flooding .