Transcription
Journal of Library Administration, 53:79–96, 2013Copyright Taylor & Francis Group, LLCISSN: 0193-0826 print / 1540-3564 onlineDOI: 10.1080/01930826.2013.756701NYPL Labs: Hacking the LibraryBEN VERSHBOWDownloaded by [New York Public Library] at 11:37 25 January 2013NYPL Labs, New York Public Library, New York, NY, USAABSTRACT. Over the past couple of years, The New York PublicLibrary has made significant strides in jumpstarting a digital humanities research program through the establishment of a curatorfocused, R&D technology unit called NYPL Labs. This article willexamine the first three projects produced by NYPL Labs, a trilogyof online experiments exploring methods of mining new humanities data sets from special collections material, and of translatingthe Library’s public mission to the Web via user collaboration andcrowdsourcing. In just two years, NYPL Labs has demonstratedhow much can be accomplished when technical resources are focused and procedural constraints loosened, though the challengesof sustaining this work are already becoming apparent as the teammust continue to innovate while maintaining a growing portfolioof projects.KEYWORDS digital humanities, research libraries, crowdsourcing, geographic information systems, skunkworks, New York PublicLibraryThe New York Public Library (NYPL) is a strange platypus: a sprawlingbranch library system, with 88 facilities serving neighborhoods across threeof the city’s five boroughs (Brooklyn and Queens, formerly separate towns,have independent systems), crowned by four research centers of international stature, with collections rivaling those of the world’s great academiclibraries. In contrast to their university counterparts, NYPL’s research librarieshave no resident faculty or student body. They are open and free to thepublic, serving a diverse array of independent researchers, artists, writersand miscellaneous autodidacts drawn to the exhaustive collections, deeparchives, free electronic resources and lofty spaces. In this respect, NYPLAddress correspondence to Ben Vershbow, Manager, NYPL Labs, New York PublicLibrary, 476 Fifth Ave., 2nd Floor, South Court, New York, NY 10018, USA. E-mail:benjaminvershbow@nypl.org79
Downloaded by [New York Public Library] at 11:37 25 January 201380B. Vershbowmore closely resembles the Library of Congress, the British Library, or anynumber of other national libraries, yet it is also a quintessentially New Yorkinstitution, conditioned by the dense urbanism and intellectual energies ofthe metropolis. And its collections, with notable concentrations in AngloAmerican literature, the performing arts and black culture, have been shapedindelibly by the literary, political, artistic and ethnic strands of the city’s history.The NYPL’s century-old flagship central branch, renamed the StephenA. Schwarzman Building in 2008, sits at the epicenter of midtown Manhattan (5th Avenue between 42nd and 40th Streets), on a site that at variouspoints in the layer cake of New York’s history held bodies (a potter’s field),20 million gallons of fresh water (the Croton Distributing Reservoir), a crystalpalace (Exhibition of the Industry of all Nations, 1853) and since 1910, one ofthe world’s great repositories of human knowledge, now totaling 4.5 millionbooks and over 60,000 linear feet of archival material.NYPL Labs (Labs), an unlikely crew of artists, hackers and liberal artsrefugees, works in the south courtyard, in a decade-old architectural insertiondug directly into the building’s foundation—like a bit of extra RAM slottedinto the aging library motherboard. Labs is a new group, several years in themaking but only acquiring full-time staff in the past year. Like many culturalorganizations still reeling from the digital shift, NYPL has undergone frequentreconfigurations of its technology staff in recent years, establishing large newteams with broad mandates only to dismantle and redistribute them after acouple of years as leaders came and went.Labs emerged amidst one such transition, as part of a strategic planningprocess that sought to better position the NYPL vis-à-vis the burgeoning fieldof Digital Humanities. Focusing on NYPL’s public mission and deep collections, the program was sketched with a heavy emphasis on user collaborationand open data, envisioning a kind of in-house technology startup that wouldventure proactively into the library in search of curatorial collaborations. Thework was envisioned as inherently inter-disciplinary, empowering curatorsto think more like technologists and interaction designers, and vice versa.Labs’ first round of investigations built directly on the foundations laidby a now shuttered unit called the Digital Library Program (DLP), whichhad served from roughly 2000–2008 as a soup-to-nuts digital production andcuration team, covering everything from scanning to metadata creation tosoftware development. Through the DLP’s efforts, NYPL digitized sizeableportions of its visual research material, making many of its most prizedcollections accessible on the open Web, along with lesser known curiosities.The great public legacy of this work is the NYPL Digital Gallery, whichlaunched in 2005 and remains heavily used to this day.The Digital Gallery marked the NYPL’s first major effort toward largescale public access to digitized content. Despite a few redesigns, and a nearquadrupling of the amount of material it provides, the site’s architecture
Downloaded by [New York Public Library] at 11:37 25 January 2013NYPL Labs81and user interface remain largely the same as when it launched seven yearsago. The site provides free, straightforward access to approximately 800,000digital images: one of the largest open cultural heritage repositories of itskind. There you can digitally peruse a wide range of visual marvels rangingthe full history of photography, and a dazzling range of prints, illustrationsand other visual documents.Given a strong directive to experiment, but with minimal access to theNYPL’s digital infrastructure (and without any remit to digitize new collections), NYPL Labs looked to the impressive legacy left by the DLP andimagined ways of going deeper with certain collections already available viathe Digital Gallery. These projects looked at digitization as a beginning, notan end, the first step in a process of remediation and user interaction thatmight lead to entirely new derivative collections and data sets native to thedigital medium. And, in the process, new experiences for the publics whoengage with them.THE MAP WARPER: HOW TO BUILD A TIME MACHINEThe sine qua non of Labs’ work is the Map Warper (2010), a project that predates the formation of the team and whose existence was crucial in makingthe case for establishing the curator-focused digital skunkworks1 that Labshas become today. The Warper project is helmed by a geospatial librarian2and like all but one of Labs’ six members, he comes from a non-library background, having studied art and cartography, but his hybrid sensibility makeshim an ideal curator for a collection so uniquely poised for digital transformation. The art and science of mapping have undergone a revolution inthe digital era that can hardly be overstated. The most quotidian interactionswith maps today draw upon startling convergences of data that allow us toquery a vast range of information within the frame of a specific locale.In Google Maps, for instance, or any comparable digital map service,one can search for “Soho NYC” and be dropped directly into this neighborhood on the western part of lower Manhattan between Houston and CanalStreets. From there one can view up-to-the-minute traffic conditions, overlaypublic transit routes, bring up user-generated photos of the area, even checkthe local weather conditions. One can also search for restaurants, banks,shops, theaters, etc., and read reviews and ratings of these places—even doa virtual walk of the storefronts. And all of this is via an intuitive interface inwhich the Earth is rendered as a seamless spatial canvas through which onepans, zooms and queries. Today this startling ability is commonplace. It ishow we expect maps to work.These advances in geospatial technology led to an extended thoughtexperiment for the Labs team: could a historical equivalent be built (at leastfor New York City) of Google Maps (or more properly, its open source
Downloaded by [New York Public Library] at 11:37 25 January 201382B. Vershbowcompetitor, Open Street Map)? Essentially, a digital map interface with a“go back in time” function, allowing you to compare changes in the urbanlandscape over the years. Imagine if the Library’s vast quantities of New YorkCity historical source material could be retrievable through such an interface.The mind boggles when one extrapolates outward because what is being imagined is a kind of time machine: detailed, drillable layers of urbanhistory down to the individual address or landmark. And when the lensexpands outward to include other library collections with a geographicaldimension (both at NYPL and beyond)—residential and business directories, local newspapers and periodicals, literary archives, corporate records,photographs, prints, menus, playbills, church registries, the list goes on—onebegins to see an intricate needlework of inter-stitched data, cross-referencingthrough time and space.Within the NYPL Digital Gallery today one can explore thousands ofdigitized New York City maps, originally published by fire insurance orreal estate companies, whose businesses depended on fastidiously detailedrecords of the City’s layout and architecture down to the individual structures.Taken in the aggregate, these maps comprise a dazzlingly granular data setof the built environment of New York City going back hundreds of years.But scanning the maps does not automatically give you access to this data.A simple geographic query in the Digital Gallery, say for “Wall Street,”illustrates the limitations of the available bibliographic records. Atlas sheetsof lower Manhattan with Wall Street running right down the middle of thepage often, frustratingly, will fail to turn up in the results. The metadatatends to contain only the bounding streets of the handful of square blocksdepicted on a single sheet: the data on the edges. Information on such edgesis in relatively good supply since it is by these edges that the traditional userof a bound atlas volume has to mentally stitch together geography that hasbeen sliced and diced into paged denominations. But maps, in their essence,are not naturally codex-shaped. They contain many nested edges, an infinitenumber of possible frames of inquiry, and the names of interior streets are justthe tip of the massive iceberg of submerged data—street addresses, namedlandmarks and building footprints with all their related attributes (e.g., woodstructure, three stories, commercial use, etc.)—that can be extracted onlyafter the maps have been digitized. To get at this data, Labs created the MapWarper (2010).The Map Warper toolkit, developed by an external geospatial technology firm called Topomancy, is an open source, Web-based alternative tocommercial software such as ArcGIS designed to create, compile and analyzegeographical data. The Map Warper is used heavily by Map Division staff,and also by members of the public, who are invited to create an account andlearn to work with our maps through a video tutorial. Or, if based in NewYork, users can learn directly from staff in our Citizen Cartography workshops, held on a roughly monthly basis in the Map Division reading room.
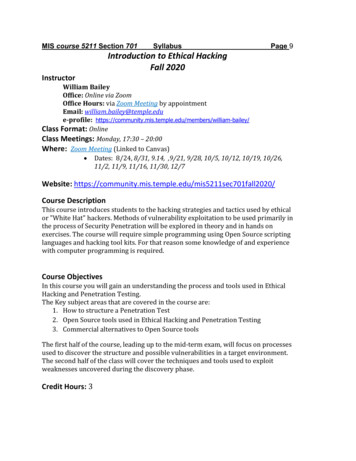
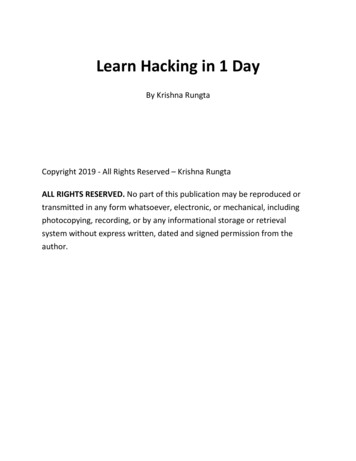
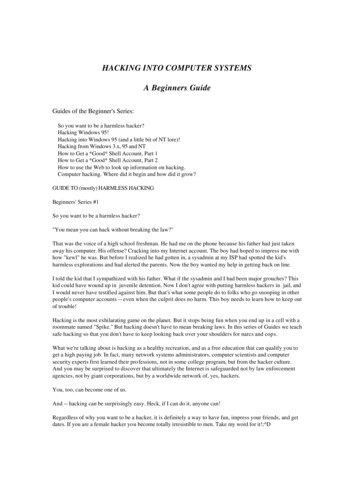
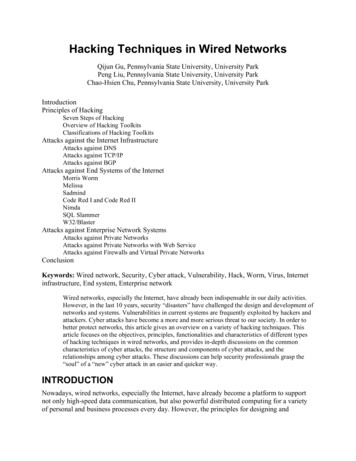
Downloaded by [New York Public Library] at 11:37 25 January 2013NYPL Labs83With the help of a generous grant from the National Endowment forthe Humanities, tens of thousands of NYC atlas sheets have been digitizedin recent years and fed not only into the Digital Gallery, but into the MapWarper, where, through a series of manipulations, they are enriched withspatial reference information.Here is how it works: once maps have been scanned and converted tohigh resolution digital images, users (both Map Division staff and interestedmembers of the public) walk the maps through a process of “georectification.” Also known as “rubbersheeting” or “warping,” georectifying is theprocess of aligning pixels on an old map to precise latitude/longitude pointson a contemporary virtual map. Given the high precision of the insuranceatlases, the process works remarkably well, resulting in near-perfect syncedhistorical maps that can be viewed against today’s geography. (See Figure 1).After warping, users then crop away page borders and any other nonmap information and proceed to tie the atlas sheets into comprehensivelayers. This is when the maps truly begin to transcend their original format:the books are unbound, their pages laid across the geography they describe.For example, an 1854 New York street atlas created for insurance companiesby the civil engineer and surveyor William Perris, becomes Layer 861. (SeeFigure 2.) This layer appears as a seamless canvas of streets, blocks andbuildings that lies across Manhattan Island like a quilt running from theBattery up to 42nd Street (calling to mind Borges’ famous parable of themap so exhaustively accurate that it literally draped itself across the territoryat a scale of one to one). This layer is a new type of library resource: aFIGURE 1 Rectified Map of Several Square Blocks in Lower Manhattan, 1857. (Color figureavailable online).
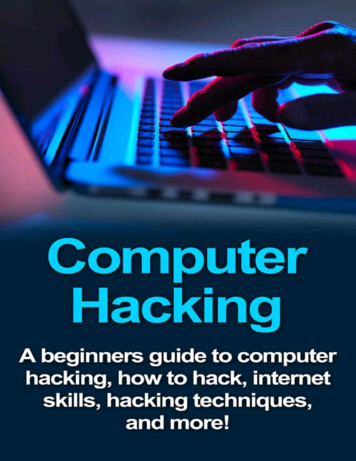
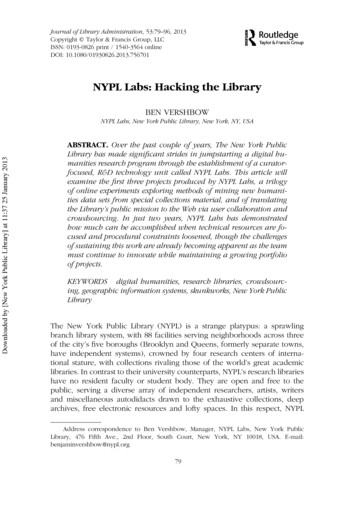
Downloaded by [New York Public Library] at 11:37 25 January 201384B. VershbowFIGURE 2 William Perris Street Atlas (1854–55) in Google Earth. (Color figure availableonline).skein of historical geodata that can be freely downloaded and explored inprograms such as Google Earth or Quantum GIS, and potentially mashed upwith other data sets.But warping, cropping and layering are just, as it were, the groundwork. Next comes the real time-eater: capturing by hand (via polygon tracing tools and text transcription) the vast quantities of information containedin the maps which are readily viewable to the human eye, but invisibleto machines. In GIS parlance, this is called digitizing “features” from themaps—rendering them in machine-readable forms. In the case of the NYCatlases, the features include ward boundaries, landmarks and points of interest, hyrdrography, building footprints, addresses, and anything else the mapmay convey via writing, color coding or other markings. Great strides havebeen made in harvesting these sorts of data from the afore-mentioned 1854William Perris atlas (Layer 861). As of this writing, over 58,000 building footprints, with their corresponding attributes, have been traced from the georectified map mosaic. This represents yet another derivative resource, anotherskein of data that can be visualized, analyzed and referenced in the digitaldatascape (see Figures 3 and 4).
Downloaded by [New York Public Library] at 11:37 25 January 2013NYPL Labs85FIGURE 3 Abstraction of William Perris 1854 Building Data in QGIS.NYPL Labs and Topomancy are now at work on a spin-off project: ageographical index, or gazetteer, of historical New York City. This databaseand Web service, provisionally titled “NYC Chronology of Place,” will containplace names and geospatially bounded locations going back to the beginnings of the city’s recorded history. It will aggregate both existing publicdata sets such as GeoNames, Open Street Map, and historical county andward boundaries, as well as the fine-grained, hand-gathered features fromthe Map Warper, tracking changes to the built environment over time. Thegazetteer will function both as a Web-based directory of New York’s geographical past, and as a historical georefencing service: a tool for placingpins on maps, not only in specific places, but specific times.
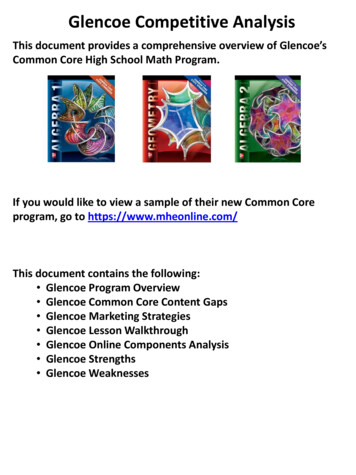
Downloaded by [New York Public Library] at 11:37 25 January 201386B. VershbowFIGURE 4 Detail of Layer 861 Building Data Viewed as Overlay in Google Earth. (Colorfigure available online).However, the vast majority of feature digitization has been within maplayer 861, covering approximately eight square miles of Manhattan Islandin 1854. To continue harvesting data at this level of detail and to populatethe gazetteer, Labs will have to ramp up the crowdsourcing efforts aroundthe project, which at this point are relatively modest. Though there havebeen notable successes (one user, for instance, single-handedly georectifiednearly an entire Brooklyn street atlas, well over 200 sheets), public participation is currently more of a supplement to work carried out steadily byMap Division staff. The Labs team is currently doing some initial work onmaking these currently expert-level tools a little more user-friendly, and evencontemplating more game-like experiences to engage a broader audience.WHAT’S ON THE MENU?: DEEPER INTO CROWDSOURCINGThe next project that took shape, and the first to be launched formally underthe Labs rubric, put user collaboration more squarely in its sights.The menu archive, begun by a donation from Miss Frank E. Buttolph,is one of those testaments to the wildly omnivorous collecting carried outby The New York Public Library in its more than a century of existence.
Downloaded by [New York Public Library] at 11:37 25 January 2013NYPL Labs87Comprising more than 45,000 items going back to the 1840s and the originsof public dining culture, it is the largest collection of its kind, with particularstrengths in New York City in the late 19th and early 20th centuries.The collection has always been popular, playing a prominent role intwo major NYPL exhibitions in the past decade alone: “New York Eats Out,”curated by former New York Times food critic William Grimes, whose bookAppetite City, on the origins of New York restaurant culture, is based heavilyin research carried out in the NYPL’s menu archive; and the currently running“Lunch Hour NYC.”Culinary and social historians consult the collection frequently, as donovelists looking for period detail (e.g., the price of a pint of beer on theBowery in 1870), and of course chefs seeking gastronomic inspiration. Formost of the collection’s history menus were arranged in boxes by date, andfor years this was the only way researchers could request them. A decade orso ago, on-site volunteers created bibliographic records for approximatelytwo thirds of the menus, resulting in an online database where users couldquery by keyword, enabling them to search for particular restaurants, socialorganizations or other peculiarities, and to request specific menus by callnumber.Anyone wanting to investigate the actual food in the menus, however,had to pore through them by hand and see what they stumbled upon. Therewas no way to ask questions of the collection as a whole, for example, torequest all menus with “abalone” or “macaroni,” or to observe the changingprice of coffee over the decades, or to uncover the first appearance ofinstant coffee or diet soda. A few researchers had made such queries theold-fashioned way: going through thousands of menus individually by hand.In 2005, an oceanographer from Texas A&M University meticulously tracedthe fluctuating prices of seafood over decades of menus, making inferencesregarding the health of local fisheries over time. A culinary historian fromYale University conducted a close reading of thousands of late 19th centuryNew York hotel menus to paint a more nuanced picture of high-end diningin that era.But to all but these brave few, the archive remained opaque, its datariches still largely untapped, despite the fact that nearly a quarter of thecollection was freely available online via the NYPL Digital Gallery. A librarian,who specializes in culinary collections, along with the curator of the RareBook Division3 (where the menu collection is housed), began to look intowhat it would take to get full-text access to this already digitized set ofmenus.OCR (optical character recognition) scanning would undoubtedly getusable output from a portion of the menus. But many items are handwritten,or printed in idiosyncratic type fonts or fanciful layouts. Moreover, as initialconversations progressed in Labs, we agreed that what was of most interestwas building a structured data set out of the menus, where each individual
Downloaded by [New York Public Library] at 11:37 25 January 201388B. Vershbowdish had an instance (and, frequently, a relationship to a price), and thatthese instances could be tracked, aggregated and visualized. Given theseaims, manual transcription into a predefined schema seemed the best wayto produce a high quality data set. But who would carry out this immensework? Drawing on our modest user collaboration through the Map Warper,and considering the persistent public interest in the menus (and in all thingsculinary), this seemed like the ideal project to push the crowdsourcing experiment further. And so What’s on the Menu? (WOTM) was born (2011a).A no frills beta version launched in late April of 2011 and was animmediate success. From the get-go, Labs had made usability of the coretranscription tool the top priority (see Figure 5). We were banking on thetask being not only simple and easy, but ideally fun (and maybe even a littlebit addictive). Technical resources were tightly limited (the WOTM menuwas built entirely as a spare time project by a few developers on NYPL’sWeb team), and there was no official project staff (as in the Map Division) tokeep the work going if public participation waned. So getting the tool right,and broadcasting a clear motivational message (“Help The New York PublicLibrary improve a unique collection”), were essential. Taking the pulse ofthe Twitter feeds in the days and weeks following launch, and observinghow quickly users were making their way through the menus, Labs knew ithad hit the mark.By mid-summer, Labs was nearly finished with the initial batch of digitized menus and were scrambling to begin moving the rest of the collectionin the direction of the scanners. The sudden real-time public demand forfresh digital content was something NYPL had never experienced in quiteFIGURE 5 Menu Transcription Interface. (Color figure available online).
Downloaded by [New York Public Library] at 11:37 25 January 2013NYPL Labs89this way, where there was something very specific users wanted to do withthe collection, and right now. The site continued to draw attention frompress, blogs and social media. A class of deaf fourth graders in San Antoniowere even using the site to practice typing skills. It was no small feat tore-prioritize digitization queues, re-assign staff, and establish a reliable newprocess for maintaining steady stream of new menu content to the site amidstcompeting priorities. And although these efforts were largely successful,thanks in part to generous start-up assistance from the National Endowmentfor the Humanities and the Institute of Museum and Library Services, Labsstill periodically had to endure content droughts, sometimes a week or more,during which we would be assailed by benevolently impatient emails andtweets from the hard core users.Unlike the Map Warper, which requires users to create an account in order to take part in the georectification and feature digitization tasks, WOTMdoes not require (or even offer) registration. This was a deliberate choice atthe outset, to keep the barriers to participation as low as possible. Labs builtin basic security measures using browser session tracking to prevent abuseor malicious scripts. To this day, we have seen virtually no instances of vandalism and the general quality of transcription is exceptionally high. Menusgo through a basic workflow. “New” menus are fresh from the scanners andready to be transcribed. When a user finishes a menu, they promote it to the“Under Review” category, where it remains editable and project interns andother users can look it over for mistakes or missing data. From there, it getsnudged into the “Done” pile, where editing is turned off. Users can alwaysemail the site administrators if they spot further errors, and the menu’s statuscan be changed.Despite the success of the low-barrier approach, the staff in Labs sometimes lament that we were not better able to recognize the contributions ofthe top transcribers, or to develop a hierarchy of tasks where more challenging work might be offered to the more experienced participants. Beyondraw analytics, all of the user stories are anecdotal, but we do neverthelesshave a sense that the project tends to attract people with a strong culinaryor library science interest, that our most vocal users (the ones who mostfrequently email us with software bugs, bibliographic errors or clamoring fornew menus) are women, and that judging by the traffic logs, transcriptionhappens all throughout the day. We also know through Web analytics thatthe project, while drawing predominantly from the English-speaking world(about 75% United States), has an audience that far transcends New York. Alittle less than a quarter of overall visits originate within the state.Building on the Map Warper’s success, WOTM has undoubtedly impacted the internal conversation at NYPL around digital strategy, user engagement and collections policy. It has helped shift the attention, at least inpart, away from static online exhibitions, which notoriously struggle to retain users’ attention, toward participation-oriented Web sites with longer life
Downloaded by [New York Public Library] at 11:37 25 January 201390B. Vershbowcycles, involving the public in the grand (if painstaking) work of buildingthe digital library. It has also jumpstarted policy discussions around usercontributed content and its relation to Library-authored metadata.In the spring of 2012, with the Labs team established, the new developers began a total revamp of the WOTM site. The functionality of thetranscription tool in it was good, but the beta version lacked features thatwould enable users to browse, search and visualize the collection, and theenormous heap of data that had been harvested from it. There was also acertain amount of “technical debt,” incurred from the quick-sketch coding ofthe pilot phase, that had to be paid down in order to get the site on a moresustainable track.The new WOTM site (see Figure 6), redesigned and re-engineered,also offered users access to the data set in a variety of ways. Bi-weeklyexports (containing all dishes, prices, page coordinates, and bibliographicdata for each menu) are available for download. Labs also created NYPL’sfirst publicly promoted API (application programming interface), providingmore technically advanced users programmatic access into the data set. Inthe months since release, dozens of requests have come in for API access,FIGURE 6 The Revamped WOTM. (Color figure available online).
NYPL Labs91Downloaded by [New York Public Library] at 11:37 25 January 2013representing initial interest from a variety of constituencies ranging fromfood-focused tech startups, to computational linguistics researchers, to journalists, to library and museum hackers.The future applications of the WOTM data remain to be seen. Undoubtedly, the crowdsourcing effort has raised the profile of the collection manytimes over, landing it frequently in the press over the past two years, andconsistently generating small ripples through the culinary and techie socialmedia subcultures. It also has radically enhanced the accessibility of the collection. A perusal of keyword-driven traffic to the site reveals a plethora offascinatingly obscure “long-tail” searches that have brought users serendipitously to our menus: “eggs argenteuil”—a scrambled egg preparation found in 1910, reappearingin 1961 (88 visits); “remus fizz”—a citrusy gin cocktail with egg whites, mid-century (40 visits); “moskowitz and lupowitz”—a vanished Romanian-Jewish eatery from theLower East Side (23 visits); “ss Homeric”—an ocean liner, originally German, relinquished to Britainas war reparations in 1919 (16 visits).By these and other measures, we can witness the collection’s weaving intothe fabric of the Web.THE STEREOGRANIMATOR: REMIXING COLLECTIONSCompleting the trilogy of projects diving deeper into existing digital collections, the Stereogranimator (2012) stands out of the NYPL Labs portfolioin that it was inspired not by a curator but by a user. Joshua Heinemann,a San Francisco-based artist and writer, had caught the attention of NYPLLabs several years ago with a delightful art project on his Web site, CursiveBuildings. Rolled out gradually over several years, “Reaching for the Out ofReach” (2009) is a series of eerie, flickering animations, rolled out graduallyover several years, created out of the NYPL’s vast collection of stereographicphotography. Stereographs are pairs of images taken from slightly different angles, recreating binocular vision to produce an arresting 3D effect.Without a handheld stereoscope device, however, the images appear flatand two-dimensional, and it is in this diminished artifactual form that theyare presented on the NYPL Digital Gallery—over 40,000 in total. Like themap and menu collections, with their valuable but difficult-to-extract data,the digitized stereographs, despite now being more accessible via the Web,were as remote as ever from their original intended user experience.Heinemann’s idea was to reacquaint the viewer with the original immersive nature of the images in a Web-native way. To do this, he employed
Downloaded by [New York Public Library] at 11:37 25 January 201392B. Vershbowone of the oldest and hardiest forms of Internet multimedia: the animatedgif. Animated gifs are nothing more than a sequence of two or more images,typically run as an infinite loop. In the early days of the Web, long beforeFlash, HTML 5 or streaming video, animated gifs were wildly popular withthe stewards of hand-crafted HTML home pages, adding a splash of visual
NYPL Labs: Hacking the Library BEN VERSHBOW NYPL Labs, New York Public Library, New York, NY, USA ABSTRACT. Over the past couple of years, The New York Public Library has made significant strides in jumpstarting a digital hu-manities research program through the establishment of a curator-focused, R&D technology unit called NYPL Labs. This .