Transcription
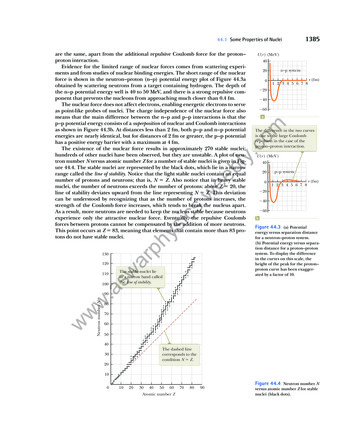
44.1 Some Properties of NucleiU(r ) (MeV)40n–p system2001 2 3 4 5 6 7 8r (fm)204060aomare the same, apart from the additional repulsive Coulomb force for the proton–proton interaction.Evidence for the limited range of nuclear forces comes from scattering experiments and from studies of nuclear binding energies. The short range of the nuclearforce is shown in the neutron–proton (n–p) potential energy plot of Figure 44.3aobtained by scattering neutrons from a target containing hydrogen. The depth ofthe n–p potential energy well is 40 to 50 MeV, and there is a strong repulsive component that prevents the nucleons from approaching much closer than 0.4 fm.The nuclear force does not affect electrons, enabling energetic electrons to serveas point-like probes of nuclei. The charge independence of the nuclear force alsomeans that the main difference between the n–p and p–p interactions is that thep–p potential energy consists of a superposition of nuclear and Coulomb interactionsas shown in Figure 44.3b. At distances less than 2 fm, both p–p and n–p potentialenergies are nearly identical, but for distances of 2 fm or greater, the p–p potentialhas a positive energy barrier with a maximum at 4 fm.The existence of the nuclear force results in approximately 270 stable nuclei;hundreds of other nuclei have been observed, but they are unstable. A plot of neutron number N versus atomic number Z for a number of stable nuclei is given in Figure 44.4. The stable nuclei are represented by the black dots, which lie in a narrowrange called the line of stability. Notice that the light stable nuclei contain an equalnumber of protons and neutrons; that is, N 5 Z. Also notice that in heavy stablenuclei, the number of neutrons exceeds the number of protons: above Z 5 20, theline of stability deviates upward from the line representing N 5 Z. This deviationcan be understood by recognizing that as the number of protons increases, thestrength of the Coulomb force increases, which tends to break the nucleus apart.As a result, more neutrons are needed to keep the nucleus stable because neutronsexperience only the attractive nuclear force. Eventually, the repulsive Coulombforces between protons cannot be compensated by the addition of more neutrons.This point occurs at Z 5 83, meaning that elements that contain more than 83 protons do not have stable nuclei.1385U(r ) (MeV)40eebly.cThe difference in the two curvesis due to the large Coulombrepulsion in the case of theproton–proton interaction.200110r (fm)4060bFigure 44.3 (a) Potentialenergy versus separation distancefor a neutron–proton system.(b) Potential energy versus separation distance for a proton–protonsystem. To display the differencein the curves on this scale, theheight of the peak for the proton–proton curve has been exaggerated by a factor of 10.a1001 2 3 4 5 6 7 820s.wicysThe stable nuclei liein a narrow band calledthe line of stability.sw120arph130p–p systemwwNeutron number Nw908070605040The dashed linecorresponds to thecondition N Z.3020100102030405060Atomic number Z708090Figure 44.4 Neutron number Nversus atomic number Z for stablenuclei (black dots).
1386Chapter 44Nuclear Structure44.2 Nuclear Binding EnergyomAs mentioned in the discussion of 12C in Section 44.1, the total mass of a nucleusis less than the sum of the masses of its individual nucleons. Therefore, the restenergy of the bound system (the nucleus) is less than the combined rest energy ofthe separated nucleons. This difference in energy is called the binding energy ofthe nucleus and can be interpreted as the energy that must be added to a nucleusto break it apart into its components. Therefore, to separate a nucleus into protonsand neutrons, energy must be delivered to the system.Conservation of energy and the Einstein mass–energy equivalence relationshipshow that the binding energy Eb in MeV of any nucleus isEb 5 [ZM(H) 1 Nmn 2 M(AZ X)] 3 931.494 MeV/uBinding energy of a nucleus (44.2)eebly.cwhere M(H) is the atomic mass of the neutral hydrogen atom, m n is the mass of theneutron, M(AZ X) represents the atomic mass of an atom of the isotope AZ X, and themasses are all in atomic mass units. The mass of the Z electrons included in M(H)cancels with the mass of the Z electrons included in the term M(AZ X) within a smalldifference associated with the atomic binding energy of the electrons. Becauseatomic binding energies are typically several electron volts and nuclear bindingenergies are several million electron volts, this difference is negligible.A plot of binding energy per nucleon Eb /A as a function of mass number A forvarious stable nuclei is shown in Figure 44.5. Notice that the binding energy in Figure 44.5 peaks in the vicinity of A 5 60. That is, nuclei having mass numbers eithergreater or less than 60 are not as strongly bound as those near the middle of the periodic table. The decrease in binding energy per nucleon for A . 60 implies that energyis released when a heavy nucleus splits, or fissions, into two lighter nuclei. Energy isreleased in fission because the nucleons in each product nucleus are more tightlybound to one another than are the nucleons in the original nucleus. The important process of fission and a second important process of fusion, in which energy isreleased as light nuclei combine, shall be considered in detail in Chapter 45.Pitfall Prevention 44.2swarphysics.wBinding Energy When separatenucleons are combined to form anucleus, the energy of the systemis reduced. Therefore, the changein energy is negative. The absolutevalue of this change is called thebinding energy. This differencein sign may be confusing. Forexample, an increase in bindingenergy corresponds to a decrease inthe energy of the i to the right of208Pb are unstable.107AgMo567Binding energy pernucleon (MeV)Ge988572359wwThe region of greatestbinding energy per nucleonis shown by the tan band.208Pb127I159Tb226Ra197Au238UNBBe32Figure 44.5 inding energyBper nucleon versus mass numberfor nuclides that lie along the lineof stability in Figure 44.4. Somerepresentative nuclides appear asblack dots with labels.2100H20406080100 120 140Mass number A160180200220240
44.3 Nuclear Modelseebly.comAnother important feature of Figure 44.5 is that the binding energy per nucleonis approximately constant at around 8 MeV per nucleon for all nuclei with A . 50.For these nuclei, the nuclear forces are said to be saturated, meaning that in theclosely packed structure shown in Figure 44.2, a particular nucleon can formattractive bonds with only a limited number of other nucleons.Figure 44.5 provides insight into fundamental questions about the origin of thechemical elements. In the early life of the Universe, the only elements that existedwere hydrogen and helium. Clouds of cosmic gas coalesced under gravitationalforces to form stars. As a star ages, it produces heavier elements from the lighterelements contained within it, beginning by fusing hydrogen atoms to form helium.This process continues as the star becomes older, generating atoms having largerand larger atomic numbers, up to the tan band shown in Figure 44.5.The nucleus 6328Ni has the largest binding energy per nucleon of 8.794 5 MeV.It takes additional energy to create elements with mass numbers larger than 63because of their lower binding energies per nucleon. This energy comes from thesupernova explosion that occurs at the end of some large stars’ lives. Therefore, allthe heavy atoms in your body were produced from the explosions of ancient stars.You are literally made of stardust!44.3 Nuclear ModelsysThe Liquid-Drop Modelics.wThe details of the nuclear force are still an area of active research. Several nuclearmodels have been proposed that are useful in understanding general features ofnuclear experimental data and the mechanisms responsible for binding energy.Two such models, the liquid-drop model and the shell model, are discussed below.swarphIn 1936, Bohr proposed treating nucleons like molecules in a drop of liquid. In thisliquid-drop model, the nucleons interact strongly with one another and undergofrequent collisions as they jiggle around within the nucleus. This jiggling motion isanalogous to the thermally agitated motion of molecules in a drop of liquid.Four major effects influence the binding energy of the nucleus in the liquiddrop model:www.a The volume effect. Figure 44.5 shows that for A . 50, the binding energy pernucleon is approximately constant, which indicates that the nuclear force ona given nucleon is due only to a few nearest neighbors and not to all the othernucleons in the nucleus. On average, then, the binding energy associatedwith the nuclear force for each nucleon is the same in all nuclei: that associated with an interaction with a few neighbors. This property indicates thatthe total binding energy of the nucleus is proportional to A and thereforeproportional to the nuclear volume. The contribution to the binding energyof the entire nucleus is C1A, where C1 is an adjustable constant that can bedetermined by fitting the prediction of the model to experimental results. The surface effect. Because nucleons on the surface of the drop have fewerneighbors than those in the interior, surface nucleons reduce the bindingenergy by an amount proportional to their number. Because the numberof surface nucleons is proportional to the surface area 4pr 2 of the nucleus(modeled as a sphere) and because r 2 A 2/3 (Eq. 44.1), the surface term canbe expressed as 2C 2 A 2/3, where C 2 is a second adjustable constant. The Coulomb repulsion effect. Each proton repels every other proton in thenucleus. The corresponding potential energy per pair of interacting protonsis kee 2/r, where ke is the Coulomb constant. The total electric potential energyis equivalent to the work required to assemble Z protons, initially infinitely farapart, into a sphere of volume V. This energy is proportional to the number1387
1388Chapter 44 Nuclear Structure35Cl107Ag208PbAdding these contributions gives the following expression for the total bindingenergy:.c81N 2 Z 22Z 1Z 2 122C4A1/3A(44.3)eebE b 5 C 1A 2 C 2 A2/3 2 C 3ly64This equation, often referred to as the semiempirical binding-energy formula,contains four constants that are adjusted to fit the theoretical expression to experimental data. For nuclei having A 15, the constants have the values2s.w2HC 1 5 15.7 MeV0C 2 5 17.8 MeVC 3 5 0.71 MeV C 4 5 23.6 MeV100200Mass number AEquation 44.3, together with these constants, fits the known nuclear mass valuesvery well as shown by the theoretical curve and sample experimental values in Figure 44.6. The liquid-drop model does not, however, account for some finer detailsof nuclear structure, such as stability rules and angular momentum. Equation 44.3is a theoretical equation for the binding energy, based on the liquid-drop model,whereas binding energies calculated from Equation 44.2 are experimental valuesbased on mass measurements.icBinding energy per nucleon (MeV)10omof proton pairs Z(Z 2 1)/2 and inversely proportional to the nuclear radius.Consequently, the reduction in binding energy that results from the Coulombeffect is 2C 3Z(Z 2 1)/A1/3, where C 3 is yet another adjustable constant. The symmetry effect. Another effect that lowers the binding energy is relatedto the symmetry of the nucleus in terms of values of N and Z. For small valuesof A, stable nuclei tend to have N Z. Any large asymmetry between N and Zfor light nuclei reduces the binding energy and makes the nucleus less stable.For larger A, the value of N for stable nuclei is naturally larger than Z. Thiseffect can be described by a binding-energy term of the form 2C 4(N 2 Z)2/A,where C 4 is another adjustable constant.1 For small A, any large asymmetrybetween values of N and Z makes this term relatively large and reduces thebinding energy. For large A, this term is small and has little effect on the overall binding energy.Figure 44.6arphysThe bindingenergy curve plotted by using thesemiempirical binding-energy formula (red-brown). For comparisonto the theoretical curve, experimental values for four samplenuclei are shown.swExample 44.3 Applying the Semiempirical Binding-Energy FormulawSolution.aThe nucleus 64Zn has a tabulated binding energy of 559.09 MeV. Use the semiempirical binding-energy formula togenerate a theoretical estimate of the binding energy for this nucleus.wConceptualize Imagine bringing the separate protons and neutrons together to form a 64Zn nucleus. The rest energy ofwthe nucleus is smaller than the rest energy of the individual particles. The difference in rest energy is the binding energy.Categorize From the text of the problem, we know to apply the liquid-drop model. This example is a substitutionproblem.For the 64Zn nucleus, Z 5 30, N 5 34, and A 5 64. Evaluate the four terms of the semiempirical binding-energyformula:C 1 A 5 (15.7 MeV)(64) 5 1 005 MeVC 2 A 2/3 5 (17.8 MeV)(64)2/3 5 285 MeVC3C41 30 2 1 29 2Z 1Z 2 125 1 0.71 MeV 25 154 MeV1/31 64 2 1/3A1 34 2 30 2 21N 2 Z 225 1 23.6 MeV 25 5.90 MeV64A1The liquid-drop model describes that heavy nuclei have N . Z. The shell model, as we shall see shortly, explains whythat is true with a physical argument.
44.3 Nuclear Models1389 44.3 c o n t i n u e dE b 5 1 005 MeV 2 285 MeV 2 154 MeV 2 5.90 MeV 5 560 MeVSubstitute these values into Equation 44.3:This value differs from the tabulated value by less than 0.2%. Notice how the sizes of the terms decrease from the firstto the fourth term. The fourth term is particularly small for this nucleus, which does not have an excessive number ofneutrons.The Shell Modeleebly.c Most stable nuclei have an even value of A. Furthermore, only eight stablenuclei have odd values for both Z and N. Figure 44.7 shows a graph of the difference between the binding energy pernucleon calculated by Equation 44.3 and the measured binding energy. Thereis evidence for regularly spaced peaks in the data that are not described by thesemiempirical binding-energy formula. The peaks occur at values of N or Zthat have become known as magic numbers:omThe liquid-drop model describes the general behavior of nuclear binding energiesrelatively well. When the binding energies are studied more closely, however, wefind the following features:(44.4)s.wZ or N 5 2, 8, 20, 28, 50, 82WWMagic numbersarphysic High-precision studies of nuclear radii show deviations from the simpleexpression in Equation 44.1. Graphs of experimental data show peaks in thecurve of radius versus N at values of N equal to the magic numbers. A group of isotones is a collection of nuclei having the same value of N and varying values of Z. When the number of stable isotones is graphed as function ofN, there are peaks in the graph, again at the magic numbers in Equation 44.4. Several other nuclear measurements show anomalous behavior at the magicnumbers.2.aswThese peaks in graphs of experimental data are reminiscent of the peaks in Figure42.20 for the ionization energy of atoms, which arose because of the shell structureof the atom. The shell model of the nucleus, also called the i ndependent-particlemodel, was developed independently by two German scientists: Maria GoeppertMayer in 1949 and Hans Jensen (1907–1973) in 1950. Goeppert-Mayer and JensenDifference between measuredand predicted binding energyper nucleon (MeV)wwwThe appearance of regular peaksin the experimental data suggestsbehavior that is not predicted inthe liquid-drop model.0.200.10N 50N 82Z 50N 126Z 820.00Figure 44.70.100.202ForN 28Z 2850100150Mass number A200250further details, see chapter 5 of R. A. Dunlap, The Physics of Nuclei and Particles, Brooks/Cole, Belmont, CA, 2004. T he differencebetween measured binding energies and those calculated from theliquid-drop model as a function ofA. (Adapted from R. A. Dunlap,The Physics of Nuclei and Particles,Brooks/Cole, Belmont, CA, 2004.)
Nuclear StructureMaria Goeppert-Mayer.cGerman Scientist (1906–1972)ics.weeblyGoeppert-Mayer was born and educated in Germany. She is best knownfor her development of the shell model(independent-particle model) of thenucleus, published in 1950. A similarmodel was simultaneously developedby Hans Jensen, another Germanscientist. Goeppert-Mayer and Jensenwere awarded the Nobel Prize in Physics in 1963 for their extraordinarywork in understanding the structureof the nucleus.arphysThe energy levels for theprotons are slightly higherthan those for the neutronsbecause of the electricpotential energy associatedwith the system of protons.Energyswprwww.anshared the 1963 Nobel Prize in Physics for their work. In this model, each nucleonis assumed to exist in a shell, similar to an atomic shell for an electron. The nucleons exist in quantized energy states, and there are few collisions between nucleons.Obviously, the assumptions of this model differ greatly from those made in theliquid-drop model.The quantized states occupied by the nucleons can be described by a set of quantum numbers. Because both the proton and the neutron have spin 12, the exclusionprinciple can be applied to describe the allowed states (as it was for electrons inChapter 42). That is, each state can contain only two protons (or two neutrons)having opposite spins (Fig. 44.8). The proton states differ from those of the neutronsbecause the two species move in different potential wells. The proton energy levelsare farther apart than the neutron levels because the protons experience a superposition of the Coulomb force and the nuclear force, whereas the neutrons experience only the nuclear force.One factor influencing the observed characteristics of nuclear ground states isnuclear spin–orbit effects. The atomic spin–orbit interaction between the spin of anelectron and its orbital motion in an atom gives rise to the sodium doublet discussed in Section 42.6 and is magnetic in origin. In contrast, the nuclear spin–orbit effect for nucleons is due to the nuclear force. It is much stronger than in theatomic case, and it has opposite sign. When these effects are taken into account,the shell model is able to account for the observed magic numbers.The shell model helps us understand why nuclei containing an even number ofprotons and neutrons are more stable than other nuclei. (There are 160 stable even–even isotopes.) Any particular state is filled when it contains two protons (or twoneutrons) having opposite spins. An extra proton or neutron can be added to thenucleus only at the expense of increasing the energy of the nucleus. This increasein energy leads to a nucleus that is less stable than the original nucleus. A carefulinspection of the stable nuclei shows that the majority have a special stability whentheir nucleons combine in pairs, which results in a total angular momentum of zero.The shell model also helps us understand why nuclei tend to have more neutronsthan protons. As in Figure 44.8, the proton energy levels are higher than those forneutrons due to the extra energy associated with Coulomb repulsion. This effectbecomes more pronounced as Z increases. Consequently, as Z increases and higherstates are filled, a proton level for a given quantum number will be much higherin energy than the neutron level for the same quantum number. In fact, it will beeven higher in energy than neutron levels for higher quantum numbers. Hence, itis more energetically favorable for the nucleus to form with neutrons in the lowerenergy levels rather than protons in the higher energy levels, so the number of neutrons is greater than the number of protons.More sophisticated models of the nucleus have been and continue to be developed. For example, the collective model combines features of the liquid-drop andshell models. The development of theoretical models of the nucleus continues to bean active area of research.omScience Source1390 Chapter 44a A1/3Figure 44.8a A1/3 square potentialAwell containing 12 nucleons. Thered spheres represent protons,and the gray spheres representneutrons.44.4 RadioactivityIn 1896, Becquerel accidentally discovered that uranyl potassium sulfate crystalsemit an invisible radiation that can darken a photographic plate even though theplate is covered to exclude light. After a series of experiments, he concluded thatthe radiation emitted by the crystals was of a new type, one that requires no external stimulation and was so penetrating that it could darken protected photographicplates and ionize gases. This process of spontaneous emission of radiation by uranium was soon to be called radioactivity.Subsequent experiments by other scientists showed that other substances weremore powerfully radioactive. The most significant early investigations of this typewere conducted by Marie and Pierre Curie (1859–1906). After several years of care-
Marie Curieomful and laborious chemical separation processes on tons of pitchblende, a radioactive ore, the Curies reported the discovery of two previously unknown elements,both radioactive, named polonium and radium. Additional experiments, includingRutherford’s famous work on alpha-particle scattering, suggested that radioactivityis the result of the decay, or disintegration, of unstable nuclei.Three types of radioactive decay occur in radioactive substances: alpha (a)decay, in which the emitted particles are 4He nuclei; beta (b) decay, in which theemitted particles are either electrons or positrons; and gamma (g) decay, in whichthe emitted particles are high-energy photons. A positron is a particle like the electron in all respects except that the positron has a charge of 1e. (The positron is theantiparticle of the electron; see Section 46.2.) The symbol e2 is used to designate anelectron, and e1 designates a positron.We can distinguish among these three forms of radiation by using the schemedescribed in Figure 44.9. The radiation from radioactive samples that emit all threetypes of particles is directed into a region in which there is a magnetic field. Following the particle in a field (magnetic) analysis model, the radiation beam splits intothree components, two bending in opposite directions and the third experiencingno change in direction. This simple observation shows that the radiation of theundeflected beam carries no charge (the gamma ray), the component deflectedupward corresponds to positively charged particles (alpha particles), and the component deflected downward corresponds to negatively charged particles (e2). If thebeam includes a positron (e1), it is deflected upward like the alpha particle, but itfollows a different trajectory due to its smaller mass.The three types of radiation have quite different penetrating powers. Alpha particles barely penetrate a sheet of paper, beta particles can penetrate a few millimeters of aluminum, and gamma rays can penetrate several centimeters of lead.The decay process is probabilistic in nature and can be described with statistical calculations for a radioactive substance of macroscopic size containing a largenumber of radioactive nuclei. For such large numbers, the rate at which a particular decay process occurs in a sample is proportional to the number of radioactivenuclei present (that is, the number of nuclei that have not yet decayed). If N is thenumber of undecayed radioactive nuclei present at some instant, the rate of changeof N with time isdN5 2lN(44.5)dt1391Time & Life Pictures/Getty Images44.4 RadioactivityPolish Scientist (1867–1934)swarphysics.weebly.cIn 1903, Marie Curie shared the NobelPrize in Physics with her husband,Pierre, and with Becquerel for theirstudies of radioactive substances. In1911, she was awarded a Nobel Prize inChemistry for the discovery of radiumand polonium.dN5 2l dtNwww.awhere l, called the decay constant, is the probability of decay per nucleus per second. The negative sign indicates that dN/dt is negative; that is, N decreases in time.Equation 44.5 can be written in the formDetectorarrayThe charged particles are deflected inopposite directions by the magnetic field,and the gamma ray is not deflected at all.LeadagA mixture of sourcesemits alpha, beta,and gamma rays.SBinePitfall Prevention 44.3Rays or Particles? Early in thehistory of nuclear physics, theterm radiation was used to describethe emanations from radioactivenuclei. We now know that alpharadiation and beta radiationinvolve the emission of particleswith nonzero rest energy. Eventhough they are not examples ofelectromagnetic radiation, theuse of the term radiation for allthree types of emission is deeplyentrenched in our language andin the physics community.Pitfall Prevention 44.4Notation Warning In Section 44.1,we introduced the symbol N as aninteger representing the numberof neutrons in a nucleus. In thisdiscussion, the symbol N represents the number of undecayednuclei in a radioactive sampleremaining after some time interval. As you read further, be sure toconsider the context to determinethe appropriate meaning for thesymbol N.Figure 44.9 T he radiation fromradioactive sources can be separated into three components byusing a magnetic field to deflectthe charged particles. The detector array at the right records theevents.
1392 Chapter 44Nuclear StructureFigure 44.10 Plot of the exponential decay of radioactive nuclei.The vertical axis represents thenumber of undecayed radioactivenuclei present at any time t, andthe horizontal axis is time.N(t)N0N N 0e – t12 N0The time interval T1/2 isthe half-life of the sample.1N4 0T 1/2 2T 1/2tomwhich, upon integration, givesExponential behavior of the number of undecayed nucleiN 5 N 0e2lt(44.6)s.weebly.cwhere the constant N 0 represents the number of undecayed radioactive nuclei att 5 0. Equation 44.6 shows that the number of undecayed radioactive nuclei in asample decreases exponentially with time. The plot of N versus t shown in Figure44.10 illustrates the exponential nature of the decay. The curve is similar to that forthe time variation of electric charge on a discharging capacitor in an RC circuit, asstudied in Section 28.4.The decay rate R, which is the number of decays per second, can be obtained bycombining Equations 44.5 and 44.6:R5 Exponential behavior of the decay ratedN 5 lN 5 lN0 e2lt 5 R 0e2ltdt(44.7)ysicwhere R 0 5 lN 0 is the decay rate at t 5 0. The decay rate R of a sample is oftenreferred to as its activity. Note that both N and R decrease exponentially with time.Another parameter useful in characterizing nuclear decay is the half-life T1/2:The half-life of a radioactive substance is the time interval during which halfof a given number of radioactive nuclei decay.swTo find an expression for the half-life, we first set N 5 N 0 /2 and t 5 T1/2 in Equation 44.6 to giveN05 N0 e2lT1/22Canceling the N 0 factors and then taking the reciprocal of both sides, we obtaine lT1/2 5 2. Taking the natural logarithm of both sides gives.aHalf-life It is not true that all theoriginal nuclei have decayed aftertwo half-lives! In one half-life, halfof the original nuclei will decay.In the second half-life, half ofthose remaining will decay, leaving 14 of the original number.arphPitfall Prevention 44.5Half-life wwwT1/2 5ln 20.6935ll(44.8)After a time interval equal to one half-life, there are N 0 /2 radioactive nuclei remaining (by definition); after two half-lives, half of these remaining nuclei have decayedand N 0 /4 radioactive nuclei are left; after three half-lives, N 0 /8 are left; and so on. Ingeneral, after n half-lives, the number of undecayed radioactive nuclei remaining isN 5 N0 1 12 2 n(44.9)where n can be an integer or a noninteger.A frequently used unit of activity is the curie (Ci), defined as1 Ci ; 3.7 3 1010 decays/sThe curie This value was originally selected because it is the approximate activity of 1 g ofradium. The SI unit of activity is the becquerel (Bq):1 Bq ; 1 decay/sThe becquerel 1010Therefore, 1 Ci 5 3.7 3Bq. The curie is a rather large unit, and the more frequently used activity units are the millicurie and the microcurie.
44.4 Radioactivity1393Q uick Quiz 44.2 On your birthday, you measure the activity of a sample of 210Bi,which has a half-life of 5.01 days. The activity you measure is 1.000 mCi. What isthe activity of this sample on your next birthday? (a) 1.000 mCi (b) 0 (c) , 0.2 mCi(d) , 0.01 mCi (e) , 10222 mCiExample 44.4 How Many Nuclei Are Left?The isotope carbon-14, 146C, is radioactive and has a half-life of 5 730 years. If you start with a sample of 1 000 carbon-14nuclei, how many nuclei will still be undecayed in 25 000 years?omS o l u ti o nConceptualize The time interval of 25 000 years is much longer than the half-life, so only a small fraction of the originally undecayed nuclei will remain.cCategorize The text of the problem allows us to categorize this example as a substitution problem involving radioac-Analyze Divide the time interval by the half-life to deter-25 000 yr5 4.363eebn5lytive decay.mine the number of half-lives:5 730 yrN 5 N0 1 12 2 n 5 1 000 1 12 2 4.363 5 49s.wDetermine how many undecayed nuclei are left after thismany half-lives using Equation 44.9:Finalize A s we have mentioned, radioactive decay is a probabilistic process and accurate statistical predictions are pos-arphysicsible only with a very large number of atoms. The original sample in this example contains only 1 000 nuclei, which iscertainly not a very large number. Therefore, if you counted the number of undecayed nuclei remaining after 25 000years, it might not be exactly 49.Example 44.5 The Activity of CarbonAt time t 5 0, a radioactive sample contains 3.50 mg of pure 116C, which has a half-life of 20.4 min.sw(A) Determine the number N 0 of nuclei in the sample at t 5 0.aS o l u ti o nConceptualize The half-life is relatively short, so the number of undecayed nuclei drops rapidly. The molar mass of 116Cwis approximately 11.0 g/mol.Categorize We evaluate results using equations developed in this section, so we categori
1388 Chapter 44 Nuclear Structure of proton pairs Z(Z 2 1)/2 and inversely proportional to the nuclear radius. Consequently, the reduction in binding energy that results from the Coulomb effect is 2C 3 Z(Z 2 1)/A1/3, where C 3 is yet another adjustable constant.