Transcription
Children andYoung PeopleLiving Well andStaying WellNew Zealand Childhood ObesityProgramme Baseline Report2016/17Released 2017health.govt.nz
Citation: Ministry of Health. 2017. Children and Young People Living Well and StayingWell: New Zealand Childhood Obesity Programme Baseline Report 2016/17.Wellington: Ministry of Health.Published in June 2017by the Ministry of HealthPO Box 5013, Wellington 6140, New ZealandISBN 978-1-98-850246-5 (online)HP 6593This document is available at health.govt.nzThis work is licensed under the Creative Commons Attribution 4.0 International licence. In essence, youare free to: share ie, copy and redistribute the material in any medium or format; adapt ie, remix, transform and buildupon the material. You must give appropriate credit, provide a link to the licence and indicate if changes were made.
ContentsExecutive summaryvIntroduction1Background1The effects of childhood obesity1Factors that contribute to childhood obesity1The New Zealand Childhood Obesity Programme2The reducing childhood obesity intervention logic model5Overview7Data sources8How we will use the Reducing childhood obesity indicators8Reducing childhood obesity indicators9Indicators 1–3: More children are physically active9Indicator 1: Time spent watching television, videos and screens10Indicator 2: Sleep duration12Indicator 3: Time spent on physical activity13Indicators 4–7: More children eat well14Indicator 4: Breastfeeding15Indicator 5: Consumption of fast foods16Indicator 6: Consumption of sugary drinks18Indicator 7: Fruit and vegetable intake20Indicators 8–11: Children’s environments support physical activity andhealthy living23Indicator 8: Awareness of the Health Star Rating system24Indicator 9: Active transport to and from school26Indicator 10: Use of a bicycle28Indicator 11: Water in schools29Indicators 12–15: More children have improved health outcomes30Indicator 12: Body mass index31Indicator 13: Gestational diabetes33Indicator 14: Raising Healthy Kids health target34Indicator 15: Birth weight36Baseline performance against the reducing childhood obesity indicators38References41Children and Young People Living Well and Staying Welliii
List of TablesTable 1:Reducing childhood obesity indicatorsTable 2:Percentage of children (aged 2–14 years) who usually watch two or morehours of television (including DVDs or videos) per day, by group, 2015/1611Recommended sleep durations for children and young people aged 0–17years old12Percentage of infants who are exclusively, fully or partially breastfed at twoweeks, six weeks, three months and six months, March 201615Percentage of children (aged 2–14 years) who ate fast food at least once inthe past week, by group, 2015/1616Percentage of children (aged 2–14 years) who had fizzy drink three or moretimes in the past week, by group, 2015/1619Percentage of children (aged 2–14 years) who eat at least two servings of fruiteach day, by group, 2015/1621Percentage of children (aged 2–14 years) who meet New Zealand’s agespecific vegetable intake guidelines, by group, 2015/1622Percentage of grocery shoppers who recognise, understand and use theHealth Star Rating system, by group, 201525Percentage of children (aged 5–14 years) who usually use an active mode oftransport, such as walking, biking or skating, to get to and from school, bygroup, 2015/1626Number and percentage of children (aged 2–14 years) with a body massindex that indicates they are thin, a healthy weight, overweight but not obese,overweight or obese, or obese, by group, 2015/1632Number and percentage of births where the mother had gestational diabetes,2015/1633Table 13:Raising Healthy Kids health target performance, quarter one 2016/1735Table 14:Number and percentage of babies by birth weight category, 201537Table 15:Baseline performance against the reducing childhood obesity indicators38Table 3:Table 4:Table 5:Table 6:Table 7:Table 8:Table 9:Table 10:Table 11:Table 12:7List of FiguresFigure 1:Overview of the New Zealand Childhood Obesity Programme and Plan4Figure 2:Reducing childhood obesity intervention logic model6Figure 3:Percentage of children (aged 2–14 years) who usually watch two or morehours of television (including DVDs or videos) per day, 2011/12–2015/1611Percentage of children (aged 2–14 years) who ate fast food at least once inthe past week, 2011/12–2015/1617Percentage of children (aged 2–14 years) who had fizzy drink three or moretimes in the past week, 2011/12–2015/1619Percentage of children (aged 2–14 years) who eat at least two servings of fruiteach day, 2011/12–2015/1621Percentage of children (aged 2–14 years) who meet New Zealand’s agespecific vegetable intake guidelines, 2011/12–2015/1622Figure 8:Example of a Health Star Rating24Figure 9:Percentage of children (aged 5–14 years) who usually use active transport(eg, walk, bike or skate) to get to and from school, 2011/12–2015/1627Figure 4:Figure 5:Figure 6:Figure 7:ivChildren and Young People Living Well and Staying Well
Executive summaryThe Ministry of Health developed this report in collaboration with the Ministry of Education,Sport New Zealand, the Ministry for Primary Industries and the Health Promotion Agency, aspart of the activities of the New Zealand Childhood Obesity Programme. The report builds onthe work that these organisations undertook in 2016 to develop an intervention logic model forreducing childhood obesity. That model includes an agreed set of reducing childhood obesityindicators that we will use to monitor the programme’s progress over the next five years.The purpose of this report is to describe each of the reducing childhood obesity indicators inmore detail, and present a baseline view of their performance. The report also includes a briefoverview of the New Zealand Childhood Obesity Programme and the Reducing childhoodobesity intervention logic model, as well as an update on the programme’s first year ofimplementation (2015/16).The reducing childhood obesity indicators have been divided into four categories to align withthe programme’s four medium-term outcomes. Indicators 1–3 measure whether children and young people are becoming less sedentary andmore physically active. Indicators 4–7 measure whether more children and young people are eating well. Indicators 8–11 measure whether the environments that children and young people live andplay in are supporting children to become more physically active and to lead healthier lives. Indicators 12–15 measure whether children’s obesity-related health outcomes are improving.Baseline performance is not available for four of the indicators, because data collection onlybegan in 2016/17. Results for most of these indicators will be included in the first Children andyoung people living well and staying well monitoring report, due to be published in early 2018.That report will be the first in an annual series of monitoring reports on the New ZealandChildhood Obesity Programme; it will provide information on the second year ofimplementation and an updated view of performance against the reducing childhood obesityindicators.This baseline report highlights some inequities between different population groups for anumber of the indicators. The programme’s long-term goal is to reduce childhood obesity inNew Zealand equitably, with a particular focus on Māori, Pacific peoples and children living inareas of high deprivation.Children and Young People Living Well and Staying Wellv
IntroductionBackgroundNew Zealand has high rates of childhood obesity: 10.7 percent of New Zealand children (aged2–14 years) are obese, and these rates are even higher among Māori children (14.7 percent),Pacific children (29.8 percent) and children living in our most deprived neighbourhoods(20.0 percent) (Ministry of Health 2016d).The effects of childhood obesityObese children are at risk of immediate and long-term health consequences. Childhood obesityis associated with obstructive sleep apnoea; musculoskeletal problems; asthma; andpsychological problems including body dissatisfaction, poor self-esteem and depression.Childhood obesity can have a negative impact on children’s learning and academic achievement;obese children may become targets for bullying, which can further impact on their self-esteemand mental wellbeing.Obese children are also more likely to become obese adults, and are therefore more at risk ofdeveloping long-term conditions such as type 2 diabetes, heart disease, dementia, some cancers,mental illness and chronic pain.Factors that contribute to childhood obesityEvidence on the causes of obesity is still evolving. However, we do know that:1.Energy (kilojoule) intake is key – the amount of food a person eats and its energy density isthe single biggest driver of obesity. Helping people to make good food choices and reducetheir intake of energy-dense foods will have the greatest impact on reducing obesity.2.Environmental factors (physical, economic, political or social) play an important role –for example, obesity increases when there is greater availability and more invasivemarketing of high-energy, low-nutrient food and beverages, and reduced opportunities forphysical activity.3.Parental health, including maternal and infant nutrition, is significant – the WorldHealth Organization’s Commission on Ending Childhood Obesity notes that a mother canreduce her child’s risk of obesity by avoiding gestational diabetes, eating well duringpregnancy, and continuing to breastfeed her infant.4.Physical activity has health and educational benefits – increasing levels of physicalactivity helps children and young people to attain and maintain a healthy weight, and canbreak the intergenerational cycle of inactivity. Physical activity also supports positiveeducational outcomes, specifically through improved cognition and behaviour.5.Children need to get the right amount of sleep – children who sleep less than therecommended amount are twice as likely to be overweight or obese. The exact relationshipbetween insufficient sleep and weight gain is unclear, but it is thought that being awake forlonger affects a person’s ability to regulate their appetite, leading to excess energy intake.Not getting enough sleep may also lead to reduced physical activity and energy expenditure.Children and young people living well and staying well1
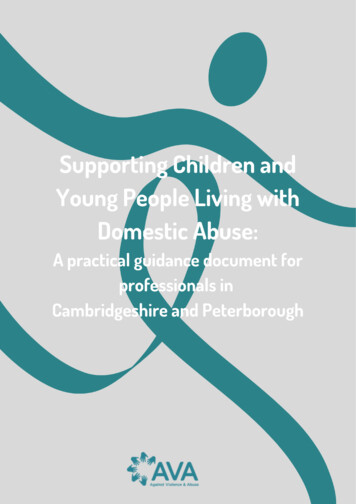
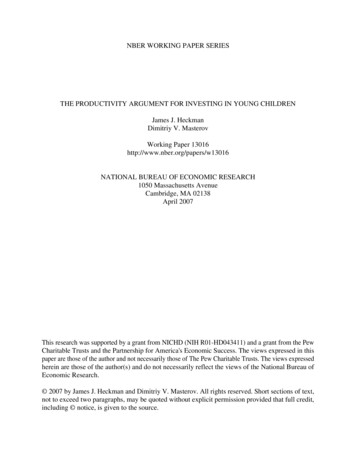
The New Zealand Childhood ObesityProgrammeIn October 2015, the Government launched the Childhood Obesity Plan (see Figure 1). The planincludes 22 initiatives designed to reduce the risk of children becoming obese, or to increasesupport for children and young people who are already obese. The initiatives include developingimproved public information and resources, encouraging children to be more physically active,supporting children and their families/whānau to make healthier food choices and working withthe food and beverage industry to encourage the development and promotion of healthier foodoptions.The Childhood Obesity Plan is being implemented through the multi-agency New ZealandChildhood Obesity Programme, which aims to equitably reduce childhood obesity in NewZealand so that all children and young people can live well and stay well.We have made good progress on the Childhood Obesity Plan over the past year (see Text box 1),but there is still plenty of work to do. The New Zealand Childhood Obesity Programme islooking at other cross-government, private sector and community initiatives that have thepotential to reduce childhood obesity. Both the programme and the plan are likely to evolve overtime, to reflect what we are learning about what works for different population groups and why.2Children and Young People Living Well and Staying Well
Text box 1: The New Zealand Childhood Obesity Plan’s achievements to date The Government has introduced the Raising Healthy Kids health target, to help identifychildren and families/whānau that may need extra support to achieve a healthylifestyle. The target requires that ‘By December 2017, 95% of obese children identifiedin the B4 School Check programme will be offered a referral to a health professional forclinical assessment and family-based nutrition, activity and lifestyle interventions.’ Inquarter two 2016/17, achievement against the target was 71.9%. The Health Star Rating system, which rates the healthiness of packaged foods, is nowon over 2000 products and is supported by a promotional campaign. The pilot programme Play.sport is in 44 schools across Upper Hutt and Waitakere.Play.sport aims to support teachers, schools, parents and caregivers and communityorganisations to improve the quality of young people’s experiences of play, physicaleducation, physical activity and sport, by improving community and nationalleadership. All district health boards (DHBs) have become sugar-sweetened beverage free, and areworking towards implementing the National District Health Board Food and DrinkEnvironments Network’s National Healthy Food and Drink Policy. The Ministry of Health has published updated Eating and Activity Guidelines for NewZealand adults and Clinical Guidelines for Weight Management in New ZealandChildren and Young People. The Education Review Office has published two reports on food, nutrition and physicalactivity in New Zealand schools and early learning services. Since October 2015, 285 new schools have signed up to the Ministry of Health’s HealthPromoting Schools programme, which works with school leaders to identify health andwellbeing priorities for students, and to create and implement a plan to address thesepriorities. Healthy Families New Zealand is operating in 10 locations across the country (FarNorth, Waitakere, Manukau, Manurewa-Papakura, East Cape, Rotorua, Whanganui,Lower Hutt, Christchurch and Invercargill). It takes a whole-of-community approach tothe prevention of chronic disease; activating local leadership and creating healthychanges in the places where people live, learn, work and play – including schools, earlychildhood education centres, workplaces, sports clubs, marae, places of worship andcommunity spaces.Children and young people living well and staying well3
Figure 1: Overview of the New Zealand Childhood Obesity Programme and Plan4Children and Young People Living Well and Staying Well
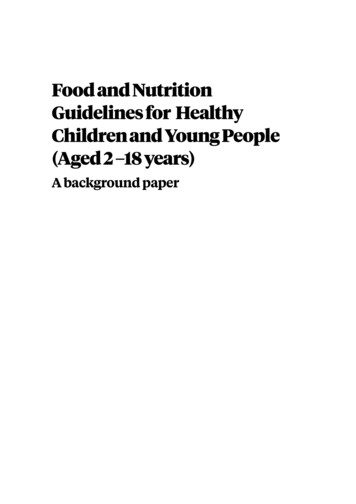
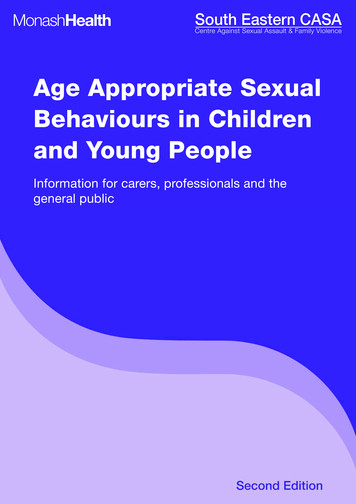
The reducing childhood obesity interventionlogic modelThe Reducing childhood obesity intervention logic model (see Figure 3) was developed toprovide direction and support for the New Zealand Childhood Obesity Programme. The modelsets out a number of shared goals, outcomes and indicators which will help us identify newopportunities and priorities for investment.The model aligns with the recommendations of the World Health Organization’s Commission onEnding Childhood Obesity (WHO 2016) and was developed in consultation with the Ministry ofEducation, Sport New Zealand, the Health Promotion Agency, the Education Review Office, theNew Zealand Transport Agency and the Accident Compensation Corporation.The model includes four medium-term outcomes that describe what we hope to achieve over thenext 4–5 years: more children are physically active more children eat well children’s environments support physical activity and healthy eating more children have improved health outcomes.The model also includes an agreed set of performance indicators (known as the reducingchildhood obesity indicators), which will allow us to measure whether the medium-termoutcomes are being achieved. Each indicator was chosen based on its relevance to childhoodobesity and its ability to be measured using existing data collections. Some of the indicators areoutcomes-focused (eg, percentage of children whose body mass index is within a healthy weightrange); others focus on the drivers of childhood obesity (eg, unhealthy eating and low levels ofphysical activity).Children and young people living well and staying well5
Figure 2: Reducing childhood obesity intervention logic model6Children and Young People Living Well and Staying Well
OverviewThis report provides a brief description of each of the reducing childhood obesity indicators andtheir measures, and presents a baseline view of their performance. Where possible, we havebroken the data down by sex, age, ethnic group and neighbourhood deprivation quintile (tohighlight any inequities between population groups), and presented actual numbers alongsidepercentages.Table 1 lists each of the indicators and their measures, according to which medium-termoutcome they align with. We may amend the list of indicators over time, as more informationbecomes available, new evidence emerges or new initiatives are established.Table 1: Reducing childhood obesity indicatorsIndicatorMeasureMore children are physically active1Time spent watchingtelevision, videos or screensPercentage of children (aged 2–14 years) who usually watch two or morehours of television (including DVDs and videos) per day2Sleep durationPercentage of children (aged 5–13 years) who get 9–11 hours of sleep perday on average3Time spent on physicalactivityPercentage of children (aged 5–17 years) who spent at least one hour per daybeing physically active (for sport, physical education, exercise or fun) over thelast weekMore children eat well4BreastfeedingPercentage of infants who are exclusively or fully breastfed at two weeks, sixweeks and three monthsPercentage of infants who are still receiving breast milk at six months5Consumption of fast foodsPercentage of children (aged 2–14 years) who ate fast food at least once inthe past week6Consumption of sugarydrinksPercentage of children (aged 2–14 years) who had fizzy drink three or moretimes in the past week7Fruit and vegetable intakePercentage of children (aged 2–14 years) who eat at least two servings of fruiteach dayPercentage of children (aged 2–14 years) who meet New Zealand’s agespecific vegetable intake guidelinesChildren’s environments support physical activity and healthy living8Awareness of the HealthStar Rating systemPercentage of grocery shoppers who recognise the Health Star Rating systemwhen promptedPercentage of grocery shoppers who understand the Health Star RatingsystemPercentage of grocery shoppers who use the Health Star Rating system whenshopping9Active transport to and fromschoolPercentage of children (aged 5–14 years) who usually use an active mode oftransport, such as walking, biking or skating, to get to and from school10Use of a bikePercentage of children (aged 5–17 years) who have ridden a bike in the lastweek for sport, exercise or funAverage number of hours children (aged 5–17 years) spent riding a bike in thelast week for sport, exercise or fun11Water in schoolsThis measure is still under developmentChildren and young people living well and staying well7
IndicatorMeasureMore children have improved outcomes12Body mass indexPercentage of children (aged 2–14 years) with a BMI that indicates they arethin, a healthy weight, overweight (but not obese) or obese13Gestational diabetesPercentage of births where the mother had gestational diabetes14Raising Healthy Kids healthtargetPercentage of obese children identified in the B4 School Check programmewho were offered a referral to a health professional for clinical assessmentand family-based nutrition, activity and lifestyle intervention15Birth weightPercentage of babies whose birth weight (kg) was extremely low, very low,low, normal or highData sourcesThe following data sources were used to establish baseline performance against each of theindicators: the Ministry of Health’s New Zealand Health Survey (Ministry of Health 2016d) Sport New Zealand’s Active New Zealand Survey the Ministry of Health’s Indicators for the Well Child/Tamariki Ora Quality ImprovementFramework: March 2016 report (Ministry of Health 2016c) Colmar Brunton’s Health Star Rating Monitoring and Evaluation report, Health PromotionAgency (Colmar Brunton 2016) the Ministry of Health’s National Maternity Collection the Ministry of Health’s National Minimum Data Set the Ministry of Health’s B4 School Check database the Ministry of Health’s annual Report on Maternity series.We will continue to use these data sources for future monitoring reports, to make sure that thedata is comparable over time.How we will use the Reducing childhoodobesity indicatorsThe reducing childhood obesity indicators will be used to monitor the progress of the NewZealand Childhood Obesity Programme, and will form the basis of future Children and youngpeople living well and staying well monitoring reports. The first monitoring report will bepublished in early 2018. This will allow performance from baseline to be analysed for the firsttime, and will indicate whether the initiatives included in the Childhood Obesity Plan areachieving the desired outcomes.8Children and Young People Living Well and Staying Well
Reducing childhood obesityindicatorsIndicators 1–3: More children arephysically activeRationale and purposePhysical activity is important for maintaining a healthy lifestyle. Physical activity is not justsport; it also includes active recreation, incidental activities, transportation and physical work.Regular physical activity in children and young people improves health and wellbeing innumerous ways, including by: helping to build healthy bones, muscles and joints improving mental wellbeing assisting weight management strengthening the cardiovascular system improving coordination and movement control.Children who establish good habits during childhood and maintain them during adolescenceexperience many long-term health benefits, including reducing their risk of developing longterm conditions such as heart disease and type 2 diabetes.Children and young people living well and staying well9
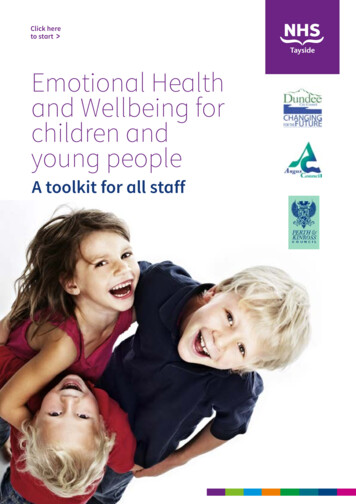
Indicator 1: Time spent watching television,videos and screensDescriptionThis indicator measures the percentage of children (aged 2–14 years) who watch two or morehours of television (including DVDs and videos) per day, averaged over a week.Watching television is a sedentary behaviour that takes up time that children could spend beingphysically active. The Ministry of Health recommends that children and young people (aged5–18 years) should spend less than two hours a day (out of school hours) in front of a television,computer or games console (Ministry of Health 2015).Baseline performanceThe Ministry of Health has collected the data for this indicator annually since 2011/12 throughthe New Zealand Health Survey. The baseline performance set out here comes from the 2015/16survey.In 2016/17, the survey questions changed slightly to capture the total amount of time childrenspend looking at screens, because the recent decline observed in television viewing time (seeFigure 3) is likely to be offset by the time children spend using other devices, such as laptops ortablets. This means that the definition for this indicator will be slightly different in the firstChildren and young people living well and staying well monitoring report (due to be publishedin early 2018). In the first report, the indicator will measure the percentage of children (aged2–14 years) who had two or more hours of total screen time (including television, DVDs, videos,video games or computer) per day, averaged over a week.The data for this indicator is available by sex, age group, ethnic group and neighbourhooddeprivation quintile.10Children and Young People Living Well and Staying Well
Table 2: Percentage of children (aged 2–14 years) who usually watch two or more hours oftelevision (including DVDs or videos) per day, by group, 2015/16Estimated number of children (95% CI %5–943.7%39.9%47.8%140,000 (129,000–151,000)10–1448.1%46.7%49.5%141,000 (132,000–150,000)Māori51.8%52.9%50.5%104,000 (97,000–111,000)Pacific peoples47.4%43.9%51.1%49,000 (45,000–54,000)Asian46.9%42.2%51.6%48,000 000 (229,000–258,000)Quintile 1 (least deprived)41.9%39.6%44.4%70,000 (59,000–81,000)Quintile 239.2%36.7%42.1%60,000 (52,000–68,000)Quintile 343.3%45.6%41.0%61,000 (54,000–69,000)Quintile 447.3%47.3%47.3%70,000 (64,000–77,000)Quintile 5 (most deprived)51.3%51.2%51.3%94,000 (88,000–100,000)Population groupTotal355,000 (340,000–371,000)Age group (years)74,000 (67,000–82,000Ethnic groupNeighbourhood deprivationquintile (NZDep2013)Source: Ministry of Health 2016dNote: The estimated number of children who usually watch two or more hours of television has been rounded to the nearest1,000. For more information on how these numbers are calculated, please see section 7 of Ministry of Health 2016b.Figure 3: Percentage of children (aged 2–14 years) who usually watch two or more hours oftelevision (including DVDs or videos) per day, 2011/122012/132013/142014/152015/16Source: Ministry of Health 2016d1The 95% confidence interval (CI) refers to the fact that if repeated samples were taken and the 95% CI wascalculated for each sample, 95% of the intervals would contain the population mean (ie, a 95% CI has a0.95 probability of containing the population mean).Children and young people living well and staying well11
Indicator 2: Sleep durationDescriptionThis indicator will measure the percentage of children (aged 5–13 years) who get an average of9–11 hours sleep in a 24-hour period, in line with the Ministry of Health’s recommended sleepdurations for school-age children (see Table 3).Table 3: Recommended sleep durations for children and young people aged 0–17 years oldAgeRecommended hours of sleepNewborn babies (0–3 months)14–17Infants (4–11 months)12–15Toddlers (1–2 years)11–14Pre-schoolers (3–4 years)10–13School-age children (5–13 years)9–11Teenagers (14–17 years)8–10Source: Ministry of Health 2016aInadequate amounts of sleep adversely impact children and young people’s health in a variety ofways, including their weight status, school performance, driver safety, emotional andbehavioural wellbeing and dietary intake (Shochat et al 2014; Bartel et al 2015).Fatima et al (2015) found that children who did not get the recommended amount of sleep weretwice as likely to be obese than those who did. Exactly how greater amounts of sleep protectagainst weight gain is unclear, but sleep deprivation is thought to affect both sides of the energybalance equation. Being awake for longer leaves a person more time to eat; it also affectsappetite regulation, leading to excess energy intake. Not getting enough sleep may also lead toless physical activity and reduced energy expenditure, although these effects may not be asstrong (Schmid et al 2015).Baseline performanceThere is currently no baseline data available for this indicator. The Ministry will start collectingdata for the indicator through the New Zealand Health Survey from 1 July 2017, and expects thefirst results around December 2018. The first results will likely be included in the secondChildren and young people living well and staying well monitoring report, which will bepublished in early 2019. From then, the results will be available annually by age group, ethnicgroup and neighbourhood deprivation quintile.12Children and Young People Living Well and Staying Well
Indicator 3: Time spent on physical activityDescriptionThere are many opportunities and reasons why children might be physically active. They mayplay a sport or partake in physical education at school, or they may do physical activity forexercise or fun.This indicator will measure the percentage of children (aged 5–17 years) who spent at least onehour per day being physically active (for sport, physical education, exercise or fun) over the lastweek.The Ministry of Health recommends that children and young people should: partake in at least 60 minutes of moderate to vigorous physical activity every day be active in as many ways as possible; for example, through play, cultural activities, dance,sport and recreation, jobs and transport be active with friends and family/whānau, at home, at school and in their community(Ministry of Health 2015).The results for this indicator may or may not include the time children spend using activetransport (ie, walking, cycling or skating) to get to and from school. It will depend on whetherthe child being surveyed considers getting to and from school as sport, physical education,exercise or fun.The indicator also doesn’t specify how intensive the child’s physical activity was; therefore, it isonly a proxy for the proportion of children meeting the Ministry of Health’s recommendationsfor physical activity.Baseline performanceThere is currently no baseline data available for this indicator. Sport New Zealand will startcollecting data for the indicator through the Active New Zealand Survey, which it launched inJanuary 2017. Sport New Zealand is still finalising its reporting requirements and timeframesfor this survey. However, it is likely that the first Children and young people living well andstaying well monitoring report will include the first results.Children and young people living well and staying well13
Indicators 4–7: More childreneat wellRationale and purposeEating well is important for children’s growth, development and wellbeing. Eating well meanseating a wide variety of nutritious foods, including: plenty of fruit and vegetables some grain foods: mostly wholegrain and those naturally high in fibre some milk and milk products, mostly low- and reduced-fat some legumes, nuts, seeds, fish and other seafood, eggs or poultry, or red meat with the fatremoved.Eating well also means restricting the amount of energy-dense, nutrient-poor foods and sugarsweetened beverages children consume. These foods have little or no nutritional value, and arekey drivers of childhood obesity.14Children and Young People Living Well and Staying Well
Indicator 4: BreastfeedingDescriptionThis indicator measures the percentage of infants who are exclusively or fully breastfed at twowe
developing long-term conditions such as type 2 diabetes, heart disease, dementia, some cancers, mental illness and chronic pain. Factors that contribute to childhood obesity Evidence on the causes of obesity is still evolving. However, we do know that: 1. Energy (kilojoule) intake is key - the amount of food a person eats and its energy .