Transcription
Research ArticleComparative seasonal assessment of pollution and health risksassociated with heavy metals in water, sediment and Fish of Burigangaand Turag River in Dhaka City, BangladeshM. N. Hossain1 · Ashiqur Rahaman2 · Md. Jawad Hasan2 · Md. Minhaz Uddin2 · Nazma Khatun3 ·Sayed Md. Shamsuddin2,4Received: 6 November 2020 / Accepted: 4 March 2021 / Published online: 29 March 2021 The Author(s) 2021 OPENAbstractHeavy-metal pollution of surface water, sediment and fish have been seen as a major global problem, with a significantproportion of developing countries like Bangladesh. This study assessed the intensity of alarming six toxic substances(Cr, Zn, Fe, Cu, Pb and Ni) throughout the River water, sediments as well as soft tissues of three widely consumed fishes(Heteropneustes fossilis, Channa punctatus and Channa striata) obtained from two urban streams of the Buriganga andTurag in the Dhaka metropolitan. For evaluating the comparative seasonal variation of heavy-metal concentration, waterand sediment samples were collected from five selected sites for two different seasons (viz. 10 from winter seasons and10 from summer seasons). Finally, a total of 20 water samples, 20 sediment and 12 fish samples were investigated byflame atomic absorption spectroscopy (FAAS) and graphite furnace atomic absorption spectrometer (GFAAS) correctedwith the Zeeman effect background correction system. The hierarchy of mean concentration of selected heavy metalsin Buriganga water is found to be Fe Cr Ni Zn Cu Pb in the winter season whereas during the summer season theorder is Fe Cr Zn Ni Cu Pb. For the River Turag, the order is Fe Zn Cu Ni Cr Pb and Fe Zn Ni Cu Cr Pbduring winter and summer season, respectively. The level of metals studied surpassed the acceptable level of drinkablewater, implying the ineptitude of drinking and cooking water from these Rivers. However, this hierarchy of heavy metalsfor sediments of Buriganga River changed to Fe Cr Ni Zn Cu Pb for the winter season and Fe Cr Ni Cu Zn Pbfor the summer season. Whereas, for the Turag River, the decreasing trend of metal concentration found in sediment wasFe Zn Cr Ni Cu Pb for both seasons. For probable human health hazard implications, contamination factor (CF)and pollution load index (PLI) were studied. The CF values revealed the low-to-moderate pollution of sediment. The PLIvalue above one shows the degradation of the consistency of the sediments. Fe, Ni, Pb, Cr, Zn and Cu concentrations infish species were found to be 19.66–45.1, 0.07–12.18, 1.2–10.18, 20.18–187.07, 11.08–68.25, 2.07–10.4 mg/kg, respectively. The metals studied differed considerably among organisms and seasons. Bioconcentration factor (BCF), the dailyaverage consumption of metal (EDI), as well as target threat quotients (THQs) for specific metal indicated that Cr and Pbare harmful in fish muscles and possible risks remain for fish consumers. The obtained concentrations of some metalsare higher than the WHO/FAO’s permissible limit, suggesting that the water and fish found in these Rivers are like to beharmful to the human being. This study shows that attention should be given to the risk assessment for heavy metalsin these Rivers.Keywords Heavy-metal · Pollution · Health-risk · Fish* M. N. Hossain, nazmul.hossain.gce.buet@gmail.com; * Nazma Khatun, nazmabaec@gmail.com 1Department of Glass and CeramicEngineering (GCE), Bangladesh University of Engineering and Technology (BUET), Dhaka, Bangladesh. 2Institute of Leather Engineeringand Technology, University of Dhaka, Dhaka, Bangladesh. 3Atomic Energy Centre, Chattogram, Bangladesh Atomic Energy Commission,Chattogram 4209, Bangladesh. 4Department of Applied Chemistry and Chemical Engineering, University of Dhaka, Dhaka, Bangladesh.SN Applied Sciences (2021) 3:509 23456789)
Research ArticleSN Applied Sciences (2021) 3:509 https://doi.org/10.1007/s42452-021-04464-01 IntroductionHeavy-metal contamination is considered among themost prominent problems that endanger water quality[1–3]. Increased manufacturing activities [2], unsustainable farming practices [4], constant dumping of urbanwastewater [5] and unnecessary traffic activities [6] leadto heavy-metal contamination of ecosystems. The heavymetal pollution in the atmosphere has now become aglobal concern, attributed to the growing pollution ofwater, soil including food in so many places around theworld. Pollution poses a tremendous hazard to the availability of drinking water. This pollution often constitutesa risk to the environment and human health throughthe ingestion of aquaculture [7, 8]. The United NationsAgenda 2030 and Sustainable Development Goals(SDGs) have put a clear emphasis on the aim to “by 2030,improve water quality by reducing pollution, eliminatingdumping and minimizing release of hazardous chemicals and materials, halving the proportion of untreatedwastewater and substantially increasing recycling andsafe reuse globally” [9].A large amount of toxic wastewater was dumped intothe lower land and water sources every day in Bangladesh. Besides, the Riverine aquatic ecosystem receives asignificant amount of suspended materials polluted byheavy metals from the nearby country via the Teesta andBrahmaputra Rivers. Thereupon, it poses a serious threatto fisheries and other marine biotas [10].In a developing country like Bangladesh, River pollution has become an alarming issue. Hundreds of factories discharge their waste products into nearby Rivers.The effluent coming from battery factories, garmentfactories, steel mill industries and tanneries are highlytoxic, causing organic and metal pollution and also lowers the dissolved oxygen in the River water. Thus, it hampers aquatic life and damages the natural ecosystem andwater quality [11].The Rivers Buriganga and Turag are the main receivers of industrial wastewater, flowing around the Dhakametropolitan, the capital of Bangladesh [12]. Indiscriminate dumping of commercial wastes and discharge ofspent liquors containing a variety of industrial chemicals used in textile and leather processing are severelypolluting the Rivers. The govt. has been forcing the tanneries to shift to leather industry estate at Savar since2017 through the High Court verdict. But only a third ofthe tanneries have shifted yet and discharging of effluent into the Buriganga River has been continued [13].The scenario of the Turag is not so different. The Riverwas once encircled by farmland where the water wasmainly used for fishing and transportation. At present,Vol:.(1234567890)the people who are working directly or indirectly in thetextile and dyeing industries are living in the bank regionof the River and significantly dependent on this contaminated water for their household activities [14].Heavy metals have been considered as an importantparameter for systematic assessment of environmentalpollution since 1960 [15]. Most heavy metals are harmfulto living organisms due to the high persistence accumulation and bioaccumulation [16]. Analysis of the heavy-metalcontents in the water and sediment is essential for assessing the overall quality of the aquatic environment [17].Besides, metal availability in sediments is as importantas in fish stocks. Heavy metals in water or soil can transform into the food chain in various ways. Fish living in thewater system is a prominent carrier of transfer, accumulation and settlement of heavy metals. Accumulated heavymetals in the heart, liver, gill, bones of fishes besides notonly damage the organs but also change the taste andsmell of fishes [18, 19]. The consumption of the fishes mayerect health hazards to humans. Usually, heavy metals getadsorbed on the surface of sediment through precipitation at higher pH. The heavy metals absorbed into thesediments are emitted into overlying water if the dissolvedoxygen concentration is less than 7 mg/L [20]. The studyon sediment is important as it serves as a habitat for various benthic organisms like mudfish [21].Heavy-metal concentrations of water vary from season to season due to some physiological characteristics such as temperature, rainfall, runoff, flush out, etc.Usually, heavy rainfall causes leaching, runoff, whichultimately reduced the concentration of heavy metals. A similar variation of heavy-metal accumulation fordifferent seasons has also been reported [22, 23]. Seasonal variation of trace metals is also very importantto include in studies for proper investigation. Irrigationwith contaminated water can pose a serious threat tocrops grown on the Riverbanks. The Buriganga receivedwastes from the tannery industries at the Hazaribagharea till 2017. The govt. has undertaken steps to movetanneries to a new tannery estate at Savar for the abatement of pollution that causes health risks of a humanliving beside the industrial area. Unfortunately, complete relocation has been delayed for more than twoyears. The govt. has extended the project completiondeadline repeatedly [24]. The new Savar tannery zoneis located on the banks of the Dhaleshwari River connected to the Buriganga [25]. The centralized effluenttreatment plant provided there hasn’t been functionalfully yet [26]. Very few researchers have conductedassessments after tannery relocation. Now it is necessary to evaluate the benefits of the transfer of tanneries and to ensure the best use of resources to ensurenational standards, SDG, etc. At Tongi near Dhaka,
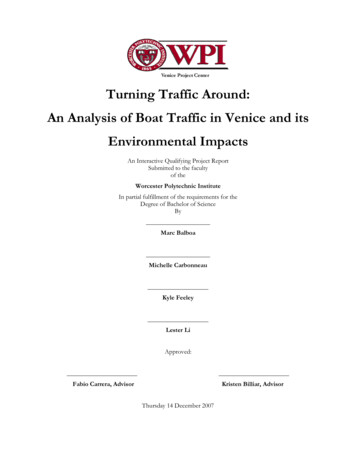
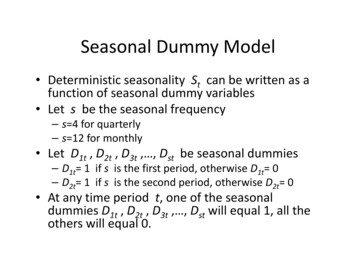
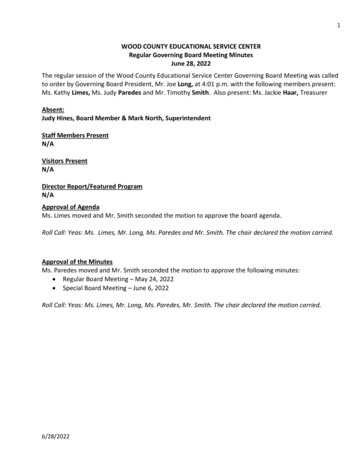
SN Applied Sciences (2021) 3:509 urers and factories frequently spill toxic wasteand fluent to the neighboring Turag River and pollutethe water. In Gazipur, the textile and dyeing industriesproduce wastewater in huge amounts on regular basis.These are being discharged into surrounding channelswhich finally come into the Turag River [27]. A lot ofchemicals like lead, sulfide, grease, hazardous pollutants, oil, color and heavy metals are added to the various unit processes for the manufacture of products. Thecontamination of this aquatic system poses a dangerousthreat to the overall system of the city [22, 28].The study focused on the comparative evaluationof the concentration of heavy metals leached out intonearby Rivers from both textiles and leather industrialareas in Dhaka city. This also studied the seasonal variability of heavy metals in the aquatic environment thatinvolves all Rivers’ water, sediment and fish to betterdetermine contamination and health threats correlatedwith polluted environmental assets.2 Method2.1 Description of the study areaThis research consists of two very important Bangladeshi Rivers, namely Buriganga and Turag, adjacentto Bangladesh’s capital city, Dhaka. Dhaka metropolitan area is about 815.8 k m2 located at the midpoint ofthe country. Dhaka had ranked 7th in the list of mostdensely populated cities and 21st in the list of the mostpolluted city in the world. This city is home to approximately twenty-one million people [29].The Buriganga ranks among the most polluted Rivers in the world. This River runs past the southwesternfringes of Dhaka town. This River has the highest 18 mdepth with a mean depth of 7.6 m [25].The Turag has its origin in the Bangshi River. It is alsothe upper embranchment of the River Buriganga [30].Such Rivers were used as appropriate means of disposing of municipal sewage, untreated industrial effluentsfrom rural housing and adjacent industrial belts. Thetanneries at the bank of Buriganga have been relocated two years back. There are no statistics on heavymetal pollution following relocation. But many otherindustries like a tannery, textile, paper and pulps, pesticides distilleries, carbides, pharmaceuticals are operating unhindered on the banks of both the Rivers Buriganga and Turag [23, 30–33]. Such human and naturalactivities have resulted in the River habitats becomingdegraded, allowing bioaccumulation of heavy metalsin comestible fish.Research Article2.2 SamplingThe sampling took place from January to February (winter season) in 2018 and from May to June (summer season) in 2019. There were a total of 5 random samplingsites for each River and from each site, there were twosamples for one season thereby four samples for the twoseasons. Finally, a total of 20 water samples and 20 sediment samples were collected from the selected sites forevaluating the comparative seasonal variation of metalconcentration. Unfiltered water samples were taken fortotal metal analysis from the center of the consideredareas of study. The samples then were moved to bottles of 100 mL of polypropylene, previously washed withacid. Then, 1 mL of nitric acid (99%) was added to thepolypropylene bottles to gain a pH of 0.1 [34]. Sediment samples were obtained in compliance with standard protocol [35]. All these samples were preserved at4 C till analysis.Around 12 fish samples were collected from the Bangladesh—China Friendship Bridge-01 (23 41′N 90 25′E)from different stations (Fig. 1) on the Buriganga Rivernear Kamrangir Char and Shaheed Buddhijibi Bridge(23 44′N90 20′E) and from the Turag River near Tongibridge to downstream in between the 23 53′N and90 25′E coordinates where fishing activities are high.The three most consumable fish species were selectedfor the present study namely: Stinging catfish (Heteropneustes fossilis), Spotted-snakehead (Channa punctatus)and Snakehead murrel (Channa striata) (sample specification is given in Table 1). These samples were promptlystored and shipped to the laboratory in air-tight polybags. Afterward, non-edible pieces were extracted bya previously steam cleaned stainless steel cutter. Muscle tissues which are the key edible component of thefish samples were then rinsed with deionized water. Themuscle tissues were then sliced into tiny pieces (3–5 cm)by a cleaned knife. Then, the possessed samples hadbeen retained at 4 C until analysis.2.2.1 Sample digestion and metal extractionA microwave digestion system was used for sampledigestion where 5 ml 70% H NO3 acid and 2 ml 30% H2O2act as a digestion reagent. Measured samples, i.e., 20 mlwater, 0.5 g sediment and 0.3 g fish, were then put insideTeflon flasks. Then digestion reagent was added up tothe mark. Next to digestion, the solution was then filtered using Whatman filter paper 1. Then the filtrate wasstored in 50ml polypropylene bottles.Vol.:(0123456789)
Research ArticleSN Applied Sciences (2021) 3:509 https://doi.org/10.1007/s42452-021-04464-0Fig. 1 Study areaTable 1 Basic biological parameters of three selected fish species [36, 37]Scientific nameCommon nameHeteropneustes fossilis Stinging catfishLocal name HabitAverage TL (cm) Average BW (g)Shing17.6814.7213.79.96060Channa punctatusSpotted Snake head TakiChanna striataSnakehead murrelSholMolluscs, cypris, copepod, fish and scales,larvae of chironomidsCarnivorous (small invertebrates and fishes,debris zooplankton)Carnivorous (frogs, water bugs and smallerfish)2.2.2 Quality control and assurance programsInterior quality was maintained by proper and constantscrutiny of perfect analytical data, records, statistics,method validation, etc. All the reagents (Merck) andstandard (commercially available Fluka solution) wereanalytical grades. The instruments were calibrated beforeuse each time. External quality was maintained by theskilled analyst, proper handling of the sample, reagentand instrument. The precision of the technique/methodand mean recoveries of the selected heavy metals areVol:.(1234567890)considered 95–97%. For the calibration curve, four dissimilar known concentrations standards were replicatedtwice while the unknown samples were replicated thrice.Working standards were always newly prepared fromthe stock solution (1000 ppm, Fluka, Switzerland) byserial dilution. The concentration of heavy metal in theunknown sample was obtained by extrapolation fromthe calibration curve. Acid blank was run along with thesample regularly which was later subtracted from sampleconcentration to get the actual concentration of metalsin an individual sample.
SN Applied Sciences (2021) 3:509 https://doi.org/10.1007/s42452-021-04464-02.2.3 Analytical methodsDigested samples were analyzed manually by atomicabsorption spectroscopy (Model-Perkin Elmer PinAAcle900H) for Cr, Zn, Fe, Pb, Cu and Ni concentration. Hollowcathode lamps (HCL) were operated according to the recommendation of the manufacturer for Cr, Zn, Fe, Cu, Pband Ni, which ordinarily act as a radiation source for AAS.Acetylene and argon gas with 99.99% purity acts as fuelfor the ignition of the burner.2.2.4 Heavy‑metal assessment in sedimentThe contamination factor (CF) and the pollution load index(PLI) were calculated to ensure the accumulation of heavymetal in sediment. For this analysis, contaminant indicators were measured by the average shale-value of theearth’s crust.2.2.5 Contamination factor (CF) and pollution load index(PLI)To determine the extent of sediment contamination, anintegrated pollution load index (PLI) method of the sixmetals is measured as per Suresh et al. [38]. The pollutionload index (PLI) signifies the number of times by which thetrace metal pollution in sediment surpasses the baselineconcentration and gives a collective warning of the general heavy-metal toxicity in a specific sample. The emissioncharge number is calculated as the nth root of the metalscontamination factor (CF) multiplications. PLI n (CF 1 CF 2 CF 3 CF n )(1)Here, the metal contamination factor is the ratio of theconcentration of each particular metal to its backgroundvalues/natural abundance (background value pre-industrial samples of the study area, Bangladesh)CF metals CmetalCbackground(2)Based on CF values, four grades had been categorizedover a duration of time to track the emissions of one metalwhich are as follows: [39, 40]. Low degree (CF 1)Moderate degree(1 CF 3)Considerable degree (3 CF 6)Very high degree(CF 6)Research Articlecorresponds to the optimal condition while the value of thatone implies the existence only of a baseline level of contaminants and a value above the one signifies a degradation ofits site and estuary quality [41]. Since the PLI is a result of thecontribution of the six metals, it assesses the overall toxicitystatus of the sample.2.3 Health risk assessment2.3.1 Estimated daily intake of metalThe dietary intake of trace metal has been measured utilizing modest concentrations of fish species. The estimateddaily intake (EDI) of metal through eating fish was assessedon the basis of the Islam et al. formula (2014d) [42].EDI FIR C(3)Here, FIR food ingestion rate (g/person/day) andC metal concentration in fish (mg/kg, wet weight). Fishingestion or consumption rate for adult residents in Bangladesh had been considered as 0.07184 kg, 0.08716 kg and0.1274 kg fresh weight basis for low, medium and high fishconsumers. The online database of the Joint FAO/WHOexpert panel on food additives unmatched the EDI with thecurrent tentative acceptable daily consumption [43, 44].2.4 Non‑carcinogenic risk assessmentThe ingestion dose is presumed to be equivalent to theamount of adsorbed pollutants. This was also claimed thatcooking has no impact on the pollutant [45]. In these analyses, the non-carcinogenic health threats correlated with thelocal consumer (low, moderate and large consumers of fish)of the contaminated fish species were evaluated on the basisof target hazard quotients (THQs). Calculations were carriedout by using standard assumptions for an integrated USEPArisk assessment.THQ EFr ED FIR CRfD BW AT(4)where, exposure frequency, EFr 365 days/year; exposureduration, ED 70 years (equivalent to the average life time(USEPA, 1991); oral reference dose RfD (Cr 1.5, Zn 0.3,Fe 0.7, Pb 0.0035, Cu 0.04, Ni 0.02 mg/kg/day) [46,47]; average bodyweight, BW Adult, 60 kg; averagingtime for non-carcinogens, AT 365 days/year number ofexposure years, assuming 70 years.That’s how CF values are being used to evaluate theenhancement in sediments of the given metal throughout the duration of time. Therefore, the PLI value of zeroVol.:(0123456789)
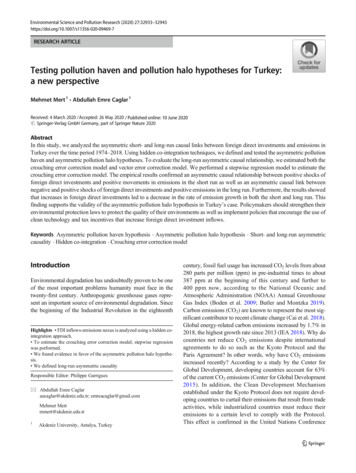
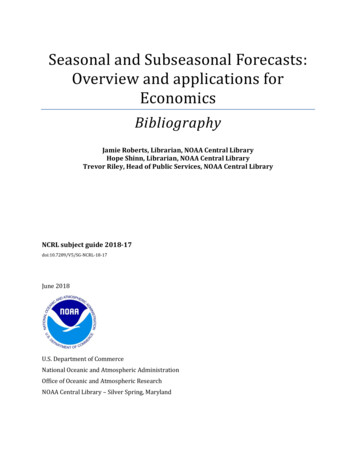
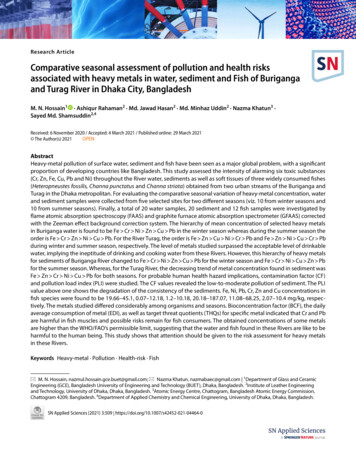
0.971.131.010.50.110.74 0.431.71.010.4BDLBDL1.04 0.652.531.71.410.910.231.36 0.862.051.650.620.020.10.89 0.92Vol:.(1234567890)TuragBS1BS2BS3BS4BS5Mean SDTS1TS2TS3TS4TS5Mean SDBuriganga7.554.931.180.50.072.85 3.261.451.10.650.150.10.69 0.592.532.010.980.10.011.13 1.130.910.810.380.050.010.53 0.412.931.230.980.570.531.25 0.983.22.611.291.10.981.84 1.01.271.550.890.410.280.88 0.542.582.010.980.710.51.36 0.9020.4314.0312.5311.911.1714.01 3.7410.1610.129.257.255.278.41 2.1213.4910.0310.539.919.1110.61 1.697.15.567.25.043.015.58 1.720.430.280.330.210.270.30 0.080.70.550.280.01BDL0.385 0.300.270.140.180.150.50.24 0.150.50.410.10.01BDL0.255 0.240.970.90.70.610.810.80 0.151.921.280.850.670.050.95 0.700.580.810.50.470.510.57 0.141.011.010.550.150.020.55 ummerZnCrSummerFeSN Applied Sciences (2021) 3:509 le 2 Heavy-metal concentration (conc. mg/L) of water of two studied RiversSummerPbSummerCuSummerNiResearch Article3 Results and discussion3.1 Assessment of metal concentration of surfacewaterThe concentration of six heavy metals (Cr, Zn, Fe,Pb, Cu and Ni) over two major seasons (winter andsummer) are shown in Table 2. The order of meanconcentration of heavy metals in Buriganga wateris found to be Fe Cr Ni Zn Cu Pb in the winter season whereas during the summer season theorder is Fe Cr Zn Ni Cu Pb. The order of themean concentration is Fe Zn Cu Ni Cr Pb andFe Zn Ni Cu Cr Pb during winter and summer season, respectively, for the Turag River. In winter, the maximum concentration of Fe is found to be 20.43 mg/L, butin summer the concentration decreased to 13.49 mg/Lfor the Buriganga River while the concentrations arenoted to be 10.16 mg/L and 7.1 mg/L, respectively, forTurag River. In the present study, Fe concentration forthe Buriganga River is approximately double that of theTurag River and always poses the highest position forboth Rivers, both seasons and each site. The highestconcentration of Fe for both Rivers is most possibly fornatural sources (viz. ore deposition, atmospheric precipitation, degeneration of rocks/mineral by storms, weathering, wind and waves), or by anthropogenic activities(viz. mining, power transmission, carrying industrialemission, electroplating, smelting, sludge dumping,fuel production, dust, severe municipal plus agricultural actions, and wastewater irrigation [4, 31–33]. Themean Fe concentration found in this study is 41 and 23times higher than that of WHO’s standard (0.30 mg/L).For Buriganga River, the maximum Cr concentration (2ndhighest concentration for Buriganga River) is found tobe 7.55 mg/L and 2.53 mg/L for the winter and summerseasons, respectively. The values are 151 times and 51times higher than that of WHO standard level for drinking water (0.05 mg/L). Islam et al. [42] have also reportedthe Cr concentration with a value of 2.35 mg/L for Buriganga. This might be due to the direct discharging ofuntreated wastewater into the River from tannery industries situated at the west bank of the Buriganga River.Besides, pigment manufacturing, chromium plating andwood preservation may also have a direct role in increasing Cr concentration [3, 10, 28, 41, 47, 49]. Moreover, Feand Cr concentration for Buriganga River poses alwayshigher than that of Turag River due to the tannery industries located at Hazaribagh area and indiscriminate discharging of waste into the River. On the other hand, theTurag River is surrounded by different industrial belts(textile, dyeing industry and fertilizer industry), rural
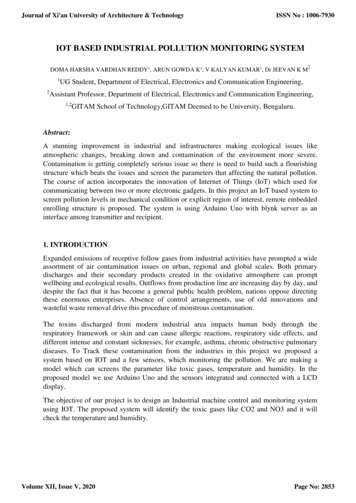
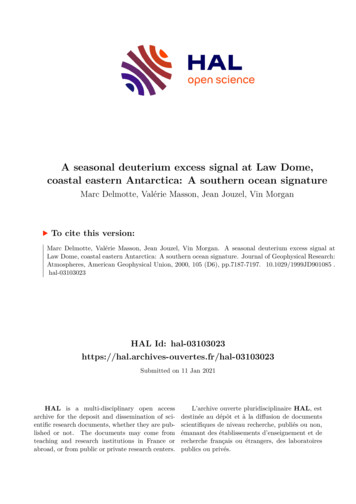
Research ArticleSN Applied Sciences (2021) 3:509 https://doi.org/10.1007/s42452-021-04464-0housing, agricultural farm and farmland, which ultimately increase the amount of Zn and Cu concentrationin the Turag River [25–27]. In the Turag River, the 2ndhighest concentration is found for Zn with a maximumconcentration of 3.2 mg/L and 2.58 mg/L during winterand summer, respectively. However, the chromium concentrations (mean conc. 0.69 mg/L) in the Turag Riverwater are much lower than that of Buriganga River water(mean conc. 2.85 mg/L). For the Buriganga, the averageconcentration of Ni (1.36 mg/L) is found to be higherthan that of Zn (1.25 mg/L) in the winter. Whereas, for theTurag River, the average concentration of Ni (0.89 mg/L)is found to be lower than that of Zn (1.84 mg/L). In thesummer season, the measured average concentrationsare noted to be decreased to 0.88 mg/L (Zn) and 0.74 (Ni)for Buriganga River and 1.36 mg/L (Zn) and 1.04 mg/L(Ni) for Turag River. The concentrations of Cu and Pb arevery low as compared to the other considered metals, forboth Buriganga and Turag River. Mean concentrationsfor Cu and Pb are found to be 0.80 mg/L (0.57 mg/L) and0.30 mg/L (0.24 mg/L), respectively, in winter (summer)for the Buriganga River. For Turag River, the concentration values of Cu and Pd are 0.95 mg/L (0.55 mg/L) and0.385 mg/L (0.255 mg/L) in winter (summer), respectively. All the values are higher than the toxicity reference values (TRV) proposed by USEPA (1999) [46] fordrinking water. The higher Pb concentration in the TuragRiver might be due to the discharging of waste from thenearby battery industry, textile industries, lead-basedpaints from the dyeing industry or PVC containing children’s toys [50]. Whereas, higher Cu concentration inthe Turag River perhaps due to the dissolution, leaching, sorption, sewage and runoff of the domestic farm[22, 23].The concentration of metals in the Buriganga and TuragRiver water varies seasonally; might be associated withsome complex phenomena like lack of rainfall in winter,Table 3 Comparison of metalsin water (mg/L) with differentinternational guidelines andother studies in the worldwhich might allow metal precipitation, re-suspension anddeposition [31, 47]. The concentrations are found higherin the winter season than that of the summer season. Inthe summer, the minimum value of heavy metals may beattributed to either the dilution impact of River water.Besides, Bangladesh is an agricultural-based country andmost of the agricultural activities are conducting in aroundthe winter season. Thus, the agricultural waste and sewagefrom the farmland might have a direct role for the higherconcentration of Fe, Zn, Cu and Ni in the winter season [40,48]. Moreover, increased anthropogenic activities like brickproduction, excavation, power production, carrying industrial emission, electroplating, smelting, sludge dumping,fuel production etc. also enhance the concentration ofheavy metal in winter [31–33]. The concentration valuesshowing a decreasing pattern from the first sampling siteto the last (BS1 to BS5 and TS1 to TS5) which might beattributed to the increasing distance of the sampling sitefrom industrial discharge and/or domestic sewage discharge point. Concentration levels of most the metals, ingeneral, surpassed several well-recognized quality valuesand in line with certain previous research (Table 3) [46,49, 51–55].3.2 Assessment of Sediment concentrations in RiverThe concentration of trace metals in the sediment of Buriganga and Turag River is presented in Table 4. However,the heavy-metal accumulation is higher in site BS1 and TS1for the Buriganga River and Turag River, respectively. Thelowering of metal concentrations in the other sites is dueto their downstream location of the River with extensivedischarging of urban waste [23, 53]. The concentrations arealso higher in winter compared to the summer season dueto the low water flow in the winter season accompaniedby the increased unsustainable agricultural practices andhuman activity compared to the summer season [31–33].River, locationCrZnFeBuriganga (Bangladesh)Turag (Bangladesh)Korotoa (Bangladesh)River Ganges (India)Bangshi River (Bangladesh)Okumeshi River (Nigeria)DWSBaTRVbWHO 320.0310.0430.088–0.010.3–1.0 0520.070Present studyPresent studyIslam et al. (2015) [49]Gupta et al. (2009) [51]Rahman et al. (2014) [52]Raphael et al. (2011) [53]DoE 1997 [54]USEPA 1999 [46][55]aDrinking water standard for Bangladesh proposed through ECR (Department of Environment, Government of the People’s Republic of Bangladesh, DoE, 1997)bTRV (toxicity reference value) for fresh water proposed by USEPA (1999)Vol.:(0123456789)
Vol:.(1234567890)54.14 29.362823.1557.71 33.1545.95 14.0933.0135.1849.95 15.4030.23 11.2320.1817.1831.60 12.594212.95 158.444218.94137.14252.07 224.34157.03 113.4438.4738.25168.21 122.8028.1530.2771.81 42.17TS5Mean SD67.77 .1120.15108.15TS1TS2Turag28.0131.18 3.8434.06 5.8826.0115.929.25 9.5431.74 9.3317.716.0915.01 1.7018.33 2.0818.244017.074620.05 696.884689.45 680.844101.2320.0425.98 8.5732.14 4.0029.1138.2743.04111.60 48.18BS5Mean SD99.70 rWinterWinterSiteSummerWinterSummerFeZnCrSN Applied Sciences (2021) 3:509 le 4 Level
ers the dissolved oxygen in the River water. Thus, it ham-pers aquatic life and damages the natural ecosystem and water quality [11]. The Rivers Buriganga and Turag are the main receiv-ers of industrial wastewater, flowing around the Dhaka metropolitan, the capital of Bangladesh [12]. Indiscrimi-nate dumping of commercial wastes and discharge of