Transcription
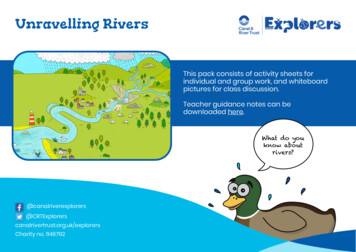
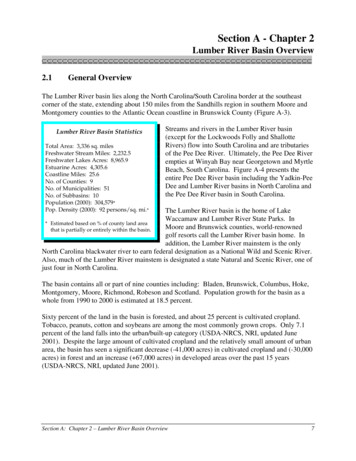
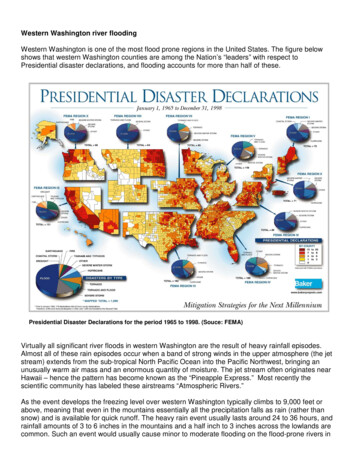
Western Washington river floodingWestern Washington is one of the most flood prone regions in the United States. The figure belowshows that western Washington counties are among the Nation’s “leaders” with respect toPresidential disaster declarations, and flooding accounts for more than half of these.Presidential Disaster Declarations for the period 1965 to 1998. (Souce: FEMA)Virtually all significant river floods in western Washington are the result of heavy rainfall episodes.Almost all of these rain episodes occur when a band of strong winds in the upper atmosphere (the jetstream) extends from the sub-tropical North Pacific Ocean into the Pacific Northwest, bringing anunusually warm air mass and an enormous quantity of moisture. The jet stream often originates nearHawaii – hence the pattern has become known as the “Pineapple Express.” Most recently thescientific community has labeled these airstreams “Atmospheric Rivers.”As the event develops the freezing level over western Washington typically climbs to 9,000 feet orabove, meaning that even in the mountains essentially all the precipitation falls as rain (rather thansnow) and is available for quick runoff. The heavy rain event usually lasts around 24 to 36 hours, andrainfall amounts of 3 to 6 inches in the mountains and a half inch to 3 inches across the lowlands arecommon. Such an event would usually cause minor to moderate flooding on the flood-prone rivers in
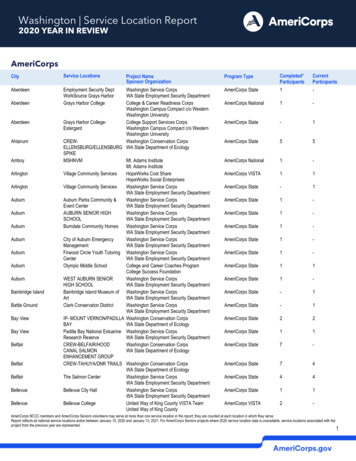
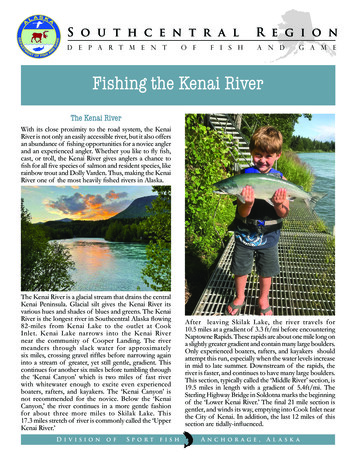
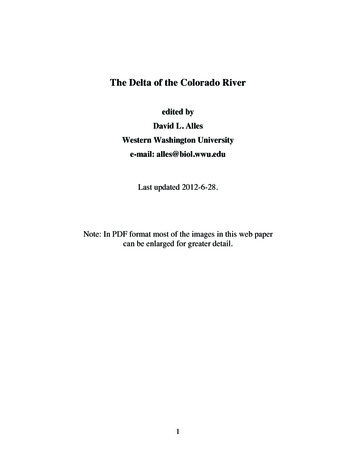
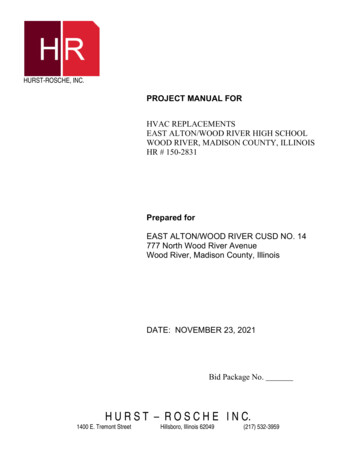
Infrared satellite image of a pineapple express from February 7, 1996western Washington. These events are fairly common – it is rare to go through a cool season withoutat least one such event, and more than one is not uncommon. Indeed the most flood-prone rivers inwestern Washington, like the Snoqualmie River and several others flowing off the west slopes of theCascades and out of the Olympics, usually flood at least once per year.Occasionally an event will continue for several days with a series of waves sustaining the heavyrainfall. Rainfall amounts during prolonged events can exceed 20 inches, and not surprisingly theseproduce our most severe floods.River flooding in western Washington occurs between the months of October and April, but floods aremost common in the autumn and especially November.Western Washington is made up of many relatively small drainage basins that flow off the westslopes of the Cascades or out of the Olympic mountains. The short, steep nature of these riverscauses flood events here to develop rapidly. In addition to the rapid onset, the flood waves movedownstream quickly so the floods have a relatively short life cycle.The example below, from a flood on the Snoqualmie River, shows a typical flood on a westernWashington river. The flood-producing rain occurred over a 42-hour period; in this case the greencolumns on the graph show the 6-hour precipitation amounts at the Snoqualmie Pass rain gauge,which reported a storm-total of almost 10 inches. The river responded dramatically, with the flowincreasing from a base flow of around 2,000 cubic feet per second to more than 40,000 cfs at theSnoqualmie River near Carnation gauge (shown by the red trace on the graph). This was a rise ofmore than 15 feet in around 36 hours.
Snoqualmie River flood of Nov 1995452.5402301.52520115100.56-hr pcpn at SQPflow (thousands of cfs)355011/7/95 0:00011/8/95 0:0011/9/95 0:0011/10/95 0:0011/11/95 0:00dateSQP pcpnTANW1SQUW1CRNW1Hydrograph of a typical western Washington flood on the Snoqualmie RiverThe flood crest moved downstream quickly. The yellow trace shows the Middle Fork SnoqualmieRiver near Tanner, a gauge in the upper part of the basin (lower right on the map below), whichcrested almost simultaneously with the end of heavy rain. The crest moved downstream past theSnoqualmie R at Snoqualmie Falls (blue trace) within 6 hours and the Snoqualmie R near Carnationanother 6 hours later. The flood crest would reach the confluence with the Snohomish River a fewhours later. The total travel time for the crest to move from the upper part of the basin to the mouth ofthe Snohomish River at Puget Sound is around 36 hours.Map of the Snoqualmie / Skykomish / Snohomish River basin
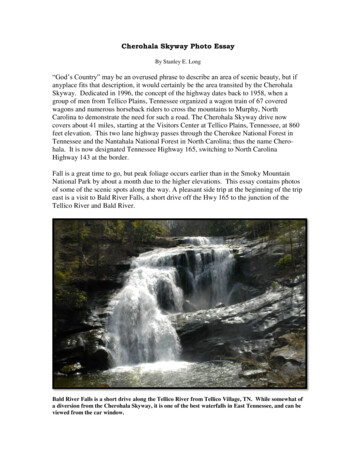
As suggested by the satellite image of a pineapple express shown above these are relatively largescale events, and it is not unusual for a dozen or more rivers in western Washington to floodsimultaneously. Of particular concern this year, of course, is the Green River which drains a relativelyless wet section of the Washington Cascades west slopes. An event that causes the Green River toflood will also cause many of the other rivers in western Washington to flood as well.Map of western Washington and its riversMap of the Green River basin and its river gauging network
Forecasting and warning for river floodingThe rapid response of the rivers makes the forecasting and warning of floods very challenging. Noticethat in the Skykomish River event, significant rain had not even begun 36 hours prior to the riverreaching flood stage.The National Weather Service issues a series of products in the lead-up to an event, progressingfrom a flood potential outlook to a flood watch and eventually to a flood warning. This sequenceof products reflects not only the approaching onset of the event, but also increasing confidence in itsoccurrence and greater certainty with respect to timing and location. This is illustrated in the figurebelow.Flood potential outlook(36 hour to 7 daylead time)Flood watch(12 hour to 2day lead time)Flood warning(0 to 12 hourlead time)Time to onset of event (hours)7248240Increasing confidence that event will occurTo meet its goal of lead times for events, the National Weather Service needs to issue flood potentialoutlooks and flood watches well before significant precipitation has begun. In fact the storm bringingthe potential for flooding would still be well offshore in the Pacific Ocean or even eastern Asia.Therefore the assessment of the potential for flooding depends upon accurate weather forecastingmodels several days ahead of the event. The issuance of a flood warning, which we strive to issue 12hours ahead of a river reaching flood stage, depends upon accurate forecasts of how much rain willfall for how long over specific river basins. It is widely acknowledged that these quantitativeprecipitation forecasts are one of the most difficult tasks in weather forecasting.
A global perspective of the river forecasting and flood warning challengeLet’s take a closer look at the NWS products issued during the lead-up to a flooding episode and thetype of forecasting tools available for use at each stage of the event.Flood potential outlook – issued with 36 hours to several days lead time. The threatening storm willbe still exiting the east part of Asia or over the northwest Pacific Ocean, and it will evolve dramaticallybefore arriving in the Pacific Northwest.Useful forecasting tools include Weather forecasting models Satellite Forecaster experience and climatologyFlood watch – issued with 12 hours to 2 days lead time. The threatening storm will be over thenortheast Pacific or perhaps crossing the dateline. The storm could still undergo significant changesas it moves into the Pacific Northwest.Useful forecasting tools again include Weather forecasting models, including quantitative precipitation forecasts River forecasting models Satellite Forecaster experience and climatology
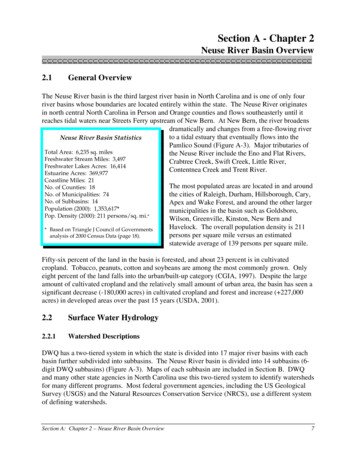
Flood warning – issued with up to 12 hours lead time. The threatening storm will likely be starting tobring significant precipitation to the area, or at least be right at our doorstep. When we issue a floodwarning it is for specific rivers and includes a forecast of the height and time of the flood crest.Useful forecasting tools include Weather forecasting models, especially quantitative precipitation forecasts River forecasting models Satellite Radar Surface observation systems Buoy and ship reports Upper air observations from balloons and aircraftThe NWS forecast office in Seattle works with the NWS Northwest River Forecast Center in Portlandto make river forecasts for western Washington. Essentially, it is the focus of the forecast office inSeattle to provide weather forecasts and meteorological expertise, make warning decisions, andissue the outlooks, watches and warnings. The River Forecast Center in Portland runs the hydrologicmodels, as well as providing hydrologic and meteorological expertise.Schematic chart of the NWS river forecasting process
western Washington, like the Snoqualmie River and several others flowing off the west slopes of the Cascades and out of the Olympics, usually flood at least once per year. Occasionally an event will continue for several days with a series of waves sustaining the heavy rainfall. Rainfall amounts during prolonged events can exceed 20 inches, and .