Transcription
THREATREPORT2019 WEBROOT
What’s inside4Webroot Perspective6Polymorphic Malware and PUAs10Malicious IP Addresses14High-Risk URLs18Phishing Attacks and URLs21Malicious Mobile Apps22Summary and Predicitions for 2019
ForewordHal Lonas Chief Technology OfficerAgile isn’t just a watchword for software development.It has also found its way into the world of cybercrime. In2018, we saw numerous instances of agility and innovationas bad actors evolved their approaches, combined attackvectors, and incorporated more artificial intelligence towreak havoc. While traditional attack approaches arestill going strong, new threats emerge every day, and newvectors are being tried and tested.Looking at the data, the percentage of new files classifiedas malware or potentially unwanted applications (PUAs)is still alarmingly high. Phishing continues to be a majorthreat, now targeting brands like Netflix, Amazon, andTarget in hopes of exploiting people’s tendency to reusepasswords so criminals can, in turn, compromise otheraccounts like online banking. Ransomware declinedsomewhat, with cryptojacking and cryptomining taking itsplace and grabbing headlines for direct attacks as well asnumerous scams. High-risk IP addresses continue to bea problem, especially for sending spam, and the majoritycome from just three countries. Plus, they continue to cyclefrom benign to malicious and back again to avoid detection.We’re also starting to see more attacks that target routers,allowing cybercriminals to access details about otherdevices on the network, and to sniff for unencrypted trafficand conduct man-in-the-middle and cryptojacking attacks.Criminals take advantage of the fact that these devices areoften outdated, difficult for home users to log in to, anddisplay few signs that they have been compromised.At Webroot, we also focus on agility and innovation. Eachyear, we further refine our patented machine learningmodels, which we use to analyze actual data from 67million real-world sensors around the globe, to help uspredict emerging threats. The 2019 edition of our annualThreat Report details what we’ve learned about threatactivity throughout 2018, and compares the data with thatfrom years past. As always, we share our knowledge andinsights so that you can combat cybercrime today, and inthe year to come.
WEBROOT PERSPECTIVEThe Webroot Platform integrates huge amounts of data that isautomatically captured from millions of real-world endpoints andsensors, carefully vetted third-party databases, and intelligencefrom over 50 million end users protected by our technologypartners. The statistics, trends, and insights in this report arebased on our analysis and interpretation of these billions of datapoints. In addition, the Webroot Threat Research team providesa further layer of insight and context spanning a broad range ofthreat activity, including:» Trends in (mostly polymorphic) malware and potentiallyunwanted apps (PUAs)» Ransomware, cryptojacking, and cryptomining» Malicious IP addresses and the risks they poseAs in last year’s report, we look at Windows 10 and how itsadoption has increased security for consumers and businesses.In new sections in this year’s report, we examine the likelihoodthat individual PCs will experience multiple infections, anddiscuss the locations where malware is likely to hide onbusiness and consumer systems. We also delve deeper intonewer methods for monetizing attacks like cryptojacking andcryptomining, which have been gaining in popularity as attackersshift away from ransomware. Finally, we look at an emergingtrend in which cybercriminals use multiple methods in a singleattack to increase their likelihood of success. The findings andinsights in this report bring further clarity to the threats we seetoday, and offer guidance to our customers and partners to helpthem better prepare for and address attacks in the coming year.» URL classifications and security trends» Phishing attacks and their targets» End user awareness and training» Mobile app threatsAs a pioneer in the field, Webroot has more than 10 years ofexperience using machine learning, as well as 10 years’ worth ofhistorical threat data—that’s 6 petabytes—which we use to makehighly accurate predictions about threats and attack methods.DAVE DUFOUR VP OF ENGINEERING4
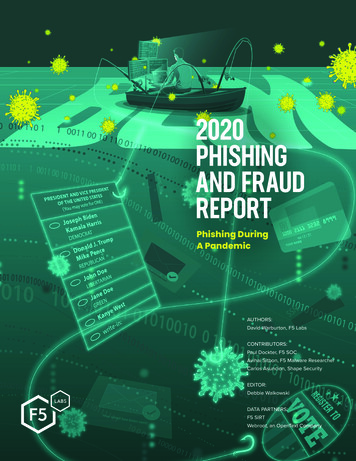
THE WEBROOT PLATFORM USES 6THGENERATION MACHINE LEARNING TO ANALYZE500 BILLION DATA OBJECTS EVERY DAY.750M 32B 4B 31B 62M 67M DomainsIP AddressesMobile AppsURLsFile BehaviorsConnected Sensors5
POLYMORPHIC MALWAREAND PUASIn 2017, 93% of malware and 95% of potentially unwantedapplications (PUAs) were polymorphic, and this trend continuedthroughout 2018. Polymorphic code makes a change to a singleinstance of malware (through names, encryption keys, signatures,hashes, function instructions or the order of execution flow) so itcan be delivered to a large number of people while still evadingdetection. Because polymorphic malware and PUAs never havethe same identifiers, existing signatures will never match thenew variant; this means that pattern-matching security productscannot detect new variants quickly enough to prevent infections.In 2018, 93% of malware seenby Webroot was polymorphic.Endpoints running Webroot protection see more than fivehundred million brand new, never-before-seen portableexecutable (PE) files each year, and this number continues toincrease. But, while the number itself is going up, the percentageof files that are determined to be malware or PUAs is goingdown. Of the new PEs seen in 2018, less than 1% were deemedmalware, compared to 1.5% in 2017 and 2.5% in 2016. Thedecline in PUAs in 2018 was even more dramatic (see Figure1), dropping to 0.11% from 0.4% in 2017 and 2.2% in 2016. Wewill explore possible reasons for this decline later in this report.Of the endpoints reporting an infection, 68% were consumerdevices, while 32% were business endpoints. When we lookat the average number of malware files per device, we see adramatic decline in 2018 (Figure 2).6201620172018Percent of executable files thatare malware2.5%1.5%0.88%Percent that are PUAs2.2%0.4%0.11%Figure 1: PEs determined to be malware or PUAs201620172018Total malware files per device0.660.480.07Malware per consumer device0.590.530.09Malware per business device0.610.420.04Figure 2: Average number of malware files per deviceIn Figure 2, we see that, on average, consumer devices are infectedmore than twice as often as their business counterparts. However,the business landscape is not populated solely by corporateowned PCs. Many companies allow their employees to connecttheir personal devices, including PCs, to the corporate network,which greatly increases the level of risk to the organization.
While the decline in malware is real, it is hardly mission complete.We’ve seen continued innovation in tactics and techniques,particularly with Emotet and Trickbot in 2018. Adding UPnP andTor functionalities, respectfully, have made these threats moreresilient and difficult to knock offline.GRAYSON MILBOURNE SECURITY INTELLIGENCE DIRECTORTHE ROLE OF OPERATING SYSTEMSThe operating system (OS) plays an important part in thedecrease in new malware and PUA files seen. As we saw lastyear, the move to Windows 10, which is a generally safer OS inwhich antivirus is always on, helps explain the downward trend.Devices that use Windows 10are at least twice as secure asthose running Windows 7.Of business endpoints running Webroot protection, more useWindows 10 than Windows 7 (45% and 43%, respectively),while just 3% run Windows 8 and only 1% still use WindowsXP (which Microsoft stopped supporting several years ago). Infact, business use of Windows 10 reached a tipping point inNovember 2017 and has been steadily increasing at a rate ofabout 1.2% per month. Nevertheless, growth is slower thanone might expect, given the obvious security benefits of thisnewer operating system, and we anticipate that it will be twoor three more years before we see Windows 10 usage in theConsumerBusinessbusiness world on a par with consumer adoption. In general, thebusiness sector has been slower to move away from older versionsof the Windows operating system, perhaps due to softwarerequirements for legacy operating systems like Windows 7 and XP.On the consumer side, Windows 10 adoption remains steady atapproximately 75%, without much movement throughout the year.Meanwhile, Windows 7 stands at 13% and Windows 8 at 9%.Overall, Windows 7 shows a higher rate of infections per endpointdevice (.07) than Windows 10 (.05). However, when looking atconsumer versus business devices, the story is quite different.Consumer systems saw more than twice as many infections perendpoint (.09) as business systems (0.04 per endpoint). Thenumbers are even more striking when viewed in terms of theOS. Consumer systems running Windows 7 saw an average of0.18 infections, while business systems running that version ofthe OS saw only an average of .04. For Windows 10, consumerendpoints saw an average of .07 infections, whereas businessendpoints saw, on average, only .02. Almost all representdecreases from previous years (see Figure 3).201620172018Average0.660.480.09Windows 70.590.530.18Windows 100.610.420.07Average0.110.070.04Windows 70.190.070.04Windows 100.050.030.02Figure 3: Infections per endpoint7
Over the last year, we have seen a relatively steady decline inmalware on Windows 10 machines for both consumer and business.There were spikes for malware on business PCs running Windows10 in the period from September through December, likely due toback-to-school and holiday malware campaigns.While malware and PUAs are decreasing as a percentage of newfiles seen, the numbers are still noteworthy, and the threat is notgoing away. There are several possible reasons for the decreasein the number of malware and PUA files seen by Webrootprotected devices.»» First, Webroot now detects malicious activity even earlier inthe kill chain. In other words, we block executable files frominfecting endpoints via malicious URLs (see URL sectionon page 14) and prevent executables on endpoints fromdownloading additional bad executables.»» Second, changes in the malware ecosystem—e.g. the factthat drive-by download exploits have largely dried up andattackers are finding easier ways to profit than installingmalware—contribute to the reduction in the percentage ofnew files classified as malicious.»» Third, as we have mentioned, Windows 10 is a safer operatingsystem than others. Windows Defender will activate itselfon a system if other antivirus solutions become inactive.Because of this, security is stronger overall and there arefewer infections.When it comes to PUAs, companies like AppEsteemi may alsocontribute to the decrease: they enable end users to downloadand use apps with less risk. App vendors can develop anddeliver clean apps by following clear rules that are reviewed bycybersecurity companies, thereby being certified as safe.A DEEPER DIVE INTO MALWAREWebroot has added more sources of information and analysis during2018, and the more information we can provide to administrators,the better they can protect their organizations. This year, new dataincludes the number of machines on which malware is seen andthe locations where threat actors hide malware.Over half of devices that becameinfected once were re-infectedwithin the same year.In 2018, we found that 93% of malware was only seen on a singlePC, and of the machines that were infected, over half (54%) sawmore than one infection over the course of the year. More than39% of consumer endpoints that were infected at least oncesaw between 2-5 infections in 2018, while the percentage forbusiness endpoints was slightly lower, at 35%.This is likely the result of multiple polymorphic files attackingindividual devices. Additionally, when Webroot protection isfirst installed on a PC, it often finds multiple current infections.Another reason for the high incidence of PCs reporting morethan one infection is that some malware drops multiple files(see Swiss Army Knife section on page 19). The net result is thatadministrators must remain vigilant; endpoints infected onceare likely to become infected again over the course of a year.Nearly 54% of malware in 2018hid in the %appdata% and%temp% folders.Repeat infections often have behavior-based causes. Users whofrequent torrent sites for game cheats or activation keys shouldknow these are almost always infected. Other behaviors likeinstalling untrustworthy apps without carefully evading bundledsoftware also contributes to repeat infections.GRAYSON MILBOURNE SECURITY INTELLIGENCE DIRECTOR8
New in this year’s report is detailed information on wheremalware tries to install itself. We compile this data by normalizingthe paths from various Windows operating systems and versionsto display a consistent view of the paths, and then base thepercentages on new file encounters and ratios of where malwareis found. Based on our analysis, we have found several likelyspots where malware hides, including %appdata%, %temp%,and others—although, realistically, malware can hide almostanywhere. See Figure 4 for details.Malware Installation Figure 4: Common malware installation locations on Windows machinesWe encourage administrators to create policies that look foranomalous behavior in the %cache%, and %temp% directories;for example, policies could prevent files from executing fromthese directories. By doing so, admins could eliminate more than40% of the opportunities malware has to launch itself.Overall, we can conclude that while there are somewhat fewerinstances of malware and PUAs, the problem hasn’t gone away;it has just changed, and extreme vigilance is needed. Efforts tomake operating systems cleaner and render it more difficult toinstall PUAs have contributed to an overall decrease. We see thatbusiness PCs are safer than consumer PCs, and those runningWindows 10 are safer than those running Windows 7. However,the trend of allowing employees to bring their personal devicesto work and connect them to the corporate network increasesorganizational risk.WHAT HAPPENEDTO RANSOMWARE?While the ransomware attacks of 2017 spread fear and panic acrossThe %appdata% directory is a good example of why locationmatters. Malware authors often try to install the main launchingapplication into a subdirectory of the %appdata% folder, whichcontains application settings, files, and data specific to theapps on a Windows PC. For consumers, we detected 31% of the%appdata% files as bad, whereas only 24% of the %appdata%files were found to be malicious for business users. The higherpercentage of malicious files found in consumer folders islikely because %appdata% is only updated when a new app isinstalled, and app churn is lower in the consumer space thanbusiness. However, when it happens, these apps are more likelyto be infections, and a consumer PC is typically less secure thana business one.the globe, with companies scrambling to safeguard mission-criticaldata and paying millions in ransoms via cryptocurrency, the story in2018 was much different. Ransomware has proven to be an effectivetool to extract money from targets who are not prepared, but potentialvictims are now doing a better job of securely backing up their data,making it more difficult for attackers to scare users into paying theransom. As a result, ransomware has evolved to be more targeted,better implemented and, therefore, much more ruthless.Some examples of ransomware attacks in 2018 include attacks on portsin Barcelona, San Diego, and Long beach; airports in Bristol and Atlantawere hit with ransomware attacks, and government and health careorganizations (including one US hospital that paid a 55K ransomii) weretargeted this year. One very high-profile ransomware attack, knownas SamSamiii, encrypted hundreds of networks in the U.S. and othercountries and resulted in more than 6 million in payouts before theIn looking at new files seen in 2018, other folders where malwareoften hides include:criminals were indicted. Total damages from that attack on more than»» %temp% – 24.5% overall, 30% for business,23% consumer»» %cache% – 17.5% overall, 11.3% for business,19.2% for consumer»» %windir% - 12.3% overall, 19.2% for business,10.5% for consumerscan for systems with inadequate RDP settings. These unsecured RDP200 victims exceeded 30 million. SamSam used the Remote DesktopProtocol (RDP) as an attack vector, leveraging tools such as Shodan toconnections may be used to gain access to a given system and browseall its data as well as shared drives, providing criminals enough intel todecide whether to deploy ransomware or some other type of malware.Despite repeated warnings, many companies still do not protect theirRDP connections sufficiently.9
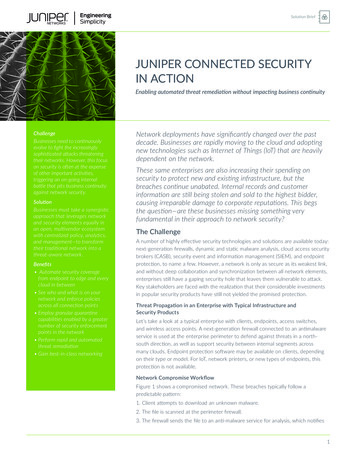
MALICIOUSIP ADDRESSESEach year, Webroot sees millions of malicious IP addresseswhich are used to send out spam, distribute malware, obfuscatethe origin of malicious traffic, or otherwise enable bad actors towreak havoc with consumer and business computers. We trackthese IP addresses by the malicious activities they carry out:scanners or proxies, spam, Windows exploits, web or denial ofservice (DoS) attacks, botnets, phishing, and mobile threats. Thebest way to address the potential danger of malicious IPs is toblock them automatically so they cannot do damage. But doingthis requires an in-depth understanding of IPs, their locations,and their actions, in order to proactively block them.Beyond spam, the most frequent activity seen in relation tomalicious IPs was open proxies at 9% (including anonymous andTor, which allow anonymous traffic to pass through), followed bybotnets at 4.3%, up from last year’s 3% rate.Scanners came in at only 2% but still represent a troublesomethreat; hackers scan environments to learn specifics about thenetwork configuration, software installed, and user data sothey can tailor attacks to that particular environment. Windowsexploits dropped dramatically from last year’s 9% to just 1.1%.While the move to Windows 10 factors into this drop, anotherimportant reason is activity in the white hat space, e.g. GoogleProject Zero, which results in earlier discovery of vulnerabilities,greater disclosure, and fewer exploit kits. Windows exploitsremain a popular method for distributing malware becausethey leverage a vulnerability in the operating system, software,Of the malicious IP addresses we saw in 2018, a colossal 82%were categorized as malicious because of spam (see Figure 5).The figure itself represents a significant increase from previousyears: in 2017, 65% of the malicious IPs found were sending op 10,000 Bad IPsTop 10,000 Bad IPsTop 10,000 Bad IPs58%1.1%2.4%Figure 5: Categories of malicious IP addresses in 201810
Exploit kits are still prevalent but are much less effective againstfully patched systems. The impact of bug bounty programs, Google’sProject Zero and automated fuzzing tools have greatly improvedboth the security and stability of software making it more difficult toexploit as a vector for infection.GRAYSON MILBOURNE SECURITY INTELLIGENCE DIRECTOR25 of the top recurring malicious IP addresses were reused 95 times.browser, or plug-in; consequently, we expect the activity hereto ebb and flow as threat actors save exploits for high-profiletargeted attacks.for benign purposes, then again for botnets multiple times during theyear.) For spam, 8,704 IPs accounted for more than 185,000 transitions,and 4,848 scanner IPs were used in more than 103,000 transitions.It’s important to keep in mind that IP addresses are not staticand may cycle from malicious to benign and back multiple times.While 60% of the millions of malicious IP addresses we sawin 2018 only appeared on the list once, hundreds of thousandsappeared at least two or more times. In fact, 25 of the toprecurring IP addresses were reused 95 times. IP addresses areoften reused to carry out botnet, spam, and scanner activity.Another review showed that 193 IPs accounted for more than11,000 transitions (that is, IPs that were used for botnets, thenHere’s an example of how this works: we see a server sendingout spam emails and we identify the IP address as a spamdistribution node. Because of this undesirable behavior, we addthe IP to a blacklist. But it doesn’t stay there indefinitely. IPs onthe blacklist are revisited to see if they still exhibit maliciousbehavior. If not, they leave the blacklist, but we record thehistorical behavior of each IP address, which influences their IPreputation scores. Hundreds of thousands of new IPs are addedto and removed from the blacklist multiple times a day.SCANNERSPHISHINGWINDOWS EXPLOITSOverallOverallOverall2%1.4%1%Top 10,000 Bad IPsTop 10,000 Bad IPsTop 10,000 Bad IPs27%1.3%9.2%Figure 5: Categories of malicious IP addresses in 201811
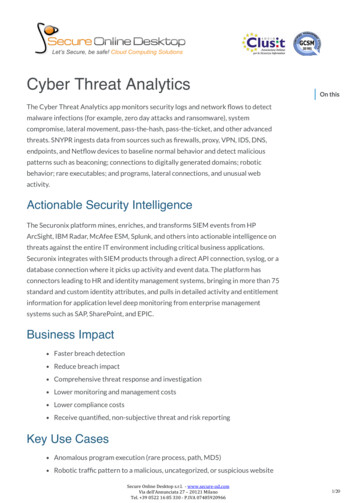
We often find the same IPs reused for malicious purposes on alater date. Of the top 10,000 IPs we analyzed, 48.6% of themwere recorded as malicious 20 times or more. More than 150of them traversed the black list 50 or more times, and a smallpercentage (1.5%) were on and off the black list even moreoften than that.Interestingly, we found that, of the top 10,000 most recurrentIP addresses, more than half were used for multiple types ofmalicious activity. For example, they might be used for webattacks, Windows exploits, and proxy or Tor activity. We found that16 addresses were used for six different major types of maliciousactivity, and two were used for all seven. While clearly in theminority, this multi-use tactic has implications for IP reputationservices and informs how we track them and help our customersdeal with them. See the Swiss Army Knife section on page 19 foran in-depth look at how attackers are becoming more agile andusing multiple tools to carry out attacks.3%When we look at malicious IPs by geographical area, we sawactivity from all 195 countries, but found that most of the badIPs came from a handful of locations. In fact, China, the U.S., andVietnam account for more than 60% of all malicious IP addressesseen. The figure goes up to more than 80% when you include therest of the top ten: Germany, Canada, South Korea, Chile, Brazil,Russia and India. Figure 6 shows the top ten.When we focus on the top 10,000 repeat offenders—i.e. IPs thatare malicious, benign, and then malicious again at least once—we see that Vietnam and China have the largest percentage. Thesetwo countries account for almost 57% of the repeat offenders inthe top 10,000 list. The top ten countries by repeat IP count areVietnam, China, the U.S., Hungary, India, Russia, France, Malaysia,Brazil, and Switzerland. Interestingly, Vietnam shows a higherthan-normal hosting/reuse of IP addresses for malicious purposeswith 662,000 unique IP addresses. It also represents more than40% of the top 10,000 in terms of repeat offenders, indicating IPreuse is rampant in Vietnam. Although the reasons cannot be fullydetermined, it is likely that aging infrastructure, heavy reliance onolder, less-secure operating systems like Windows XP, and lessstringent law enforcement make it easier to target businesses inVietnam and exploit their networks.12Canada21%United States12% in 20172%Chile2.6%Brazil
China, the U.S. and Vietnam account for60 % of all malicious IPs seen.5%1.9%GermanyRussia6% in 20173% in 201728%China12% in 2017India 1.8%13%3% in 20172.6%South KoreaVietnam4% in 2017Figure 6: Top 10 countries for malicious IP activity13
HIGH-RISK URLSWebroot has categorized more than 32 billion URLs to date,continuously examining their history, age, popularity, location,networks, links, real-time performance, and behavior. Weclassify them in terms of their primary purpose (e.g. shopping,adult sites, gambling, etc.) or malicious intent (such as phishing,botnets, malware sites, spam sites, etc.) This intelligenceis provided to network and security vendors via WebrootBrightCloud Web Classification and Web Reputation Services,which organizations can use to set web policies to protect users.Between January and December2018, the number of phishingsites detected grew 220%.In 2018, Webroot classified hundreds of millions of uniqueURLs, approximately 3% of which were classified as high risk.The number of phishing sites per day, in particular, more thandoubled over the course of the year. The number of botnetsfluctuated, but there were spikes in October and November,likely related to virulent attacks such as Emotet (described in theSwiss Army Knife section on page 19.) Some fluctuations in thelevel of activity are due to seasonal factors, such as the fact thatattacks ramp up during back-to-school time and the holidays.Malware is undoubtedly the most interesting category of high-riskURLs, due to the prevalence of cryptojacking and cryptominingactivities. These sites, which leverage site visitors’ hardware tomine cryptocurrency represent a significant percentage of themalicious URLs seen by Webroot, and recent enhancements intracking will undoubtedly reveal far more than we have seen to date.CRYPTOJACKING AND CRYPTOMININGCryptojacking is the practice of using browser-based programs thatrun via scripts embedded in web content to mine cryptocurrency withunused CPU without the user’s knowledge or consent. Cryptominingis when criminals install malware that usurps a user’s CPUto mine cryptocurrency. Both of these techniques have grownrapidly to become major threats, as they can be more lucrativethan ransomware attacks, and have a smaller illegal footprint.Monero continues to be the cryptocurrency of choice for thesetypes of attacks for a variety of reasons. Its innovative use of ringsignatures and decoys to hide the origin of the transaction ensuresthat it’s completely untraceable. Once criminals receive paymentto a Monero wallet address, it can be sent to an exchange where itcan be cashed it out as if it were clean.Cryptojacking has been out over a year now, so people are aware of it andknow how to block it. But the way they’re blocking it with browser add-onsis very rudimentary. As this threat evolves and criminals start to obfuscatethe domains, those add-ons will become obsolete and real-time threatintelligence will be the only effective way to block cryptojackers.TYLER MOFFITT SECURITY ANALYST14
In 2018, millions of URLs used cryptojacking.Beyond the obvious utility of an untraceable transaction system thatdoesn’t need to be laundered, Monero is one of the few cryptocurrenciesthat maintain ASIC resistance. Most cryptocurrencies use a proofof work mining system, but the algorithm used to mine the blockscan be worked by a specialized chip (ASIC), which is designed tospecifically hash that algorithm and mine that cryptocurrency.Companies like Bitmain have thrived on creating ASIC machinesthat are so much more efficient they render consumer-grade CPUsand GPUs obsolete. The Monero development team maintains analgorithm that makes sure it stays ASIC-resistant. This meansthat Monero can be mined profitably using consumer-grade CPUsand GPUs in personal computers and will be able to do so for theforeseeable future. Massive price fluctuations have caused someups and downs in the popularity of both types of attack, as the entirecrypto market has lost 85-90% of its value over the past year.Nevertheless, huge robberies, hacks and mining operationsmade the news in 2018:»» Strong arm robberies of high-profile crypto investors andtraders resulted in the loss of assets in the millions of dollars,and sometimes even loss of life.iv»» More than 731 million worth of cryptocurrencies were stolenfrom crypto exchanges in the first half of 2018.vDespite the decrease in cryptocurrency prices, the number ofsites using these attack methods has increased significantlyover 2018. Since the victim is responsible for the power billand the increased stress on their hardware associated withillicit mining, these attacks cost next to nothing and startmaking money for criminals almost immediately. As long ascryptocurrency is worth something, the potential profits will stillbe very attractive for criminals. The level of cryptojacking URLswe saw each month in the first half of the year more than doubledin the period from September through December. Cryptojackingwill remain popular, as it generates profits without needing toinfect a PC. We have seen increased competition in web-basedcryptojacking with several new sites offering the functionalityin 2018. For a long time, the only real player was Coinhive, whocreated this new type of attack back in 2017. While Coinhivestill dominates with more than 80% market share, some newcopycat cryptojacking scripts are gaining in popularity, such asCryptoloot, JSEcoin, Deepminer, Coinimp, Minr, and Omine.The detection rate for cryptojacking by Webroot end users attemptingto visit those URLs showed a steady decline in 2018, despite a spikein September (see Figure 7). Of the annual detections, 11% werefound in January, compared to just 5% in December. This decreasecan likely be attributed to the decline in cryptocurrency valuecoupled with improved detection and blocking capabilities at thenetwork layer.Figure 7: Cryptojacking detections throughout 201815
MALICIOUS URLS BY COUNTRYWe have also seen evidence of browsers improving their protectioncapabilities against cryptojacking during that time. However, weanticipate a future decline in the effectiveness of cryptojackingprevention from browsers and extensions, as criminalsexperiment with obfuscation to avoid detection.By far the biggest contributor of malicious URLs was the U.S. at63%, followed by China at 5% and Germany and Hong Kong at4% each. Russia and the Netherlands each came in at 3%.The fact that the majority of sites hosting malware are locatedin the U.S. is a big change compared to previous years, in whichthe U.S.
decrease in new malware and PUA files seen. As we saw last year, the move to Windows 10, which is a generally safer OS in which antivirus is always on, helps explain the downward trend. Devices that use Windows 10 are at least twice as secure as those running Windows 7. Of business endpoints running Webroot protection, more use