Transcription
TABLE OF CONTENTSFOREWORD3THE WEBROOT PERSPECTIVE4MALWARE6RANSOMWARE10HIGH-RISK URLs12PHISHING ATTACKS16MALICIOUS IP ADDRESSES18HARMFUL MOBILE APPS20SECURITY AWARENESS TRAINING21PREDICTIONS22CONCLUSION23
FOREWORDHal Lonas, SVP and CTO, SMB and Consumer, OpenTextAs we embark on a new decade, it’s striking to think how manymajor changes have taken place in the very recent past. Considerthis: we’ve been living in the smartphone era for over ten years. Ifwe think back even further, the “cloud” grew from a mere conceptin the 1960s to a buzzword in the early 2000s—then into theubiquitous state of strategic computing today, in which public, privateand hybrid clouds are everywhere. User expectations, in particular,challenge the way businesses operate around the world. For those ofus who remember the days of dial-up: try to recall how long it tookto connect, let alone download an image! Today, each of us expectsto receive personalized, relevant, and immediate experiences, quicklyand without lag, via cloud, mobile, social, and artificial intelligence—while simultaneously expecting our personal data will remain securedand private.One thing that hasn’t changed is the relentlessness with whichhackers work to steal data, compromise systems, and generate profit.Many of the tactics remain the same; phishing has been around forages and it’s still a primary tool for dropping malware and gainingunauthorized access to sensitive information. Meanwhile, othertactics have evolved significantly; if we think back to ten years ago,we hadn’t yet heard of ransomware, the effect of cloud computingon security was a big question mark, and only 28% of attacks usedsocial engineering tactics.1 The last couple of years, in particular, havemade a remarkable impact on the threat landscape. For instance,malicious IP addresses, URLs that take unsuspecting users todangerous sites, cryptojacking that mines for cryptocurrency withoutthe user’s knowledge or consent, ransomware in its variations, andincreasingly vicious and stealthy malware—all of these are newerdangers to businesses and individuals alike.In this year’s Webroot Threat Report, we take a deeper look intowhat we’ve seen in these and other categories, and include furthercontext on targeted industries and common malware locations. Withan in-depth view of massive amounts of both good and bad webtraffic, we use our informed understanding of what has happenedduring the past decade to foreshadow what 2020 may bring, and helpyou make sense of these trends in a rapidly changing world.Today, each of us expects toreceive personalized, relevant,and immediate experiences,quickly and without lag, viacloud, mobile, social, andartificial intelligence—whilesimultaneously expectingour personal data will remainsecured and private.3
THE WEBROOT PERSPECTIVEThe statistics, trends and insights in this 2020 Webroot ThreatReport are based on massive amounts of data continuously andautomatically captured by our advanced machine learning-basedarchitecture, the Webroot Platform. This data—which comesfrom millions of real-world endpoints and sensors, specializedthird-party databases, and end users protected by our technologypartners—is then analyzed and interpreted on a continuous basisby our advanced machine learning engines and Threat Researchteam. The retrospectives, trends, and predictions in this reportcover a broad range of threat activity, including: Trends in malware, who it affects, where it hides, andgeographical and industry analysis URL classifications and security trends, includingcryptojacking Phishing attacks and their targets Malicious IP addresses and their impact on security The continuing scourge of ransomware Mobile app threats and how they are evolving4Each of the aforementioned threats has wide reaching impactsacross multiple industries, geographical regions, and user groups.We’ll break it all down by the numbers, and also demonstrate howeffectively employing end user awareness and training can mitigaterisk of compromise. Finally, in the Predictions section, we’ll look athow our comprehensive, global view informs what we expect to seein the coming year.
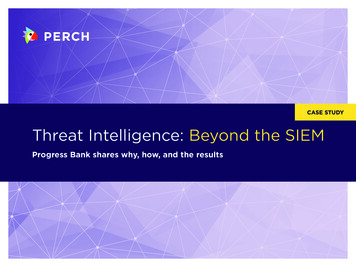
WEBROOT BRIGHTCLOUD THREAT INTELLIGENCE95 Million real-world sensors78 Million end users protected through technology partners842 Million domains37 Billion URLs4 Billion IP addresses36 Billion file behavior records31 Million active mobile apps5
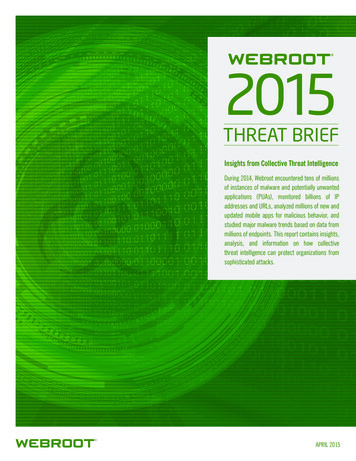
MALWAREOver the past ten years, we’ve seen that malware authors andattackers are highly adaptable and extremely focused. We onlyneed to look at the rapid increase in malicious files found on onlya single machine to see how authors have learned how to evadetraditional cyber defenses via polymorphism.CONSUMER VS. BUSINESS DEVICESOf the endpoints reporting an infection, 62% were consumer (homeuser) devices, while 38% were business systems. This discrepancyis likely due to businesses having more layers of security in place,and also the increase in businesses providing security awarenesstraining for their employees. Overall, the number of malware filesper device is going down year over year for consumer PCs, but itremains roughly the same as last year for business PCs.Consumer devices continue to become infected much more oftenthan their business counterparts. For this reason, it’s important tounderscore the risk companies run when they allow their workersto connect personal devices to the corporate network. With a higherprevalence of malware and generally fewer security defenses inplace, it’s easier for malware to slip into the corporate network viaan employee’s personal device.In 2019, 93.6% of malware detectedwas only seen on a single PC. Thisis the highest yearly rate we’veever seen, although the numberhas been above 90% since 2014.Malware has become a favorite tool of nation-states, whichemploy (and, occasionally, lose control over) highly advanced,zero-day exploits to wreak havoc on businesses, governments, andorganizations in general—witness the EternalBlue exploit.2 Add tothat the impact of the cloud, the ubiquity of mobile phones, andit’s easy to see how much malware has evolved in the last decade.One thing’s for sure: Windows malware hasn’t gone away.Webroot-protected Windows endpoints see more than 1.6 millionnew malware and Windows applications each day. This numbercontinues to grow, up from around 1.369 million per day theprevious year. That tallies up to 500 million in 2018, and close to600 million in 2019. In other words, we see a massive, growing,perpetual flow of file data.6Consumer devices remain approx.2x more likely to become infectedthan business systems.One thing that is especially interesting to note is the frequency withwhich PCs were re-infected.In 2019, 12.6% of consumer PCs encountered an infection.Of these: 46.3% encountered only one infection35.8% encountered 2-58.6% encountered 6-109.2% had more than 10 infections12.6%7.8%Consumer PCs infectedBusiness PCs infected
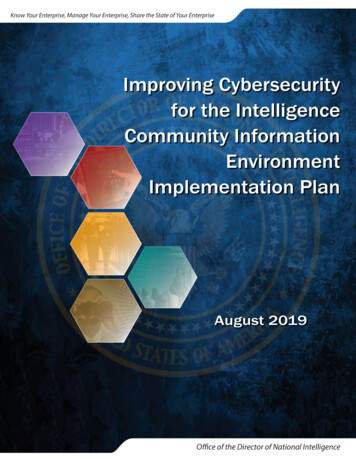
In contrast, only 7.8% of business PCs encountered an infection.Of these:The slight drop in the annual total of malware files is likely due toseveral factors. Security Awareness TrainingBecause users are the first line of defense, security awarenesstraining is increasingly important. Gartner says end-userfocused security education and training is a rapidly growingmarket and estimates that “by 2022, 60% of large/enterpriseorganizations will have comprehensive security awarenesstraining programs.”350.4% saw just one infection33.2% saw 2-57.9% saw 6-108.5% saw more than 10There are several possible reasons for systems to encountermultiple infections; it could be the result of multiple polymorphicfiles attacking a single PC, or a single piece of malware droppingmultiple files. It could also be due to occasions in which, whenWebroot protection is first installed on a machine, it findsmultiple current infections. Regardless, the message here is thatadministrators and individuals alike must remain vigilant.WHY THE OS MATTERSAs we’ve seen in the past two years, the move to Windows 10(a generally safer OS) helps explain some of malware declines inthe data. Overall, systems running Windows 7 are nearly threetimes as likely to get infected as Win10 devices; each operatingsystem sees an average of 0.11 and 0.04 infections per endpoint,respectively.Malware targetingWindows 7 increased by 125%.In general, we can say that Win10 sees fewer infections, with0.06 per device for consumer PC and 0.02 per device for businessPCs. The magnitude of the Win7 problem depends on how manyconsumer and business PCs are running that OS. In 2019, we sawthat 82% of consumer PCs were running Win10, versus just 10%Win7, whereas business PCs stood at 63% for Win10 and morethan 25% on Win7. We expect this percentage to decrease asMicrosoft no longer supports Win7.When looking at infection rates per endpoint, the differencesbetween the consumer and the business world are clear. Infectionsper consumer system are steadily declining overall (from 0.11 in2017, to 0.10 in 2018, and down to 0.08 in 2019) but the aggregatefigures mask an important fact: Win7 rates grew from 0.17 to0.20 infections per device. Although we expect the number ofWin7 endpoints to decrease, the amount of malware specificallytargeting Win7 is likely to increase for the same reason; if Microsoftno longer supports Win7, they will no longer patch vulnerabilitieswithin the OS. Technological EffectivenessThe data we present is gathered from Webroot-protectedendpoints. Our layered, multi-vector approach detects andblocks activity earlier in the kill chain. For example, by blockingexecutables from hitting endpoints via malicious URLs orpreventing .exes from downloading additional malware files, wecan reduce the incidence of malware executing on protectedendpoints. Changes in Cybercriminal ActivitySome cybercriminals have refocused on attack methods thatgenerate profit from remote systems more easily than malwaredoes, such as phishing or cryptojacking. In addition, criminalshave moved to a more targeted malware business model, inwhich they launch fewer attacks and deploy less malware, butdo so with a higher success rate. Better Operating System SecurityThe mass adoption of Windows 10 (with antivirus always on)and efforts by the security community and the security industryat large have also been a factor.INFECTIONS BY REGION AND INDUSTRYIf we track the rates of infection on Windows devices bygeographical region, the view presents striking differences. At firstglance, it’s easier to see the rate of infected consumer devicesversus business PCs.Additionally, infection rates vary widely by geographical area.Nearly a quarter (23%) of devices in the Middle East encounteredan infection in 2019; Asia was close behind, followed by Africa, andSouth America. In contrast, Europe, North America, and Japan sawmuch lower rates.7
United Kingdom5.6%21.6%4.2%8.8%North AmericaAsiaEurope4.3%23.2%16.8%15.7%JapanMiddle EastAfricaSouth America4.9%0%Australasia12.5%25%LOW HIGHFigure 1a: Infected devices by regionConsumer devices Business deviceswith infectionswith infections0%Devices .6%4.1%Japan39.6%51.3%Middle East26.9%16.6%Middle East35.3%50.1%North America6.9%3.9%North America19.6%69.8%South America17.9%10.5%South America22.5%63.1%United Kingdom9.6%3.7%United Kingdom26.0%62.2%14%Figure 1b: Infected consumer and business devices by region8Devices runningWin728%0%35%Figure 1c: Infected Win7 and Win10 devices by region70%
To better understand the infection rates, we need to look at regionaldata by OS. In general, Win7 represents 21% of the base, whileWin10 represents 68%. But if we look at regions with very highinfection rates, we can correlate that to the prevalence of Win7.For example, in South America, more than 22% of the PCs arerunning Win7; in Africa the figure is 31.5%; in Asia it’s 33.4%; andin the Middle East, it is 35.2%. All of these regions show high ratesof infection per device, and regions with large volumes of Win7PCs are subject to an increasing number of threats. Again, thethreat rate is growing for Win7 while it remains flat or decreasesfor Win10. In contrast, in North America, almost 70% of PCs arerunning Win10, and the infection rates are low.A variety of factors may contribute to these rates of infection. Forinstance, regions that have greater economic resources, betteraccess to up-to-date technology, and stronger awareness ofcybersecurity concerns and risks (such as the US and Europe) tendto show fewer infections per device, especially for business PCs.Regions with fewer up-to-date devices, i.e. large numbers of Win7PCs, show a greater number of threats.Another way to look at infection rates is to compare the ratesof various industries with the overall average. Of the Webrootcustomers who have reported their industry verticals to us, all haveseen a lower percentage of malware per device in 2019 than 2018.However, the targets who experience more malware than othersare shifting. For instance, Manufacturing, Public Administration,Resource Mining/Extraction, and Transport and Warehousingreport higher-than-average encounters with malware per device.Meanwhile, more traditional targets for attack, such as Financeand Insurance, Healthcare and Social Assistance, Nonprofits, andEducation Services, are experiencing lower-than-average malwarerates. (Since these latter industries have been in cybercriminals’crosshairs for the last several years, and many of them have,consequently, made massive investments to improve security, it’sunsurprising that their percentages would improve.)WHERE MALWARE HIDESMalware is everywhere, but the system locations in which it hidesdiffer between consumer and business PCs. Take %appdata% asan example. For consumer PCs, 26.5% of all infections are foundin this folder.In contrast, 16.7% of the threats detected in %appdata% forbusiness PCs are malware. One of the reasons appdata is oftenpopular for consumer systems is because the user does not needthe services of a local admin to install a program with Win8 andabove. The majority of consumer devices have a single user, whois the device admin. This is different in business environments,where the user often has restrictions for where new applicationscan be installed.85% of threats hide in 1 of 4locations: %temp%, %appdata%,%cache% and %windir%.Other examples include %temp% which accounts for 54.4% ofbad files for business PCs, and 28.7% for consumer PCs. Temp istwice as likely to be a hiding spot for business PC infections as forconsumer PCs. (There is good news: it’s easy to set up a Windowspolicy to prevent programs from running from the %temp%directory, regardless of whether they are malicious or benign. Thisis good cyber hygiene and, coupled with user security awarenesstraining, can go a long way to ensure protection.)We continue to see the positive impact of a cleaner operatingsystem, Win10 especially. It’s important to keep in mind that,when consumers buy a new PC, they will generally get Win10 asthe default operating system, especially since Microsoft intends tomove everyone off Win7. However, for businesses, it’s harder to doa massive upgrade; there may be legacy apps that require Win7,and there are costs associated with upgrading.9
RANSOMWARERansomware didn’t show up in force until 2015. Before that, we sawa fair amount of fake antivirus software in which a popup alarminglyinformed the user that their system had been compromised, and theyneeded to click a link to “clean” their system. This action typicallyincurred some sort of cost and further compromised the system.By the mid-2010s, hackers began using cryptocurrency to makeit more difficult for legal authorities to track their activities. Thisadvantage coupled with the high value of the currency made it abooming business. With the evolution of ransomware came offersfor free single-file decryption, multi-language support and customerservice—all from the bad actors who had perpetrated the attack inthe first place.In 2017, ransomware attacks spread panic around the world.Organizations scrambled to safeguard mission-critical data andoften paid the ransoms—but they didn’t always receive the keys todecrypt their lost files. We saw fewer ransomware attacks succeedin 2018, partially because better backups, more awareness, andevolving defenses have made it more difficult to pull off productivecampaigns.Although Webroot has seen a further decline in ransomware attacksover the last year, they certainly haven’t gone away. Instead,ransomware has become more targeted, better implemented, andmuch more ruthless, with criminals specifically targeting higher valueand weaker targets. Additionally, this threat has continued to targetRDP to breach systems, particularly compromised remote desktopprotocol (RDP) tools commonly used by managed service providers(MSPs). Breaching a single MSP can provide give criminals accessto an entire client base of businesses, making providers especiallylucrative targets.Examples of notably successful exploits used by ransomwareduring the past decade include EternalBlue, originally developedby the US National Security Agency and later leaked by a hackergroup. The worldwide WannaCry ransomware attack, which beganas a supply chain attack on Ukrainian targets through tax software,used this vulnerability to attack unpatched systems, and, in spite ofa kill switch, the attacks caused billions of dollars of damage anddowntime. The same exploit was used later to carry out the NotPetyaattack on still more unpatched systems.THE LATEST RANSOMWARE TRENDSMORE RECONAttackers are focusing their efforts on learning about acompany and its infrastructure, including critical serversand backup locations. That way, they know which malwareand exploits to use to increase the likelihood of success.These types of recon attacks are especially effectivewhen targeting small and medium-sized businesses(SMBs) who are less prepared (i.e. no contingency plans,risk assessment structures, cyber insurance, etc.)10RISING RANSOM COSTSThe average ransom amount is increasing. In Q3 2019, itreached 41,198, up from 36,295 in Q1.4 These figuresare reported by Coveware, a company specifically set up tohelp ransomware victims pay their ransom. The existenceof such a company in the first place is a testament to theongoing success of ransomware attacks.
DOUBLE TROUBLEAs it was in 2018, the one-two punch of Trickbot-Emotet prevailed in2019. Emotet is a botnet delivery network that allows you to deployother infections; it often drops Trickbot (a banking Trojan that stealsdata, but also gathers info about the organization). Recently suchattacks have targeted larger companies, attempting to find lucrativevictims who would pay large ransoms. In 2019, Trickbot delivered atwo-pronged attack, stealing information and then dropping Ryuk,another type of ransomware. In addition to stealing personal dataand credentials, Trickbot was able to go back to the same victims andattack them again later via ransomware.Another extremely successful ransomware organization, “Evil Corp”,is the target of a US Justice Department hunt—with a 5M bountyoffered for information leading to the conviction of Maksim Yakubets,the hacker believed to be responsible. The Russian organization hasstolen some 100M from businesses and consumers. The group usesDridex malware to steal banking credentials from employees at smallto mid-sized companies, then recruits “money mules”—unwitting orcomplicit collaborators—to assist in laundering the money obtainedthrough the scheme. The group is also responsible for BitPaymer, aransomware attack that hit several companies in Spain in late 2019.5These attacks rely heavily onphishing emails to get a toehold inthe network. They take advantageof timely topics, such as healthcareenrollment
WEBROOT BRIGHTCLOUD THREAT INTELLIGENCE 95 Million real-world sensors 78 Million end users protected through technology partners 842 Million domains 37 Billion URLs 4 Billion IP addresses 36 Bil