Transcription
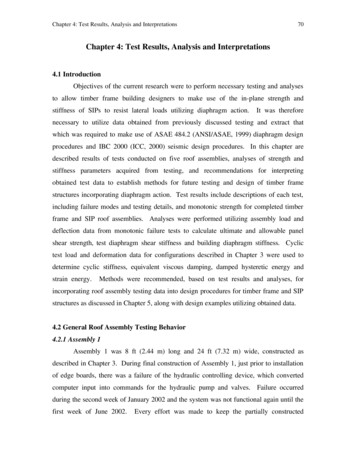
Chapter 4: Test Results, Analysis and Interpretations70Chapter 4: Test Results, Analysis and Interpretations4.1 IntroductionObjectives of the current research were to perform necessary testing and analysesto allow timber frame building designers to make use of the in-plane strength andstiffness of SIPs to resist lateral loads utilizing diaphragm action.It was thereforenecessary to utilize data obtained from previously discussed testing and extract thatwhich was required to make use of ASAE 484.2 (ANSI/ASAE, 1999) diaphragm designprocedures and IBC 2000 (ICC, 2000) seismic design procedures. In this chapter aredescribed results of tests conducted on five roof assemblies, analyses of strength andstiffness parameters acquired from testing, and recommendations for interpretingobtained test data to establish methods for future testing and design of timber framestructures incorporating diaphragm action. Test results include descriptions of each test,including failure modes and testing details, and monotonic strength for completed timberframe and SIP roof assemblies. Analyses were performed utilizing assembly load anddeflection data from monotonic failure tests to calculate ultimate and allowable panelshear strength, test diaphragm shear stiffness and building diaphragm stiffness. Cyclictest load and deformation data for configurations described in Chapter 3 were used todetermine cyclic stiffness, equivalent viscous damping, damped hysteretic energy andstrain energy.Methods were recommended, based on test results and analyses, forincorporating roof assembly testing data into design procedures for timber frame and SIPstructures as discussed in Chapter 5, along with design examples utilizing obtained data.4.2 General Roof Assembly Testing Behavior4.2.1 Assembly 1Assembly 1 was 8 ft (2.44 m) long and 24 ft (7.32 m) wide, constructed asdescribed in Chapter 3. During final construction of Assembly 1, just prior to installationof edge boards, there was a failure of the hydraulic controlling device, which convertedcomputer input into commands for the hydraulic pump and valves. Failure occurredduring the second week of January 2002 and the system was not functional again until thefirst week of June 2002.Every effort was made to keep the partially constructed
Chapter 4: Test Results, Analysis and Interpretations71assembly dry by covering it with polyethylene and keeping rain and snow off thecovering during the winter months. Unfortunately, moisture beneath the covering couldnot be fully avoided and the assembly was partially wetted 8 to 10 times over the 6month duration. Slight puckering of the OSB around several of the SIP screws on top ofAssembly 1 was the only observable damage prior to final testing. Results indicated thatstiffness of the assembly was potentially compromised due to repeated drying andwetting cycles of timbers and SIPs. Weathering appeared to have much less impact onassembly strength, as further discussed in Section 4.3.1.After replacement of the hydraulic controller, the regime of cyclic stiffness tests(Table 3.3) were completed and no damage was observed as a result of these tests.Assembly 1 was pulled toward the hydraulic actuator at a rate of 0.17 in./minute (4.3mm/minute) to failure. It was assumed that the strapped joint at the top of the centerrafter (Figure 3.7) would fail in tension before the splined timber joint at the bottom ofthe center rafter (Figure 3.11) would fail in tension due to chord forces.Thereforepulling the assembly to failure would presumably have resulted in a lower strength andprovided the worst possible scenario for roof panel assembly strength.After someconsideration, it was noted that typically there is a timber member (ridge purlin forexample) at the roof ridge to which SIPs from both sides of the roof are fastened. Acommon member at the ridge results in the chord forces being offset by one another at theridge to SIP connections, assuming the slope lengths of both sides are equal.Specifically, tension chord forces from the windward roof slope are counterbalanced bycompression chord forces from the leeward roof slope, resulting in a negation of chordforces at the ridge. Assuming a common member at the ridge indicated that pushingremaining assemblies to failure would be a more conservative method of assessing roofassembly strength since chord forces would be greater at the eave line in an actualbuilding than at the ridge.A plot showing load versus displacement for Assembly 1 is shown in Figure 4.1.Displacements were acquired using an LVDT inside the hydraulic actuator and by astring potentiometer mounted to the concrete wall, with the string attached to the top ofthe center rafter. String potentiometers were also mounted to the concrete wall andattached to the tops of each outer rafter to determine displacements of the simple beam
Chapter 4: Test Results, Analysis and Interpretations72Displacement (mm)01020304050125010Assembly 140306204Global Displacement10Adjusted Global Displacement2Ram ent (in.)Figure 4.1. Load versus displacement for Assembly 1 test to failure. Ramdisplacements were acquired utilizing internal LVDT on hydraulic actuator, globaldisplacements were acquired utilizing string potentiometer attached to concrete walland center rafter and adjusted global displacements included compensation forrigid body motion by subtracting off the average of the movement at the outer raftersupports.Load (kN)Load (1000 lbs)8
Chapter 4: Test Results, Analysis and Interpretations73supports. Adjusted global displacements were calculated by subtracting the average ofthe support displacements from center rafter displacement recorded using the stringpotentiometer. Bending of the steel channel connected to the hydraulic ram and centerrafter was observed during testing, resulting in slight differences between the tworecorded displacements.Adjusted global displacements were used for all monotonicanalyses, regardless of observed deflections of the steel channel. Global displacementdata was omitted from remaining assembly plots for clarity. Maximum attained load forAssembly 1 was 10,600 lbs (47,200 N) and occurred just prior to a rapid decline in theapplied load at a displacement of 1.41 in. (36 mm).Failure of Assembly 1 was initiated by consecutive failures of screws attachingSIPs to the timber frame. As applied load approached approximately 50% of ultimateload, screws could be heard breaking and continued to do so at random intervals up toassembly failure. Condition and location of screws extracted after testing are illustratedin Figure 4.2, depending on whether screws were bent, broken off, or not damaged.Remaining assembly SIP screw condition and location diagrams are presented inAppendix B. As a result of pulling Assembly 1 to failure, both steel straps at the top ofthe center rafter and the steel strap holding intermediate purlins to the center rafter werebroken. Figure 4.3 illustrates separation of the SIPs and broken straps at the top of thecenter rafter. No significant damage was observed to either SIPs or timber frame forAssembly 1, and upon dismantling, all pegs were easily withdrawn from timber framejoints with no visible wear or compression set. After removal of SIPs from the timberframe, it was noted that some screws attaching the SIPs to the timber frame along theplates had missed the OSB spacer, which resulted in 19/32 in. (15 mm) of the screwthreads being exposed. It was surmised that diaphragm strength and stiffness would becompromised by exposed screws and subsequent installation of SIPs for remainingassemblies utilized a wider OSB strip along the top of the plates to ensure that screwswere fully encased within OSB spacers.4.2.2 Assembly 2Assembly 2 was 8 ft (2.44 m) long and 24 ft (7.32 m) wide, constructed asdescribed in Chapter 3. After considering results from Assembly 1 testing, an explorativeapproach was pursued regarding Assembly 2 tests in order to determine potential effects
Chapter 4: Test Results, Analysis and InterpretationsND B BRBRNDNDNDNDNDNDBRBB BR ND BR BR74BRBRBRNDNDBBBR BR BRBR ND11BB12BR NDBRBRB NDBR B NDNDNDNDNDNDNDNDBR B BRBNDNDNDNDNDBBND ND B BR BR NDBNDNDNDNDNDNDNDND ND BNA B B BR ND ND NDNDNDNDNDNDNDND B BBR B13BRBR BR BRBR14BR BRNDBRBR BBRBBRB12'-0"BRBRBRBR BR B BR BR B4'-0"BRNDNDNDNDNDBBRBBND12'-0"Figure 4.2. Condition and location of screws attaching SIPs to timbers followingfailure of Assembly 1. (BR indicates broken screws, B indicates bent screws, NDindicates no damage to screws and NA indicates screws that could not be assessed orwithdrawn)4'-0"
Chapter 4: Test Results, Analysis and Interpretations75Figure 4.3. Separation of SIPs and broken strap at the top of center rafter followingfailure of Assembly 1.
Chapter 4: Test Results, Analysis and Interpretations76of chord forces on behavior of roof test assemblies. After the regime of cyclic stiffnesstests (Table 3.4) were conducted, none of which caused any damage, Assembly 2 waspulled toward the hydraulic actuator at a rate of 0.17 in./minute (4.3 mm/minute) to aload of approximately 4,000 lbs (17,800 N), which coincided with a displacement ofapproximately 0.25 in. (6.4 mm). Based on Assembly 1 testing, 4,000 lbs (17,800 N) wasestimated to be approximately 40% of ultimate failure load, or design load.It wasassumed that this test would result in a failure of some of the SIP screws or steel strapsalthough no damage was observed nor sounds indicating screw breakage were heardduring the test.A cyclic test was then conducted utilizing a scaled version of thepreviously utilized waveform with a maximum displacement of 0.25 in. (6.4 mm). Anexample of this waveform is presented in Appendix A. No degradation was observedduring the cyclic test, which indicated that assembly stiffness could be considered linearfor displacements up to 0.25 in. (6.4 mm).Remaining cyclic stiffness test regimesincluded a cyclic stiffness test with a maximum displacement of 0.25 in. (6.4 mm) for thebare timber frame and for the completed assembly. Failure was induced in Assembly 2by pushing the assembly away from the hydraulic actuator at a rate of 0.17 in./minute(4.3 mm/minute).Excessive downward bending of the steel channel bolted to thehydraulic actuator and center was observed as the test neared completion. Breaking SIPscrews were heard and significant flattening of the load-deflection plot was noted,leading to termination of the Assembly 2 test, which was considered failed with amaximum load of 11, 600 lbs (51,600 N) at a displacement of 0.789 in. (20 mm).A plot illustrating load versus displacement behavior for Assembly 2 is shown inFigure 4.4. Excessive bending of the steel channel connected to the hydraulic ram andcenter rafter was observed during testing, resulting in significant differences between theglobal and actuator displacements. After all tests were conducted on Assembly 2, asection of 3 x 5 x 3/8 in. (76 x 13 x 9.5 mm) steel tube, 9.5 ft (2.90 m) long, was welded,in the weak direction, onto the bottom of the steel channel to stiffen it for remaining tests.The end of the steel tube began 2.12 ft (0.65 m) from the steel plate that bolted to thehydraulic actuator. A 1/4 in. (6.4 mm) thick steel plate was welded between the flangesof the steel channel between the end of the reinforcing tube and steel plate that bolted tothe hydraulic actuator to further stiffen the section while allowing it to pass between the
Chapter 4: Test Results, Analysis and Interpretations77Displacement (mm)0102030405012501040Assembly 2306204Adjusted Global Displacement102Ram nt (in.)Figure 4.4. Load versus displacement for Assembly 2 test to failure. Ramdisplacements were acquired utilizing internal LVDT on hydraulic actuator.Adjusted global displacements were acquired utilizing string potentiometersattached to concrete wall and rafters and include compensation for rigid bodymotion by subtracting off the average of the movement at the outer rafter supports.2Load (kN)Load (1000 lbs)8
Chapter 4: Test Results, Analysis and Interpretations78restraining rollers without impediment.While Assembly 2 was considered failed due to fastener breakage after themonotonic test, a final cyclic failure test was conducted on Assembly 2 utilizing failuredata from Assembly 1 to obtain a reference deformation of 1.02 in. (26 mm) for use withthe Krawinkler et al. (2000) waveform described and illustrated in Appendix A.Continued bending of the steel channel previously discussed was responsible fortermination of this cyclic test. Condition and location of screws extracted after testingare illustrated in Appendix B. After the final cyclic test, it was observed that both steelstraps at the top of the center rafter and the steel strap holding the intermediate purlins tothe center rafter were broken. The strap that was visible with the SIPs attached was notbroken before the final cyclic test. No significant damage was observed to either the SIPsor timber frame components of Assembly 2, and upon dismantling, all pegs were easilywithdrawn from timber frame joints with no visible wear or compression set.4.2.3 Assembly 3Assembly 3 was 8 ft (2.44 m) long and 24 ft (7.32 m) wide, constructed asdescribed in Chapter 3. After the updated regime of cyclic stiffness tests (Table 3.5)were conducted, which included tests on the bare frame and completed assembly withmaximum displacements of 0.25 in. (6.4 mm), none of which caused any damage,Assembly 3 was pushed away from the hydraulic actuator at a rate of 0.17 in./minute (4.3mm/minute) to failure.A plot showing load versus displacement for Assembly 3 isshown in Figure 4.5. Maximum attained load for Assembly 3 was 12,600 lbs (56,100 N),and occurred at an adjusted global displacement of 0.899 in. (23 mm).Failure of Assembly 3 was initiated by consecutive failures of screws attachingthe SIPs to the timber frame. A
Chapter 4: Test Results, Analysis and Interpretations . there was a failure of the hydraulic controlling device, which converted computer input into commands for the hydraulic pump and valves. Failure occurred during the second week of January 2002 and the system was not functional again until the first week of June 2002. Every effort was made to keep the partially constructed . Chapter 4 .