Transcription
Graduate Enrollmentand Degrees:2010 to 2020
Graduate Enrollment and Degrees:2010 to 2020Enyu ZhouJanet GaoOctober 2021The CGS/GRE Survey of Graduate Enrollment and Degrees is jointly sponsored by:
The CGS/GRE Survey of Graduate Enrollment and Degrees is jointly sponsored by the Council of GraduateSchools (CGS) and the Graduate Record Examinations (GRE) Board. For more information about the surveyor the survey reports, please contact:Council of Graduate SchoolsOne Dupont Circle NW, Suite 230Washington, DC 20036-1146www.cgsnet.orgEnyu Zhou(202) 461-3876ezhou@cgs.nche.eduGraduate Record Examinations ProgramEducational Testing ServiceRosedale RoadPrinceton, NJ 08541-6000www.ets.org/greDawn S. Piacentino(609) 683-2015dpiacentino@ets.orgSuggested citation:Zhou, E., & Gao, J. (2021). Graduate enrollment and degrees: 2010 to 2020. Washington, DC: Council ofGraduate Schools.Copyright 2021 Council of Graduate Schools, Washington, DCALL RIGHTS RESERVED. No part of this work covered by the copyright herein may be reproduced or usedin any form by any means—graphic, electronic, or mechanical including photocopying, recording, taping,Web distribution, or information storage and retrieval systems—without the written permission of theCouncil of Graduate Schools, One Dupont Circle NW, Suite 230, Washington, DC 20036-1146.Printed in the United StatesiiCouncil of Graduate Schools
Quick TakesThe CGS/GRE Survey of Graduate Enrollment and Degrees is a leading source of information on master’sand doctoral program applications, enrollment, and degrees conferred in the United States. This reporthighlights findings from Fall 2020 and includes detailed data tables. Below are key points from this year’ssurvey, which shed light on the applications, enrollment, and degrees conferred in U.S. graduate schoolsat the onset of the COVID-19 pandemic.Applications for admission. Applications for admission to graduate school between Fall 2019 andFall 2020 increased substantially (7.3%) (Table C.1). The rise in applications appears to be driven by Doctoral Universities with Very High ResearchActivities, or R1 institutions (8.1%). There were moderate increases in applications to Doctoral Universities with High Research Activities(R2), Doctoral or Professional Universities (D/PU), and Master’s Colleges and Universities (4.5%, 5.6%and 2.8%, respectively). By degree levels, graduate applications for master’s degree programs increased substantially (9.6%).First-time enrollment. First-time enrollment increased by 1.8% overall between Fall 2019 andFall 2020; however, changes varied greatly by broad fields of study (Table C.7). First-time graduate enrollment increased in business by 16%, in biological and agricultural sciences by9.1%, and by 8.0% in health sciences. First-time enrollment in mathematics and computer sciences and engineering declined substantially(-16.6% and -15.8%, respectively), reflecting the overall decrease in international graduate studentfirst-time enrollment.Total enrollment. Between Fall 2019 and Fall 2020, total graduate enrollment increased by 2.5% (TableC.14). The growth of total graduate enrollment was driven by the increase of domestic students (6.1%). Atthe same time, the total enrollment of international graduate students decreased (-9.7%, Table C.19).Other insights on enrollment include: Degree levels & institution types. There was a 3.8% decrease in first-time doctoral enrollmentbetween Fall 2019 and Fall 2020 (Table C.12). Over the academic year, total graduate enrollmentincreased 3.3% at public institutions and 1.0% at private, not-for-profit institutions (Table C.14). Underrepresented minorities. There were healthy increases in first-time enrollment amongunderrepresented minorities for the past year. First-time graduate enrollment of American Indian/Alaska Native students increased 8.8%, Black/African American students increased 16.0%, and Latinxstudents1 increased 20.4% between Fall 2019 and Fall 2020 (Table C.5).1The term Hispanic/Latino is used as one of the citizenship and racial/ethnicity categories in the survey instrument (Appendix F).The term Latinx is used in the body of the report when referring to Hispanic/Latino population.Graduate Enrollment and Degrees: 2010 to 2020iii
International students.2 Unsurprisingly given the COVID-19 pandemic, we saw a large decrease(-37.4%) in international graduate first-time enrollment between Fall 2019 and Fall 2020. The declinein international first-time enrollment was across all fields of study, engineering (-47.9%), mathematicsand computer sciences (-46.4%) and physical and earth sciences (-42.0%), which have large shares ofinternational graduate students, were particularly hard hit (Tables C.9). Domestic students. By contrast, domestic first-time graduate enrollment grew by 12.9% between Fall2019 and Fall 2020. Increases were largest in business (29.2%), mathematics and computer sciences(20.1%), and biological and agricultural sciences (18.4%) (Table C.9). Part-time students. First-time enrollment of part-time graduates saw a 13.5% increase between Fall2019 and Fall 2020, while full-time graduate enrollment decreased by 3.7%. The growth in first-time,part-time graduate enrollment was largest in business (30.3%), biological and agricultural sciences(30.0%), and engineering (26.7%) (Table C.8). Women. Overall, institutions participating in the GE&D Survey reported a 4.6% increase in thefirst-time graduate enrollment of women between Fall 2019 and Fall 2020 (Table C.6). Women firsttime graduate students increased both at the master’s degree and certificate level (5.2%) and at thedoctoral level (1.2%) (Table C.12 and Table C.13).Graduate-level certificates awarded. Over the past year, the number of graduate-level certificatesawarded increased by 20.7%. The number of graduate-level certificates awarded has grown over the lastfive- and ten-year periods. Between Fall 2015 and Fall 2020, the number of graduate-level certificatesawarded increased 10.0%, and between Fall 2010 and Fall 2020, the number of graduate-level certificatesawarded increased 9.5% (Table C.25).Degrees awarded. The number of master’s degrees awarded by institutions participating in the surveyremained flat (0.2%) between academic years 2018-19 and 2019-20 (Table C.29). The number of doctoraldegrees awarded decreased by 0.7% (Table C.30).2ivThe term Temporary Residents is used as one of the citizenship and racial/ethnicity categories in the survey instrument(Appendix F). The term International Student was used in the body of the report when referring to the Temporary Residentpopulation.Council of Graduate Schools
ContentsList of FiguresviIntroductionviiviiviiiAbout the CGS/GRE Survey of Graduate Enrollment and DegreesAcknowledgments11245Graduate Applications, Enrollment, and Degrees: Fall 2020Graduate ApplicationsFirst-time Graduate EnrollmentTotal Graduate EnrollmentGraduate Certificates and DegreesTrends in Graduate Applications, Enrollment, and Degrees: 2010 to 2020Graduate ApplicationsFirst-time Graduate EnrollmentTotal Graduate EnrollmentGraduate Certificates and Degrees66789AppendicesA. DefinitionsB. Data Tables for Graduate Applications, First-Time Enrollment,A1B1and Total Enrollment, Fall 2020; and Degrees Conferred, 2019-20C. Data Tables for Trends in Graduate Applications, First-Time Enrollment,C1Total Enrollment; and Degrees Conferred, 2010 to 2020D. Taxonomy of Fields of StudyE. List of Institutions Participating in the Fall 2020 SurveyF. Survey InstrumentD1E1F1Graduate Enrollment and Degrees: 2010 to 2020v
List of FiguresFigure 1.Figure 2.Figure 3.Figure 4.Figure 5.Figure 6.Figure 7.Figure 8.Figure 9.viGraduate Application Acceptance Rates by Carnegie Classificationand Degree Level, Fall 2020First-time Graduate Enrollment by Broad Field of Study andAttendance Status, Fall 2020First-time Graduate Enrollment by Broad Field of Studyand Citizenship, Fall 2020U.S. Citizen and Permanent Resident First-time Enrollmentby Race/Ethnicity, Fall 2020Total Graduate Enrollment by Broad Field of Study andDegree Level, Fall 2020Changes in Graduate Applications by Degree Level,Fall 2010 to Fall 2020Trends in First-time Graduate Enrollment by Broad Field of Study,Fall 2010 to Fall 2020Percentage Shares in Total Graduate Enrollment of U.S. Citizens andPermanent residents by Selected Race/Ethnicity, Fall 2010 to Fall 2020Trends in Graduate Degrees Awarded by Degree Level, Fall 2010 to Fall 2020Council of Graduate Schools123346899
IntroductionThe COVID-19 pandemic, and its economic impact,as well as ongoing racist violence continue toimpact graduate education in the United States. OnMarch 13, 2020, the U.S. declared a national healthemergency in response to the COVID-19 pandemic.3Responding to the COVID-19 emergency, manyhigher education institutions in the U.S. changedmodes of instruction to ensure the safety and healthof students, faculty, and staff, by expanding hybridand fully virtual courses and services.In May 2020, CGS fielded the Survey on the Impactof the Coronavirus Disease 2019 (COVID-19)Pandemic on Graduate Education and found thatmany graduate deans (or equivalent) at CGSmember institutions felt pessimistic about theoutlook for Fall 2020 enrollment.4 Also, in therecent NAGAP/CGS Survey of Graduate ement professionals reported that moreprospective students raised concerns about theaffordability of graduate education, the value ofgraduate education, and the increase in the numberof student deferrals since the pandemic began.5Early indicators from other national data collectionefforts found that graduate enrollment had slightlyincreased in Spring 2021.6 The total number ofinternational students declined in the 2019/2020academic year.7The Fall 2020 CGS/GRE Survey of GraduateEnrollment and Degrees Report provides a nationalview of graduate enrollment trends from the pastfive- and ten-years. By providing an annual34567examination of trends in graduate applications,enrollment, and degrees by broad field of study,degree level, and demographics, this report isessential for understanding how the pandemic hasimpacted the U.S. graduate education enterprise.ABOUT THE CGS/GRE SURVEY OFGRADUATE ENROLLMENT AND DEGREESThe CGS/GRE Survey of Graduate Enrollment andDegrees is jointly sponsored by the Council ofGraduate Schools (CGS) and the Graduate RecordExaminations (GRE) Program. Conducted annuallysince 1986, the survey is designed to provideinformation about applications for admission tograduate school, graduate student enrollment, andgraduate degrees and certificates conferred.The CGS/GRE Survey of Graduate Enrollment andDegrees is the only national survey that collectsdata on first-time and total graduate enrollmentacross all fields of master’s and research doctorateprograms in the United States. It is also the onlysource of data on first-time and total graduateenrollment by degree level (master’s/certificatesversus research doctorate) and the only nationalsurvey that collects data on applications to graduateschool by broad field of study.The 2020 CGS/GRE Survey of Graduate Enrollmentand Degrees was launched in November 2020 andsent to the U.S.-based institutions that weremembers of the Council of Graduate Schools or oneof the four regional graduate school associations—White House. (2020). Proclamation on Declaring a National Emergency Concerning the Novel Coronavirus Disease (COVID-19)Outbreak. eak/Okahana, H. (2020). The Impact of COVID-19 on Graduate Education. ionGao, J. (2021). Impact of COVID-19 on Graduate Education Access: Selected Results from the 2020 NAGAP/CGS Survey ofGraduate Enrollment Professionals. -nagapcgs-surveyNational Student Clearinghouse Research Center. (2021). Spring 2021 Current Term Enrollment rm-enrollment-estimates/Open Doors. (2020). The Open Doors 2020 Report on International Educational Exchange. https://opendoorsdata.org/annualrelease/Graduate Enrollment and Degrees: 2010 to 2020vii
the Conference of Southern Graduate Schools(CSGS), the Midwestern Association of GraduateSchools (MAGS), the Northeastern Association ofGraduate Schools (NAGS), and the WesternAssociation of Graduate Schools (WAGS). Thisyear’s survey was sent to a total of 763 colleges anduniversities, and useable responses were receivedfrom 558 institutions, for an overall response rateof 73.1%.ACKNOWLEDGMENTSThis report would not have been possible withoutthe valuable contributions of many organizationsand individuals. We would like to express ourappreciation to ETS and the GRE program forensuring the quality of the survey and the continuityof data. We particularly want to thank AlbertoAcereda for his support of this effort, DawnPiacentino for her overall direction of the project atETS, and Cindy Briggman for coordination of thedata collection effort.We thank CGS President Suzanne Ortega for herinsights and guidance for the project. Also, manythanks to Julia Kent and the CGS CommunicationsTeam, especially Katherine Hazelrigg for assistancein preparation of the final report, its release, andmedia relations and to Matthew Linton forpreparing its digital publication. Last, and mostimportantly, special thanks to the graduate deans,institutional researchers, and other staff at thecolleges and universities who completed the CGS/GRE Survey of Graduate Enrollment and Degreesthis and every year. We are incredibly grateful forthe time and effort they, and others, gave to thesurvey project and report.viiiCouncil of Graduate Schools
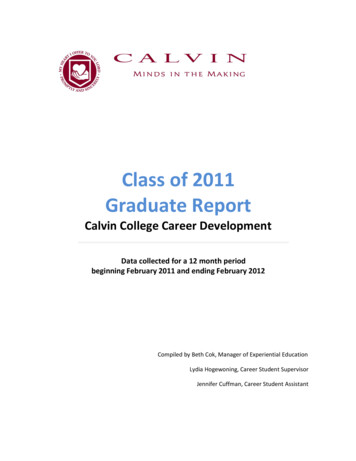
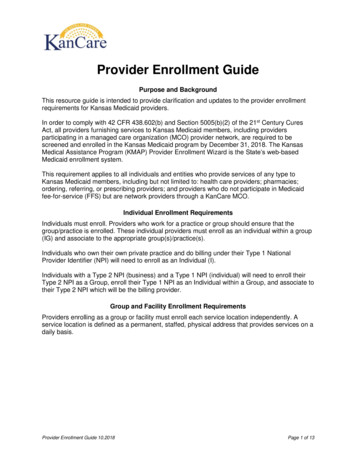
Graduate Applications, Enrollment,and Degrees: Fall 2020More than 1.7 million graduate students wereenrolled in graduate certificate, master’s, ordoctoral programs in Fall 2020 at the 558 U.S.graduate schools participating in the 2020 CGS/GRE Survey of Graduate Enrollment and Degrees.To provide an overview of recent shifts in graduateenrollment during the COVID-19 pandemic, thissection will highlight the state of graduateapplications for admission for Fall 2020, first-timeand total enrollment in Fall 2020, and graduatedegrees and certificates conferred in the 2019-20academic year.GRADUATE APPLICATIONSInterest in pursuing graduate education remains highamid the global pandemic. Institutions respondingto the 2020 CGS/GRE Survey of Graduate Enrollmentand Degrees received approximately 2.1 millionapplications for admission to graduate programsbeginning in Fall 2020. The figure includes the morethan 1.3 million applications for Fall 2020 receivedby public institutions and the 833,571 graduateapplications for admission to private, not-for-profitinstitutions. About 68.0% or 1,472,964 of theapplications received by institutions responding tothe survey were for master’s/other programs. Evenamong Doctoral Universities with Very High ResearchActivities (R1), 63.0% of applications received werefor master’s/other programs (Table B.1).In Fall 2020, acceptance rates were higher for bothdoctoral programs and master’s/other programscompared to Fall 2019. Acceptance rates fordoctoral programs have traditionally been lowerthan acceptance rates for master’s/other programs,and results from the 2020 survey were consistentwith this pattern. Overall, 22.3% of doctoralapplicants and 55.7% of master’s/other applicantswere accepted for admission. Private, not-for-profitinstitutions generally have lower acceptance ratesthan public institutions. Doctoral programs atprivate, not-for-profit R1 institutions were themost selective, accepting 12.5% of applicationsreceived. Master’s/other programs at theseuniversities were also more selective with anoverall acceptance rate of 45.7% (Table B.1 andFigure 1).Figure 1. Graduate Application Acceptance Rates by CarnegieClassification and Degree Level, Fall 202022.3%Total55.7%19.7%Doctoral: Very High Research50.6%36.6%Doctoral: High Research67.3%50.8%Doctoral/Professional Universities43.4%Master's Colleges and r's/OtherSource: 2020 CGS/GRE Survey of Graduate Enrollment and Degrees, Table B.1By broad field of study, the largest number of totaldoctoral applications for Fall 2020 were in thesocial and behavioral sciences (105,198),engineering (86,117), and biological and agriculturalsciences (84,998). These three broad fields aloneaccounted for 40.7% of all doctoral applications forwhich the intended field of study was known in Fall2020. The broad field of social and behavioralsciences had the lowest aggregated doctoralapplication acceptance rate (13.5%) of all broadfields. For master’s/other applications, the broadfield of business received the largest number ofapplications (252,103), followed by mathematicsand computer sciences (205,272). In terms ofmaster’s acceptance rates, arts and humanities(42.1%) reported the lowest aggregated applicationacceptance rate, followed by mathematics andcomputer sciences (43.4%), physical and earthsciences (49.6%), biological and agriculturalsciences (52.4%), and engineering (52.9%) (Table B.2).Graduate Enrollment and Degrees: 2010 to 20201
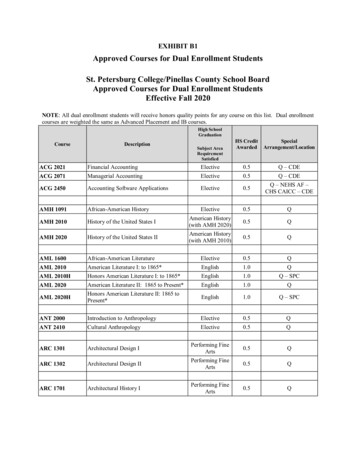
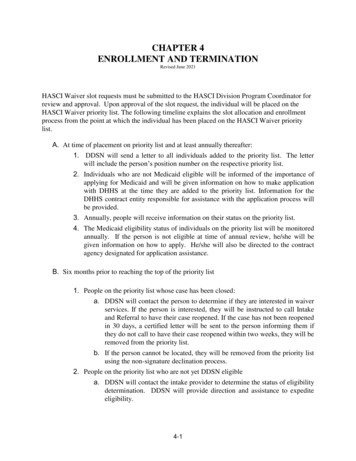
FIRST-TIME GRADUATE ENROLLMENTA total of 509,999 graduate students enrolled forthe first time in graduate certificate, educationspecialist, master’s, or research doctoral programsin Fall 2020 at the institutions responding to theCGS/GRE Survey of Graduate Enrollment andDegrees. Tables B.3 to B.11 provide additionaldetails regarding first-time graduate enrollment forFall 2020.Consistent with previous survey cycles, business(87,045), education (75,083), and health sciences(67,126) were the three largest broad fields for firsttime graduate enrollment in Fall 2020. These threebroad fields collectively represented 45% of firsttime graduate enrollments (Table B.4).At those institutions responding the survey, 60.8%of first-time graduate students were women,though the proportion of women varies byinstitutional type (Table B.3). Institutionsresponding to the survey also reported that whilewomen constitute more than three quarters offirst-time graduate enrollment in fields of publicadministration and services (79.5%), health sciences(79.3%), and education (76.8%) in Fall 2020, theycomprised much smaller portions of first-timeenrollment in the fields of engineering (29.3%),mathematics and computer sciences (33.6%), andphysical and earth sciences (44.3%) (Table B.4).Figure 2. First-time Graduate Enrollment by Broad Field of Study andAttendance Status, Fall 2020As institutions changed mode of instruction andoffered virtual or hybrid learning options, manydelivered courses in modular or part-time formats.More opportunities for students who were placebound and not able to pursue graduate education inperson may have become available. In Fall 2020,37.5% of first-time graduate students were parttime students, compared to 33.7% of part-timestudents in Fall 2019. Among the three largestbroad fields for first-time graduate enrollment,40.1% of business, 55.4% of education, and 35.2% ofhealth sciences first-time enrollment were parttime students (Table B.4 and Figure 2).The large majority (84.0%) of first-time graduatestudents in Fall 2020 were enrolled in programsleading to a master’s degree or a graduate certificate.In the broad fields of public administration andservices (97.7%), business (97.6%), “other fields”(90.9%),8 education (88.8%), and mathematics andcomputer sciences (85.8%), the shares of master’s/other enrollees were very high. By contrast, themajority (58.0%) of first-time graduate enrollmentin physical and earth sciences were in doctoralprograms (Table B.6).Over one third (34.4%) of all first-time master’s/other students were enrolled in business (80,510)and education (60,881). At the doctoral level, thebroad fields of health sciences (12,860), social andbehavioral sciences (8,775), education (7,698), andengineering (7,766) were the largest, accounting forabout one-half (47.6%) of all first-time doctoralstudents (Table B.6).BusinessEducationHealth SciencesSocial & Behav SciEngineeringOther FieldsMath & Comp SciPublic Admin & SvcsBiological & Ag SciArts & HumanitiesPhysical & Earth ce: 2020 CGS/GRE Survey of Graduate Enrollment and Degrees, Table B.482100,000In Fall 2020, women comprised a larger share offirst-time enrollees at the master’s and graduatecertificate level (61.4%) than at the doctoral level(57.0%). Although women comprise the majority offirst-time graduate students overall, they wereunderrepresented at the master’s level inengineering (28.7%), mathematics and computersciences (33.8%), and business (46.9%). Moreover,men comprised a majority of doctoral first-timeenrollees in engineering (68.7%), mathematics andcomputer sciences (69.5%), and physical and earthsciences (60.5%) (Table B.7).The “other fields” category included the fields of Architecture and Environmental Design, Communications and Journalism,Family and Consumer Sciences, Library and Archival Sciences, and Religion and Theology (For more details, see Appendix D).Council of Graduate Schools
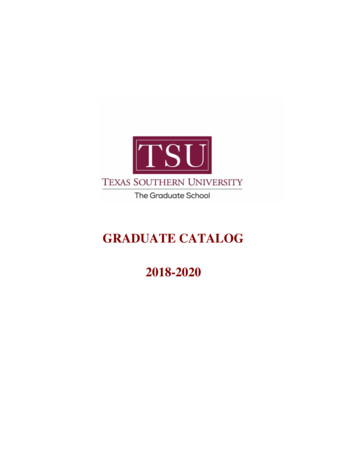
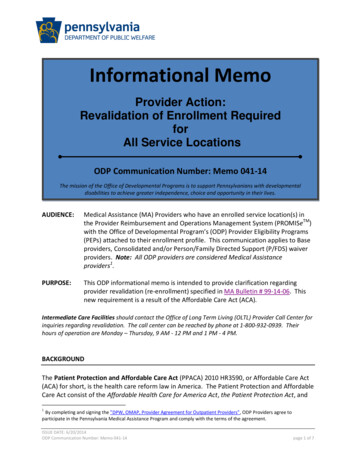
Unsurprisingly, given the pandemic’s impact oninternational travel, U.S. citizens and permanentresidents constituted a larger majority of first-timegraduate enrollees than in recent years. Specifically,among first-time graduate enrollees in Fall 2020 forwhom citizenship was known, 87.4% were U.S.citizens or permanent residents. The share of firsttime domestic enrollment has gradually increasedover the past five years: Fall 2019 (80.0%), Fall 2018(80.2%), Fall 2017 (79.7%), Fall 2016 (78.9%), andFall 2015 (78.0%)9 (Table B. 8). Domestic studentscomprised the largest share of first-time graduatestudents in public administration and services(97.4%), followed closely by education (96.7%) andhealth sciences (96.2%) (Table B.9).In contrast, the share of first-time y,compared to Fall 2019 (20.0%).10 The share ofinternational students among first-time graduatestudents was higher at private, not-for-profituniversities (17.9%) than at public universities(10.6%). The share of international students amongfirst-time graduate students was the largest at R1institutions (18.2%, Table B.8). Internationalstudents comprised the largest share of first-timegraduate students in mathematics and computersciences (35.8%), followed closely by engineering(33.1%, Table B.9 and Figure 3). Women continuedto be underrepresented among internationalstudents compared to domestic students. While62.7% of first-time graduate enrollees who wereU.S. citizens and permanent residents were women,only 47.3% of first-time graduate enrollees whowere international students were women (TableB.10).The share of underrepresented minorities (URM)among U.S. citizens and permanent residentsincreased more than one percentage point from theprevious year.11 In Fall 2020, approximately 25.9%of all first-time U.S. citizens and permanentresident enrollees were URM students, includingAmerican Indian/Alaska Native (0.5%), Black/Figure 3. First-time Graduate Enrollment by Broad Field of Study andCitizenship, Fall 2020BusinessEducationHealth SciencesSocial & Behav SciEngineeringOther FieldsMath & Comp SciPublic Admin & SvcsBiological & Ag SciArts & HumanitiesPhysical & Earth Sci20,000040,000U.S. Citizens & Permanent Residents60,00080,000100,000International StudentsSource: 2020 CGS/GRE Survey of Graduate Enrollment and Degrees, Table B.9Figure 4. U.S. Citizen and Permanent Resident First-time GraduateEnrollment by Race/Ethnicity, Fall 2020Two or ic Islander0.2%Source: 2020 CGS/GRE urvey of Graduate Enrollment & Degrees, Table B.11African American (12.3%), Native Hawaiian/OtherPacific Islander (0.2%), and Latinx (13.0%, TableB.11 and Figure 4).There are proportionally more domestic students ofcolor in some fields, such as social and behavioralsciences and education. In other fields, however,9Data for the share of first-time domestic enrollment in Fall 2015, Fall 2016, Fall 2017, Fall 2018 and Fall 2019 can be found inprevious editions of the Graduate Enrollment and Degrees report, which are available on the Council of Graduate Schools’website.10 Data for the share of first-time international enrollment in Fall 2019 can be found in previous editions of the GraduateEnrollment and Degrees report, which are available on the Council of Graduate Schools’ website.11 Data for the share of first-time underrepresented minorities (URM) among U.S. citizens and permanent residents can be foundin the previous year’s Graduate Enrollment and Degrees report, Fall 2019, which is available on the Council of GraduateSchools’ website.Graduate Enrollment and Degrees: 2010 to 20203
the representation of traditionally underservedstudents of color remained relatively low. AmericanIndian/Alaska Native, Black/African American,Latinx, and Native Hawaiian/Other Pacific Islanderfirst-time graduate students remain technology, and mathematics (STEM) fields.URM enrollment across broad fields of study wasnot monolithic, however, and showed significantvariation across fields. For example, only 4.4% ofU.S. citizens and permanent resident studentsenrolled for the first time in physical and earthsciences and 6.2% in engineering were Black/African American students. While only 3.4% offirst-time students in education were Asian, theyconstituted a relatively large share of U.S. citizensand permanent residents enrolled for the first timein mathematics and computer sciences (21.0%) andengineering (14.8%) fields (Table B.11).TOTAL GRADUATE ENROLLMENTInstitutions responding to the CGS/GRE survey(N 558) enrolled more than 1.7 million graduatestudents in Fall 2020. Complete details of totalenrollment findings by institution type, gender,attendance status, broad field, er *degree level,citizenship, and race/ethnicity appear in TablesB.12 to B.20.Across all institutions that participated in thissurvey, 43.4% of graduate students were enrolledpart-time. The share of part-time students amongFigure 5. Total Graduate Enrollment by Broad Field of Study andDegree Level, Fall 2020Educationall graduate students was the greatest at publicDoctoral or Professional Universities (D/PU) with66.2% of graduate students enrolled part-time.Similarly, 60.3% of graduate students at publicmaster’s colleges and universities were enrolledpart-time in Fall 2020 (Table B.12).There were similarities and differences acrossbroad fields of study between graduate studentsenrolled part-time and full-time in their programs.The three largest broad fields of study - education,business, and health sciences - were also the fieldswith the largest proportions of part-time graduatestudents. More than six out of ten (63.8%) graduatestudents in education, about one-half in business(53.0%), and 43.0% in health sciences were enrolledpart-time. By contrast, physical and earth sciences(16.8%), biological and agricultural sciences (25.9%),engineering (32.5%), and social and behavioralsciences (34.3%) had smaller proportions ofgraduate students enrolled part-time in theirprograms (Table B.13). Among graduate students inFall 2020, men were more likely to be enrolled fulltime than women (59.2% and 54.9% respectively)(Table B.14).Nearly three quarters (72.9%) of the total graduateenrollment at institutions participating in thisyear’s survey was in master’s programs, while27.1% was in doctoral programs. Graduateenrollment in business (95.0%) and publicadministration and services (93.0%) was heavilyconcentrated in master’s/other programs. AcrossSTEM fields, too, graduate enrollment waspredominantly at the master’s level. However, themajority of graduate enrollment in physical andearth sciences (75.9%) and biological and agri cultural sciences (53.4%) was at the doctoral level(Table B.15 and Figure 5).BusinessHealth SciencesEngineeringSocial & Behav SciMath & Comp SciOther FieldsBiological & Ag SciArts & HumanitiesPublic Admin & SvcsPhysical & Earth er's/Other *Source: 2020 CGS/GRE Survey of Graduate Enrollment and Degrees, Table B.154Council of Graduate Schools300,000International graduate students constituted 16.2%of total enrollment in Fall 2020, compared withU.S. citizens and permanent residents, whoconstituted 83.8%. At R1 institutions, the share ofinternational students was 24.1% (Table B.17).The percentage of international students wasparticularly high in engineering (44.8%), mathe matics and computer sciences (43.8%), and physicaland earth sciences (32.5%) (Table B.18).
Among U.S. citizens and permanent residents,Black/African American students were particularlyunderrepresented in several fields. While theyconstituted 12.8% of U.S. citizens and permanentresident graduate students overall, they accountedfor only 3.8% of physical and earth sciencesenrollees. Similarly, they were grossly under represented in engineering (6.2%), biological andagricultural sciences (6.6%), and arts and humanities(6.5%) (Table B.20).women were in education, health sciences, publicadministration and services, and social andbehavioral sciences. However, in many STEMfields, men still earned the majority of graduatedegrees and certificates. Men earned about threefourths of master’s degrees (72.2%) and doctoraldegrees (75.1%) in engineering. Similarly, 64.5% ofmaster’s degrees and 74.2% of doctoral degrees inmathematics and computer sciences were earnedby men (Tables B.23, B.24, and B.25).GRADUATE CERTIFICATE
The CGS/GRE Survey of Graduate Enrollment and Degrees is a leading source of information on master's and doctoral program applications, enrollment, and degrees conferred in the United States. . First-time enrollment in mathematics and computer sciences and engineering declined substantially (-16.6% and -15.8%, respectively), reflecting .