Transcription
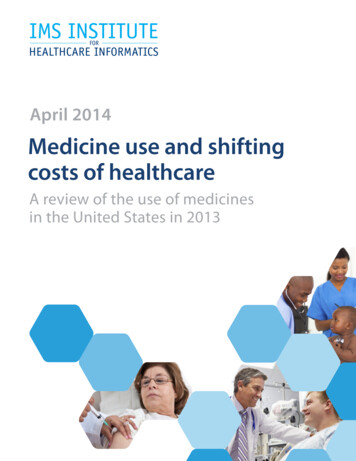
April 2014Medicine use and shiftingcosts of healthcareA review of the use of medicinesin the United States in 2013
IntroductionIn 2013, per capita use and cost of medicines increased 0.9% and 1.0% respectively.Nominal spending increased sharply to 3.2% from -1.0% in 2012, prompting questionsif medicines were no longer “bending the cost curve” and if a bubble was forming as a result ofthe Affordable Care Act.After many years of slowing growth, largely due to patent expiries, a return to growth formedicines is looked at with caution by payers and policy makers alike. Despite this view, littlehas changed in the dynamics of medicines spending, and in fact, the key elements of long-termsavings and restraint in healthcare spending are clear.In this year’s report, we have brought together our review of 2013 from the perspective of theutilization of key healthcare services including physician office visits, hospitalizations and use ofthe Emergency Room. We have also examined patient costs for medicines and the continued shiftin the types of commercial insurance provided by employers. New medicines and breakthroughsin disease areas continued apace, bringing new treatment options to patients with diseasesranging from diabetes to cancer to hepatitis C. Total system spending on medicines, includingdrug spending outside retail pharmacies, is a key metric many look to as an indicator of healthcarespending levels, and this report provides the first view of this for 2013.The study was produced independently by the IMS Institute for Healthcare Informatics as a publicservice, without industry or government funding. The contributions to this report of LaurenCaskey, Jennifer Lyle, Sue Antolik, Mary Ann Cornwall, Kobby Essien, Shiraz Hassan, ThurayyahJacobs, Jim Letcavage, Bill McClellan, Priya Patel, Carrie Wright, and dozens of others at IMS Healthare gratefully acknowledged.Murray AitkenExecutive DirectorIMS Institute for Healthcare InformaticsFind out moreIMS Institute for Healthcare Informatics, 11 Waterview Boulevard, Parsippany, NJ 07054, If you want to receive more reportsfrom the IMS Institute or be on ourmailing list please click here 2014 IMS Health Incorporated and its affiliates. All reproduction rights, quotations, broadcasting, publications reserved. No part of this publication may be reproduced ortransmitted in any form or by any means, electronic or mechanical, including photocopy, recording, or any information storage and retrieval system, without express writtenconsent of IMS Health and the IMS Institute for Healthcare Informatics.Medicine Use and Shifting Costs of Healthcare. Report by the IMS Institute for Healthcare Informatics.
ContentsEXECUTIVE SUMMARY 1CHANGES IN THE UTILIZATION OF HEALTHCARE AND MEDICINEs 3 P atients are visiting physicians again after a 4-year drought, while ER use slows dramaticallysuggesting more rational resource use is evolving. P rescriptions per capita rose slightly.4PATIENT PAYMENT FOR HEALTHCARE AND MEDICINES 10 Patients are paying higher deductibles, co-pays or co-insurance. 78.6% of all prescriptions cost patients 10 or less. There are wide variations in the out-of-pocket costs by types of insurance. Some patients can use coupons to dramatically reduce their costs.610TRANSFORMATIONS IN DISEASE TREATMENT 19 36 New Chemical Entities launched in 2013 up from 28 in 2012. Seven entirely new treatment mechanisms launched, 17 orphan drugs, and 10 cancer. Breakthrough products to treat hepatitis C, multiple sclerosis, cystic fibrosis and a number of cancerslaunched in 2012/13 and have already reached millions of Americans.16SPENDING ON MEDICINES 30 Total drug spending was 329.2Bn, up 3.2% nominal or 1.0% real per capita basis. S pending increased due to fewer expiries and higher brand price growth. Therapy areas can be segmented into groups based on the state of the innovation cycle.21Notes on Sources 42Appendices 4430THE AUTHORS 52ABOUT THE IMS INSTITUTE 54373946Medicine Use and Shifting Costs of Healthcare. Report by the IMS Institute for Healthcare Informatics.
1Executive SummaryUtilization of all types of healthcare services including medicines rose, and while out-of-pocketcosts continue to increase for patients as insurance plan designs change, the vast majorityof prescription medicines carry a co-pay of 10 or less. Clusters of innovative medicineswere launched bringing new treatment options to patients, especially for cancer. Total drugspending growth rebounded in 2013 from its largest ever decline in 2012. Fewer patent expiries,increased utilization of specialty medicines, and the launch of new medicines contributed tothe increase, which remains at historically low levels and less than overall healthcare spending. Changes in the utilization of healthcare and medicinesUtilization of healthcare and medicines increased in 2013 whether measured byphysician office visits, hospitalizations, or prescriptions filled. For the fourth year in a row,hospitalizations beginning in the ER increased in number - driven by day visits to the ER but inpatient admissions via the ER declined dramatically. Patient office visits, which havealways been relatively evenly split between primary care and specialists, tipped to majorityspecialist in 2013 for the first time, with greater increases for older patients. Per capita usageof prescriptions increased overall but declined slightly for patients over 65. Patient payment for healthcare and medicinesOut-of-pocket costs continue to rise for patients, despite generic medicines nowrepresenting 86% of prescriptions, and average out-of-pocket costs falling below 10overall. Zero co-pays for contraceptives and coupon programs from manufacturers are twoof the ways that patient costs are being offset. Patients abandon 3% of prescriptions at thepharmacy, and payers reject another 6% for various reasons linked to formularies and priorauthorization required for expensive medicines. The ACA provision ensuring a zeroout-of-pocket cost for preventive tests and treatments and for contraceptives hasdramatically reduced out-of-pocket costs for women in particular, saving themapproximately 483 million in out-of-pocket costs in 2013 for contraceptives alone.Medicine Use and Shifting Costs of Healthcare. Report by the IMS Institute for Healthcare Informatics.
EXECUTIVE SUMMARY2 Transformations in disease treatmentThere were 36 New Molecular Entities launched in 2013, including ten new cancer treatments,and 17 orphan drugs, the most in both segments in over a decade. A dramatic rise hasoccurred in the number of cancer drug launches, with 56 NMEs launched in the last decade,two-thirds of those in the last five years and 27 of them in the last three years.In addition, further indications for existing cancer drugs have been launched, bringingproven mechanisms to new tumor populations. Orphan drugs are reaching an increasingnumber of very small patient populations, and the 17 launched in 2013 is the most in any yearsince the passage of the Orphan Drug Act in 1983. The next decade promises a much fasterapproval process for drugs gaining FDA’s new Breakthrough Therapy Designation. Clusters ofinnovation are transforming patient care in hepatitis C, multiple sclerosis, as well as diabetes,stroke and acute coronary syndrome. Spending on medicinesDrug spending has been contributing to slower healthcare cost growth since 2007, withreal per capita spending growth on medicines below 4% in every year, and only 1% in2013. Nominal spending rose sharply in 2013 from its decline in 2012. The largest singledriver of the increase in spending growth from -1.0% in 2012 to 3.2% in 2013 was the lowerimpact of patent expiries – 10 billion less than in 2012 – accounting for 3.5% of the 4.2%shift in growth. Spending on medicines overall can be explained by the level of innovativemedicines and patent expiries in major therapy areas. The largest clusters of innovation are inspecialty therapy areas including oncology, hepatitis C, HIV, and autoimmune diseases, whichcollectively grew by 11% to 73 billion in 2013. Primary care therapy areas with significantinnovation led by diabetes grew by 11% to 37 billion. The largest amount of spending- 128 billion in 2013 – was in therapy areas with limited innovation or patent expiries butstill grew at 7%. A significant driver of growth in the market was price increases on protectedbrands, which contributed 20 billion to growth in 2013, up from 15.6 billion in 2012. Allof the higher price growth seen in 2013 was offset by higher levels of off-invoice discountsand rebates, and net price growth was estimated to be nearly unchanged from 2012 at 16.6billion. The largest driver offsetting positive spending growth was the group of primary caretherapy classes affected by significant patent expiries, declining by 10% in 2013 to 80 billionin spending.Medicine Use and Shifting Costs of Healthcare. Report by the IMS Institute for Healthcare Informatics.
3Changes in the utilization of healthcare and medicines verall utilization of healthcare services and medicines grew slightly in 2013 as patients returnedOto the healthcare system, mostly visiting physician’s offices and/or receiving outpatient treatment,but in higher numbers after several years of “self-rationing”. Patient office visits grew by 2.7% in 2013, a reversal of four years of declines. Scheduled inpatient admissions account for only 2.4% of hospitalizations, but grew by 10.5%,which may be the result of some patients having rationed care in years past, and exacerbatedtheir conditions. Inpatient hospital admissions via the emergency room represent only 2.5% of all admissions,and declined by 14.6%, perhaps as a response to policies that discourage ER usage. Emergency day visits actually increased slightly for all payers, showing that there is potentiallymore to be done to discourage inappropriate ER usage generally. There were 1.6% more prescriptions filled in 2013, an increase in growth of 0.4% over the levelin 2012, but reflecting per capita growth of only 0.9%. Most therapy areas had small nominal increases, with the largest increases coinciding withsome of the most used medicines. While cholesterol medicines were notable for their decline, this was more a response toan abnormally high level of prescriptions in the months following the expiry of Lipitor inNovember 2011, and not linked to recently revised cholesterol management guidelines. Pain medicines, particularly narcotics, showed declines largely attributed to the response tothe FDA’s mandatory phased withdrawal of high-dose acetaminophen-containing opioidcombinations, as well as to the removal of crushable forms of oxycodone and theirreplacement with abuse deterrent forms.Medicine Use and Shifting Costs of Healthcare. Report by the IMS Institute for Healthcare Informatics.
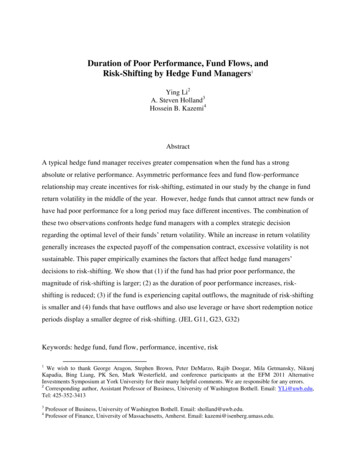
4CHANGES IN THE UTILIZATION OF HEALTHCARE AND MEDICINESPatients made more visits to physician offices andhospitals in 2013 with a dramatic drop in inpatientadmissions via emergency departmentsPercent change in hospital admissions and office visits10.5%2.7%7.9%6.2%3.5% ice VisitsInpatientvia : IMS Health, National Disease and Therapeutic Index, IMS Hospital CDM, Dec 2013 Visits to physician offices recovered in 2013, but Hospitals saw an increase of 13 million outpatient The recovery in office visits was seen among the Emergency room utilization was flat as in-patient All types of hospital admissions, including The average number of visits per patientare still 8% lower than in 2008.Medicare and commercially insured populations,while Medicaid visits declined slightly.inpatient, outpatient and emergency, rose 2.6%in 2013. Scheduled inpatient admissions rose 10.5% invisits in 2013.admissions via the ER declined while ER day visitsincreased for all insurance types.decreased slightly in the Medicare and Medicaidpopulations.2013, but account for 2.4% of total admissions.Chart notes:Patient visits projected from a survey of office-based physicians.ER (emergency room) includes patients who visit the ER and are released without being admitted.IMS CDM includes hospital-based admissions based on a sample of private hospitals. Outpatient admissions represent outpatient services provided by awholly-owned hospital facility, and do not include standalone infusion centers or cancer centers.Medicine Use and Shifting Costs of Healthcare. Report by the IMS Institute for Healthcare Informatics.
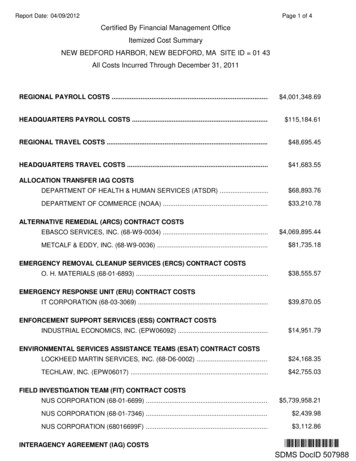
5CHANGES IN THE UTILIZATION OF HEALTHCARE AND MEDICINESPhysician office visits increased by 2.7% as patients visitedspecialists more often and primary care office visitsdeclined slightlyPercent change in office visits by physician type and patient age in 20132.7%Total-0.7%4.9%6.7%Seniors (65 )9.5%2.6%2.2%5.9%Adults (26-64)-2.1%1.0%3.4%Young Adults (19-25)-2.7%Children (0-18)-1.1%0.0%0.2%TotalSpecialistPrimary CareSource: IMS Health, National Disease and Therapeutic Index, Dec 2013 Visits to physician’s offices increased in 2013 afterfour years of decline, driven by patients visitingspecialists, and by the large seniors and adultpatient populations. Seniors’ doctor visits increased 6.7% in 2013compared to a 1.5% increase in 2012, mostly fromseeing specialists more often. Adults demonstrated a similar pattern, wherespecialist visits increased by 5.9% compared to a0.5% decline in 2012. Adults primary care visits continued to decline forthe fourth consecutive year, and the rate of declineaccelerated from -1.1% in 2012 to -2.1% in 2013. Young adults aged 19-25 – those who could stayon their parent’s health insurance from late 2010– had a modest increase in physician visits of 1.0%,compared to a 3.7% increase in 2012. Children, including those covered by their parent’sinsurance and those covered under SCHIP, visitedprimary care doctors 1.1% less in 2013, a dramaticchange compared to the 6.4% decline in 2012. Much of the recovery in children’s visits was drivenby visits to pediatricians paid by Medicaid. Among the commercially insured, visits to generaland orthopedic surgeons, psychiatrists, andpediatricians had all declined in 2012 and all sawsignificant increases in 2013.Chart notes:Primary Care includes family practice, internal medicine, pediatrics, osteopathic medicine and general practice.Medicine Use and Shifting Costs of Healthcare. Report by the IMS Institute for Healthcare Informatics.
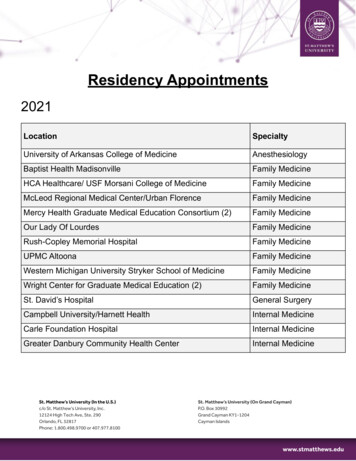
6CHANGES IN THE UTILIZATION OF HEALTHCARE AND MEDICINESPatients made more visits to hospitals in 2013,mostly from commercially insured patients’outpatient treatmentsTrends in hospital admissions by pay type (millions)InpatientEROutpatient201322 15852842201220 17842741201120 1778201020 177325 35200920 177123 34ScheduledInpatientInpatientvia d6267605956OutpatientMedicareSource: IMS Health Hospital CDM, Dec 2013 Hospital admissions of all types rose by15.1 million admissions in 2013 to a total of603.4 million admissions. Inpatient admissions were flat, with a 10.5% Outpatient treatment drove the growth inhospital visits, increasing by 13 million in 2013. Emergency room day visits slowed with smallerincreases by all types of insured patients.increase in scheduled admissions offset by a14.6% reduction in admissions via emergency. Outpatient care represents 68% of hospitaladmissions, down two percentage points since2009, but increasing in the latest year as rates ofgrowth in emergency and inpatient admissionshave slowed.Chart notes:Chart notes: Scheduled inpatients are those patients who are admitted as inpatients not via the ER. Inpatient via ER are patients who are admitted as inpatientsafter first visiting the emergency department during the episode of care. Emergency admissions where the episode of care does not result in an inpatient admissioncan also be called day-patients. Outpatient treatments in hospitals can include patients treated by physicians in clinics or practices owned or operated by hospitals,or day-surgeries. All such determinations are based on the type of reimbursement submitted by the hospital to the relevant insurers.Medicine Use and Shifting Costs of Healthcare. Report by the IMS Institute for Healthcare Informatics.
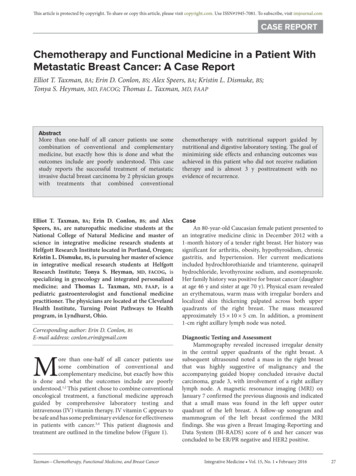
7CHANGES IN THE UTILIZATION OF HEALTHCARE AND MEDICINESPrescriptions increased by 1.6% in 2013, 0.9% on a percapita basis, the second consecutive year reversing flator declining prescription demandNominal and per capita dispensed prescription growth 10-0.1%20110.5%20121.6%0.9%2013TRx Per CapitaSource: IMS Health, NPA, Jan 2014; U.S. Census Bureau During the worst years of the economic crisis, Prescription demand increased the most in the Since the official end of the recession in June Of the past five years, only 2009, driven by the There is an important relationship between The per capita prescription trend, which showsfrom 2009 to 2011, prescription demand waslargely insulated from slowing demand.2009, prescription demand has recoveredrelatively weakly.patients’ exposure to healthcare costs and theiruse of healthcare services and medicines, andwhile the broader economy recovered, there wereforces acting on patients that were making somehealthcare progressively less affordable.last decade with the implementation of Medicarepart D in 2006.H1N1 flu season, had per capita prescriptiongrowth above 1%.increasing demand for medicines year by year,provides a useful baseline for understanding thedramatic changes in the insured population andthe expected impact on patients’ healthcare andprescription utilization in the future.Chart notes:Dispensed prescriptions in retail, mail order and long-term care pharmacies. IMS routinely updates its market audits, which may result in changes to previouslyreported market size and growth rates. This chart adjusts for a trend break in currently reported IMS data and reflects historic growth rate trends.Medicine Use and Shifting Costs of Healthcare. Report by the IMS Institute for Healthcare Informatics.
8CHANGES IN THE UTILIZATION OF HEALTHCARE AND MEDICINESPrescription increases were driven by changes in some ofthe therapy areas with greatest prescription utilizationSelected therapy areas with largest positive and negative contributions to TRx growth2013TRx ialsLipidRegulators954.6%Nervous SystemHormonalDisordersContraceptivesSource: IMS Health, National Prescription Audit, Jan 2014 Therapy areas associated with declining costs,such as hypertension and mental health, sawincreasing volume, perhaps related to reductionsin patient out-of-pocket costs. Prescriptions for pain medicines, includingnarcotic opioids, declined by 1%, and while mostpain medicines had increased usage, the FDAordered phasing-out of acetaminophen productswith strengths greater than 325mg (started in2011 and due to complete January 2014) drovereduced usage of combination products that alsoincluded opioids. The introduction of abusedeterrent forms also reduced opioid usage, on amorphine-equivalent unit basis. Nervous system disorders grew by 5.9% largelydriven by the broad utilization across indications(approved and unapproved) for generic oralgabapentin, originally an epilepsy treatment butnow used for a broad range of pain and nervoussystem disorders. Hypertension prescription growth continuedbelow the overall market level despitethe availability of low-cost generics ofone of the leading medicines, valsartan hydrochlorothiazide (generic Diovan-HCTZ). Lipid regulator prescriptions declined by 1%following a temporary peak in demand followingthe Lipitor patent expiry in late 2011. Prescriptions for contraceptives increased 4.6% asthe share of patients with zero co-pay rose from20% to 50%.Chart notes:Therapy areas are based on proprietary IMS Health definitions. Pain includes NSAIDS (Non-steroidal anti-inflammatories), non-narcotic analgesics, and narcoticanalgesics.Mental health includes antipsychotics and antidepressants. Nervous system disorder treatments include therapies for epilepsy and Parkinson’s disease.Medicine Use and Shifting Costs of Healthcare. Report by the IMS Institute for Healthcare Informatics.
9CHANGES IN THE UTILIZATION OF HEALTHCARE AND MEDICINESUse of medicines by patient groups under 65 yearsincreased, though seniors remain the highest perperson consumers of prescription drugsPercent population, prescriptions and per capita change in retail prescriptions by ageAge80 250-1830.7%2.3%25.4%1.6%1.0%4.2%1.4%Share of Population10.0%8.5%Share of Rx27.322.4%31.9%19.2NationalAverage:12.29.7 1.7%5.224.9%Change in Rx Per Capita4.2Prescriptions Per CapitaSource: IMS Health, Xponent National, Jan 2014; U.S. Census Bureau Americans’ use of medicines per person Prescription utilization per capita declined Those 80 and over used 2% fewer prescriptions Total prescriptions filled by patients agedincreased, but declined for the largest per capitausers, those older than 65.but remain the largest per-person users ofmedicines. All Americans – including the healthy anduntreated – on average use 12.2 prescriptionsper year.slightly among people over 65, from 28.1 to 27.8prescriptions per year.65-79 increased 4.3%, while the 65-79 populationincreased 5.3%, resulting in a per capita declineof 1.0%. Seniors ages 65-79 use five times the amount ofdrugs as young adults ages 19-25.Chart notes:Dispensed prescriptions in retail and mail order pharmacies. Per capita prescription growth shown here does not include long-term care pharmacies, and mail orderprescriptions, are unprojected. This may account for the difference between total market per capita prescription growth and the growth shown on this page.Medicine Use and Shifting Costs of Healthcare. Report by the IMS Institute for Healthcare Informatics.
10Patient payment for healthcare and medicinesPatients with insurance are paying higher premiums, deductibles and co-pays orco-insurance for medicines despite cost reductions for many medicines, and offset by theintroduction of zero co-pays for preventive medicines. Insurance coverage has been shifting to high-deductible plan designs over the past decade,now accounting for 20% of insured patients. Average deductibles, where patients see the full cost of their healthcare until they reach aninsurance threshold, are up over 150% from five years ago. Plans with general deductibles, which can apply to both medical procedures and prescriptiondrugs, now account for 78% of plans, and more than half of those plans have a deductible of 1,000 or more. Despite overall increases in out-of-pocket costs, prescription drug costs for most patients areactually declining, with more than half of all prescriptions costing less than 5, and 23% nowavailable with zero out-of-pocket costs. 2013 saw a dramatic rise in the number of prescriptions with zero out-of-pocket cost, drivenby common preventive medicines and including oral contraceptives for women. At the other end of costs, 30% of patient prescription out-of-pocket costs came from just 2.3%of prescriptions, often high-cost specialty medicines or seniors in the donut hole portion oftheir Medicare part D coverage. Prescription drug out-of-pocket costs vary widely by payment type, with Medicare Part D andMedicaid prescriptions costing beneficiaries much less than those with commercial insurance. Prescriptions are rejected by insurers or abandoned by patients 9% of the time on average,with the most common insurer reasons being formulary status, or refilling too soon. Many newer medicines offer patient savings programs or coupons to mitigate patient costs,often reducing out-of-pocket cost exposure to similar levels for generics in the same classes.Medicine Use and Shifting Costs of Healthcare. Report by the IMS Institute for Healthcare Informatics.
11PATIENT PAYMENT FOR HEALTHCARE AND MEDICINESInsurance coverage has been shifting tohigh-deductible plan designs over the past decadePercentage of workers by employer-based insurance type 820092010HMO & Other Types201120122013HDHP/SOSource: Kaiser Family Foundation, Kaiser Employer Health Benefits – 2013 Annual Survey, Jan 2014 PPOs remain steady as the largest type ofinsurance for employer-based coverage,fluctuating through a narrow range of 55 to 58%over the past decade and representing 57% ofworkers in 2013. High-deductible health plans (HDHPs) and thoseplans with savings options (Health SavingsAccounts or HSAs) were introduced for the firsttime in 2006. They are characterized by lowerinsurance premiums than PPO plans, and theyoften have significant deductibles, where thebeneficiary pays the full cost of healthcareservices until they reach a level of spend whereco-insurance begins to apply. HDHPs have historically been chosen by youngerand healthier individuals. 20% of workers nowhave this type of plan. Employers are actively encouraging employees tochoose HDHP plans and 17% of employers onlyoffered high deductible plans in 2013 up 31%from 2012. Consumers’ out-of-pocket spending tends to beinfluenced both by their health status and theinsurance they choose and is measurably lesswith high deductible plans, perhaps because ofthe visible costs during the deductible period. HMO and other types have declined in popularity.Chart notes:HMO, Other includes HMO plans, which are 60% of the total, POS plans, and traditional plans which were dominant in the1980s but are now less than 1% of plan designs.HDHP/SO refers to high deductible plans and those high deductible plans that include a savings option such as a health savings account.Medicine Use and Shifting Costs of Healthcare. Report by the IMS Institute for Healthcare Informatics.
12PATIENT PAYMENT FOR HEALTHCARE AND MEDICINESEmployees are increasingly choosing - or havingchosen for them - plans with deductibles whoselevel is risingEmployer-based insurance with deductibles 2006-2013US 1,60072%1,4001,20078%52%60%50%40%38%80040080%70% 1,1351,00060090% 58430%20%10%10%20060%2007% of Workers with Deductible200820092010Average Deductible201120122013% of Workers with Deductible of 1,000Source: Kaiser Family Foundation, Jan 2014 Thirty-eight percent of employer-sponsoredinsured workers have a deductible of morethan 1,000. Many of these may be in consumer-drivenhealth plans, but traditional insurance is clearlymigrating to higher deductibles as well. Deductibles rose more slowly in 2013 than in Plans are now increasingly offering in-network vs.out-of-network deductibles to further encourageusage of specific networks with negotiated lowercosts and/or demonstrated better outcomes. In some cases the in-network deductible is lessthan half the amount of out-of-network.prior years.Medicine Use and Shifting Costs of Healthcare. Report by the IMS Institute for Healthcare Informatics.
13PATIENT PAYMENT FOR HEALTHCARE AND MEDICINESFree prescriptions now represent 23% of allprescriptions filled at the pharmacy, and more thanthree quarters of all prescriptions cost patients lessthan ten dollarsPercent of retail dispensed prescriptions by out-of-pocket costs US 31.7%21.7%33.8%23.2%23.3%21.6%10.0% 9.6%4.6% 4.0%No % 5.5%2.4% 2.3%30.01-70.0070.01 PRESCRIPTION OUT-OF-POCKET COSTS US 20122013Source: IMS Health, Xponent PlanTrak Co-pay Dec 2013 More than half of all prescriptions cost 5 or lessand one in five prescriptions have no co-pay. Low cost generics account for nearly all of thegrowth in prescriptions under 5. Patients saved an average of 0.63 on eachprescription they filled in 2013 compared to 2012. Oral contraceptives account for the largestincreases in prescriptions with no co-pay. Generics represent most of the prescriptionswith out-of-pocket costs below 10, while brandsmore commonly have out-of-pocket costs above 20. For prescriptions with co-pays above 70, whileonly 2.3% of the total prescription volume, thesepatients pay a disproportionate amount of overallout-of-pocket costs.Chart notes:Out-of-pocket costs cover prescriptions dispensed at retail pharmacies for patients with private insurance, Medicare Part D, Medicaid, and include co-payments andco-insurance as relevant.Medicine Use and Shifting Costs of Healthcare. Report by the IMS Institute for Healthcare Informatics.
14PATIENT PAYMENT FOR HEALTHCARE AND MEDICINESPrescriptions with co-pays over 10 account for threequarters of patient out-of-pocket costs including 30%from the 2.3% of scripts costing more than 70Retail dispensed prescriptions by out-of-pocket costs US 23.2%9.1%0.0%Share of TRxNo Co-Pay0.01-5.005.01-10.00Share of Total Out-of-pocket Costs10.01-20.0020.01-30.0030.01-70.0070.01 Source: IMS Health, Xponent PlanTrak Co-pay Dec 2013 For co-pays above 70, the average out-of-pocketcost was 145, 15 times higher than the nationalaverage. These top co-pays were only 2.3% of prescriptions,but accounted for 29.9% of overall out-of-pocketcosts paid by patients. Th
Out-of-pocket costs continue to rise for patients, despite generic medicines now representing 86% of prescriptions, and average out-of-pocket costs falling below 10 overall. Zero co-pays for contraceptives and coupon programs from manufacturers are two of the ways that patient costs are being offset. Patients abandon 3% of prescriptions at the