Transcription
2020 Building Performance Analysis Conference andSimBuild co-organized by ASHRAE and IBPSA-USADECENTRALIZED APPROACH TO MULTI-ZONE GREY-BOX MODELING FORMODEL-BASED PREDICTIVE CONTROLJaewan Joe1, Borui Cui1, Piljae Im1*, Jin Dong1, and Kuruganti Teja11Oak Ridge National Laboratory, Oak Ridge, United States of AmericaABSTRACTThis study aims to improve the easiness of utilizing thegrey-box model (i.e., Resistance-Capacitance circuit) forModel-based Predictive Control (MPC). The primarybarrier of implementing the MPC is estimating thecontrol-oriented building model that needs to becomputationally inexpensive and quick but reasonablyprecise in predicting building load and indoor conditions.The estimating of the model parameters becomes morecomplicated when the building scale is larger; e.g.,multi-zone building. In this study, a decentralizedapproach is introduced; each zone is split andindividually estimated with measured boundarytemperature from adjacent zones integrated into onesingle system model. The proposed decentralizedmethod is demonstrated with experimental data from afull-scale multi-zone test cell compared with thecentraliozed reference case.INTRODUCTIONCommercial buildings consume more than 19% of thetotal energy usage in the US, and Heating, Ventilationand Air Conditioning (HVAC) systems account for 27%of energy consumption (DOE 2011). Therefore,reducing excessive electricity consumption and peakdemand for the commercial sector is one of the mosturgent tasks. The advanced control of the building andits HVAC system is considered as a solution to resolvethe building energy-related issue.The MPC, one of the most advanced control strategies,is expected to save the building energy consumption byoptimizing control sequences using the building thermalmodel and its HVAC system models with weather anddisturbances forecasts (Rawlings et al. 2018). At eachtime-step, an optimal control problem is solved over aprediction horizon based on the predicted buildingthermal behavior and disturbances. Then the first controlsequence is implemented to the system, and a newoptimal control problem is solved with new predictedinformation.A number of studies have shown the energy-savingpotential through the MPC approach for the commercialbuilding sector. In a simulation study with a single zoneserved by an air-cooled chiller model, around 10 16%of cost-saving is achieved from the multi-agentdistributed optimization targeting the minimum monthlyelectricity bill including the HVAC operation anddemand cost (Cai et al. 2016). Also, a multi-zonesimulation study shows the superior control performance(i.e., 4% of energy-saving) of the simplified MPC to theheuristic rule-based control by utilizing the pre-coolingof the building thermal mass with a direct expansion airconditioning system as an HVAC source (Cai and Braun2015b). And when the MPC is applied to a tall multipurpose building, electricity cost is reduced by 36% and25% in cooling and heating seasons, respectively(Bianchini et al. 2019). Moreover, in the case of thesystem with large thermal mass (e.g., radiant floorsystem), the significant amount of the saving is achieved(e.g., 27 to 34% of cost-saving compared to a feedbackcontrol) (Joe and Karava 2019, Joe et al. 2018).The grey-box building model is in the middle of thewhite-box and black-box models that are fully based onphysics and data-driven, respectively (Arendt et al 2018).Compared to others (e.g., black box and white boxmodels), the grey-box model has distinct advantages.The model structure and its parameters preserve thephysical insight resulting in the most robust data-drivenmodel unlike a subspace model (e.g., N4SID, anumerical algorithm for subspace state-space systemIdentification). Also, it is possible to predict the longerbuilding thermal dynamics (e.g., several hours or days)while the classical system identification-based modelssuch as prediction error method (PEM) only predict theone-step (e.g., one hour) updating the model parameterswith the most recent data of the control input,disturbances, and resulting building dynamics. For this545 2020 ASHRAE (www.ashrae.org) and IBPSA-USA (www.ibpsa.us).For personal use only. Additional reproduction, distribution, or transmission in either print or digital form is not permitted withoutASHRAE or IBPSA-USA's prior written permission.
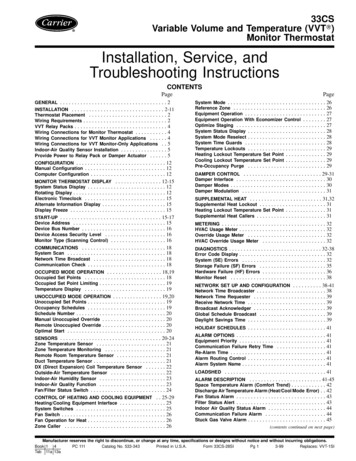
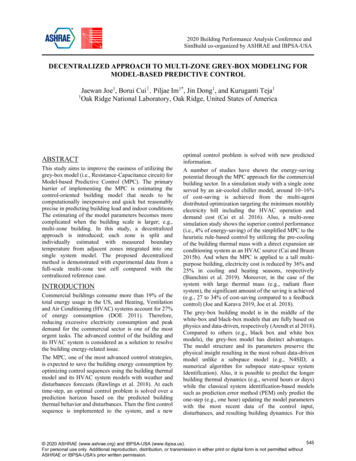
reason, a number of previous studies reported its robustperformance. One good example is presented for aresidential building model that leverages machinelearning to improve the prediction performance (Cui etal. 2019). Also, in a commercial building sector, themulti-zone building served with air handling units (AHU)is modeled with systematic approach by splitting theentire multi-zone into a couple of multi-zone accordingto the degree of the thermal coupling in order to reducethe number of estimated parameters (Cai and Braun2015a) and minimizing the unmeasured disturbances,namely lumped disturbance model based on thetheoretical background (Kim et al. 2016 and Kim et al.2018). And radiant floor system is modeled in a singlezone based on the multi-agent approach with adistributed optimization method (Joe and Karava 2016)which is implemented to an actual building for thedemonstration of MPC (Joe et al 2018).However, constructing a precise control-orientedbuilding model is one of the main barriers to implementthe MPC to the building in reality. Engineering cost forthe control-oriented building model is reported about 70%of the total project budget (Henze 2013). At the sametime, without the fine model, superior/accurate MPCperformance is not guaranteed; the impact of the buildingmodel on the building energy usage with the MPCapproach is reported by about 20% (Blum et al. 2019).With regard to the grey-box model, specifically, RCcircuit in this study, optimization for estimating themodel parameters is challenging due to its nonlinearnature; specifically, model parameters including theresistance and capacitance are nonlinear with theobjective function which is typically the summation ofsquared deviation between the predicted and measuredtemperature trajectories.Moreover, as the building scale becomes larger (e.g.,multi-zone), the dimension of the estimate parameters isincreased which burdens the computation and decreasesthe optimality of the solution. Also, in the case of themulti-zone, the objective function is the summation ofthe error of each zone and model quality might dependon the degree of the fluctuation for each zone; e.g.,parameters tend to be well estimated for more excitedzones. In this regard, a decentralized approach formodeling the control-oriented building model needs tobe developed which is flexible, scalable, and applicableto large-scale building applications such as multi-zone,the whole building, or building clusters.This study aims to develop the decentralized modelingmethod for the grey-box model in MPC applied to thebuilding/HVAC system. In order to validate the method,the experiment is carried out with a full-scale unoccupiedmulti-zone commercial building. The model parametersfor every single zone are estimated individually and thenintegrated without further optimization. The predictionperformance of the estimated and integrated buildingmodel is discussed with the estimation and validationsets.In this study, a methodology is discussed first with ageneral example for decentralized modeling and then thecase study modeling is presented based on theexperiments conducted in a full-scale multi-zonebuilding. The prediction performance of thedecentralized method is compared with the conventionalcentralized case.METHODOLOGYControl-oriented building modelIn this study, a grey-box model that consists of aresistance/capacitance (RC) circuit is estimated in astate-space formulation. Building thermal systems arebuilt from a heat balance equation in the form of a 1storder differential equation with parameters such asResistance (R) and Capacitance (C) and coefficientmultiplied to the disturbance inputs. In order to utilizethe advanced control strategies, those systems ofequations are formulated with one system in a matrixform with a state-space formulation. The matrices A andB consist of the R, C, and coefficients multiplied to thedisturbance inputs. A continuous-time state-space linearsystem is defined by the following equations:(eq 1)𝑥𝑥̇ (𝑡𝑡) 𝐴𝐴𝐴𝐴(𝑡𝑡) 𝐵𝐵𝐵𝐵(𝑡𝑡)(eq 2)𝑦𝑦(𝑡𝑡) 𝐶𝐶𝐶𝐶(𝑡𝑡) 𝐷𝐷𝐷𝐷(𝑢𝑢)Equation 3 represents the optimization formulation toestimate the building parameter set denoted as θ thatconsists of multiple R, C, and α. Due to the non-linearitybetween the parameter set and the objective function(typically two-norm, root mean square error (RMSE)),the nonlinear optimization method needs to be utilized.𝑌𝑌 and Y represents the predicted and measured room airtemperatures. The i and n mean the time and number ofdata.(𝑌𝑌 (𝜃𝜃)𝑖𝑖 𝑌𝑌𝑖𝑖 )2𝜃𝜃 argmin 𝑛𝑛𝑖𝑖 1 𝜃𝜃𝑛𝑛 1(eq 3)Decentralized approachRather than estimating all parameters in oneoptimization problem, the decentralized approach scalesdown the optimization problem from the multi-zonelevel to multiple single zones. Figure 1 represents thegeneric example of this approach. This is two multi-zoneexposed to an outdoor environment. Each zone consistsof one state and outdoor air temperature as a boundarytemperature. With the conventional centralized approach,this is 2C4R model and reduced to 1C2R model in adecentralized approach. The number of estimate546 2020 ASHRAE (www.ashrae.org) and IBPSA-USA (www.ibpsa.us).For personal use only. Additional reproduction, distribution, or transmission in either print or digital form is not permitted withoutASHRAE or IBPSA-USA's prior written permission.
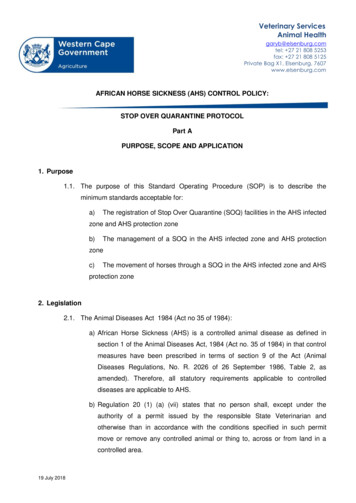
parameters including the R, C, and the coefficient isreduced from 8 to 4. And we reasonably assume animbalanced thermal coupling between two zones; e.g.,bidirectional airflow through the gap under the door.Figure 2 Front view(top) and plan drawing (bottom) ofthe test-bedFigure 1 Generic example of decentralized estimationModel performance evaluationWe use the RMSE to quantify the prediction error of theestimated building model as shown in equation 4. Tmeas,iand Tsimu,i represent the measured and simulated room airtemperatures.𝑅𝑅𝑅𝑅𝑅𝑅𝑅𝑅 𝑛𝑛𝑖𝑖 1 𝑇𝑇𝑚𝑚𝑚𝑚𝑚𝑚𝑚𝑚,𝑖𝑖 𝑇𝑇𝑠𝑠𝑠𝑠𝑠𝑠𝑠𝑠,𝑖𝑖 𝑛𝑛 12(eq 4)CASE STUDY WITH FULL SCALEMULTI ZONE BUILDINGTest-bed descriptionThe flexible research platform (FRP) in Oak RidgeNational Lab is used for the test. This is a two-storylightweight commercial building that represents typicalsmall office buildings built in the 1980s in the U.S. TheFRP has 10 conditioned zones with 2 unconditionedzones (i.e., staircase) with 0.4 m thick exterior wall asshown in Figure 2. The FRP is an unoccupied researchapparatus in which occupancy is emulated by processcontrol of lighting, humidifiers for human-based latentloading, and a heater for miscellaneous electrical loads(MELs). The 44 kW rooftop unit (RTU) conditions thezones with an air handling unit (AHU) and variable airvolume (VAVs) boxes in each room.A weather station on the roof measures outdoor airtemperature, relative humidity, and solar radiation. Inaddition, wall-mounted pyranometers installed in eachexternal wall (North, East, South, and West) measure thevertical solar radiation on each wall. Each room airtemperature is measured in the center of the room with acylinder-type temperature/humidity probe. The sametype of sensor measures the supply air temperatures inall 10 VAV boxes. Airflow rate entering all individualrooms are measured in VAV boxes with flowmeters. Thepower consumption of the heaters & humidifiers andlighting that are controlled remotely with pre-definedschedules are measured in each room and floor level,respectively.Experimental design for modelingIn order to decorrelate the exogenous inputs (e.g.,outdoor air temperature and solar radiation) and controlinput (i.e., cooling rate from AHU), FRP has beenoperated with and without HVAC system for every 3hours to generate the perturbed control input. With thisHVAC operation, room air temperatures of all roomsfree-float without an HVAC system, and the HVACsystem is turned on to reduce the room air temperaturewith the cooling provided. All internal heat gains fromthe heaters, humidifiers, and lightings are controlled withtypical office schedules, which are measured. Theinterior doors are closed however it has the gap on thebottom likewise a typical door where the Interzone airflow might occur.The test is conducted for 13 days from Sep 20th to Oct2nd, 2019. Prior to the test, the building was beingconditioned in a typical office occupied and unoccupied547 2020 ASHRAE (www.ashrae.org) and IBPSA-USA (www.ibpsa.us).For personal use only. Additional reproduction, distribution, or transmission in either print or digital form is not permitted withoutASHRAE or IBPSA-USA's prior written permission.
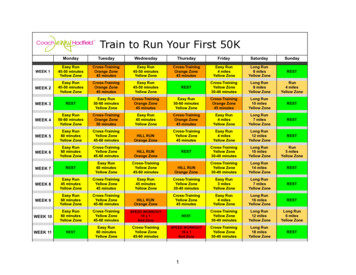
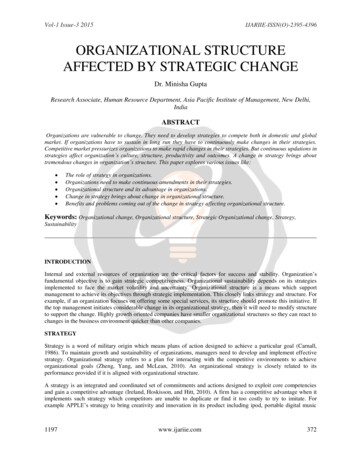
schedule. Those and the first day of the test period areused as warm-up days. The two days’ data in Sep 21stand 22nd is used for the estimation, and another two daysare added at the end of the estimation period for thevalidation (i.e., Sep 21st to 24th as a validation period).Reference case: centralized approachThe conventional centralized optimization is carried outas a reference case. Figure 3 shows the thermal networkof the building model in a centralized approach (2nd flooronly without heat flux inputs for simplicity). Thestructure of the model is 20C36R with 17 coefficientsmultiplied to the disturbance input (e.g., solar radiation).The total number of the estimated parameters is 70. Eachzone has two capacitances for the room air and envelope.The heat transfer between the floors and interior wall areassumed ignored; e.g., adiabatic boundary likewise oneof the literature (Cai and Braun 2015b; Cai et al. 2016).However, the model has an imbalanced thermal coupling(two resistances, as illustrated in Figure 3 with twoarrows) between the perimeter zones and core zonethrough the door; i.e., potential bidirectional airmovement under the door.The convection/radiation heat gain from the internalequipment to the room air and envelope is set based onthe assumption due to the lack of specific reference. The60% of the internal heat gain from the heaters andhumidifiers goes to the room air roughly adopting theconvection/radiation ratio for typical office equipmentfrom the literature that has more weight on convection(Hosni et al. 1999). And that of lighting heat gain is alsoroughly adopted from the ASHRAE fundamental (Ch.18); 60% goes to the envelope as radiation (ASHRAE2017).The initial values for all estimated parameters are setbased on the drawing and reasonable assumptions; e.g.,room air capacity is set from the room volume andspecific heat of the air, and the room capacity is upperbounded only. The typical convective heat transfercoefficients (3.05 W/(m2K) and 17.7 W/(m2K) for insideand outside respectively) are adopted from buildingenergy simulation programs (e.g., TRNSYS (TRNSYS16 2007)) to calculate the initial thermal resistancebetween the outdoor, envelope, and room air. In order toreduce the engineering cost and improve the easiness ofthe large-scale multi-zone modeling, roughly averagedvalues are used for the initial value; e.g., different designfor each room is averaged. Their lower and upper boundsare set with the power of 102 (i.e., θ0 10-2 θ θ0 102). The fmincon is used in Matlab environment asa nonlinear optimization solver (Mathwork).Figure 3 Thermal network of a centralized modelFigure 4 shows the modeling results of estimation andvalidation sets for the 2nd (top) and 1st (bottom) floor.Mostly, the RMSE is higher than 1 ; their average foreach floor are 1.5 , 2.2 , and 1.2 , 1.2 forestimation (2days) and validation (4days) sets (i.e.,prediction horizons are 2days and 4days and time-step is15min). The highest and lowest RMSE is 4.3 (room103) and 0.9 (room 204) in a validation set as shownin Figure 5. The prediction trend mostly follows themeasurement, however, this model is not reliable enoughto be used for MPC simulation study and implementation.Figure 4 Estimation and validation results of aconventional centralized approachFigure 5 Room air temperature comparison ofintegrated model validation in a centralized approach(top: best case, bottom: worst case)548 2020 ASHRAE (www.ashrae.org) and IBPSA-USA (www.ibpsa.us).For personal use only. Additional reproduction, distribution, or transmission in either print or digital form is not permitted withoutASHRAE or IBPSA-USA's prior written permission.
Decentralized approachSingle zone estimation and validationFigure 6 Thermal network of a single zone in adecentralized approachFigure 6 shows the single zone (room 205) in adecentralized approach as an example. The number ofestimated parameters is 7 including two capacitances,three resistances, and two coefficients multiplied to thedisturbance inputs (e.g., solar radiation). The multipleestimations for the individual room are carried outsequentially with boundary temperature trajectories fromthe adjacent zone (i.e., only between the core andperimeter zone) for two days. Then, the simulation forthe validation set runs with an additional two days addedat the end of the estimation set.Figure 7 Room air temperature comparison forestimation and validation along with disturbance andcontrol inputs (room 206, the worst case).Figure 7 represents the modeling results withdecentralized approach for room 206 (the worst case); itshows room air temperature comparison (Troom.exp andTroom.est) of the estimation (day1 2) and validation(day1 4) results along with disturbance inputs (i.e.,outdoor air temperature (Troom), solar radiation (Qsol),internal equipment heat gain (Qint), lighting heat gain(LGT)) and control input (i.e., cooling rate fromAHU/VAV (QAHU)). The RMSE of the estimation andvalidation sets are 0.7 and 0.6 , respectively. Theprediction performance is improved (roughly half cut oferror) compared to the conventional centralizedapproach; e.g., 1.2 vs. 0.6 .Integrated model validationEstimated single zone models are integrated into onemodel (likewise Figure 3) without further estimationefforts. However, this work requires cumbersomeengineering costs. In order to improve the easiness of thisintegration procedure, every single system is input to theintegrated model in a loop fashion; e.g., for loop. Andcoupling terms between the core and perimeter zones areinput manually (red resistance in Figure 3).Figure 8 shows the RMSE of the integrated model alongwith estimation and validation sets of individual singlezone modeling. The averaged RMSE of each floor is 0.5 and 0.6 in a validation set with the integrated model.And Figure 8 shows the best and worst-case which areroom 106 and 206). Their RMSE is 0.4 and 0.7 .When the model is integrated, the error of the adjacentzone impacts on the target zone temperature predictionwhile the actual estimation is carried out withmeasurement of the neighboring zone as a boundarytemperature. This error can be accumulated in time. Thiseffect seems not significant in this study due to theimproved performance of the single zone models.Figure 8 Estimation and validation results of adecentralized approach549 2020 ASHRAE (www.ashrae.org) and IBPSA-USA (www.ibpsa.us).For personal use only. Additional reproduction, distribution, or transmission in either print or digital form is not permitted withoutASHRAE or IBPSA-USA's prior written permission.
angle in a year. The appropriate optimal controlformulation will be developed based on the estimatedbuilding model in this study and developed/identifiedHVAC model (rooftop unit (RTU) with a directexpansion (DX) system for this study).ACKNOWLEDGMENTFigure 9 Room air temperature comparison ofintegrated model validation in the decentralizedapproach (top: best case, bottom: worst case)Table 1 shows the minimum, average, and maximumRMSE of rooms in all 4 cases. As the decentralizedmodel development proceeds, the RMSE increases. Thefinal integrated model is much accurate than theconventional centralized model.Table 1 Minimum, average, and maximum RMSE ( )of rooms in all eIntegratedzonezonezonezonevalidation estimation validation x4.330.670.740.75CONCLUSIONThis work proposes the decentralized approach to themulti-zone modeling for MPC application. Experimentaldata from the actual full-scale building is used for thedemonstration. The integrated model shows goodprediction performance. This method is scalable andapplicable to the larger-scale building system. Specificfindings from this work are summarized as follows: As a reference case, the prediction performanceof the centralized model is limited to be used. Single zone modelings were successful withmeasured boundary temperature from anadjacent room in the estimation and validationset.The prediction performance of the final multizone model decreases slightly when integratedhowever still good to be leveraged for the actualimplementation.The estimated multi-zone model is planned to be usedfor the implementation of the cooling season in 2020.Some of the estimated model parameters need to beadopted as needed; e.g., coefficient multiplied to thesolar radiation input that possibly depends on the solar The research presented in this paper was funded by theUnited States Department of Energy, Energy Efficiencyand Renewable Energy Office, Building TechnologyOffice under the grid modernization program.NOMENCLATURESymbolABCCDinRtTuxy𝑌𝑌 YθMeaningstate matrix in state space formulationinput matrix in state space formulationoutput matrix in state space formulationcapacitancefeedthrough matrix in state spaceformulationtime (15min)number of datathermal resistancetime in continuous systemtemperaturesystem input of the state spaceformulationstate (temperature)output (temperature) in state spaceformulationpredicted room air temperaturesmeasured room air temperaturesestimate parameterREFERENCESArendt, K, M Jradi, H R Shaker, C T Veje, and SouthernDenmark. 2018. Comparative analysis of white-,gray- and black-box models for thermal simulationof indoor environment : teaching building casestudy. Proceeding of 2018 Building PerformanceModeling Conference and SimBuild, Sep 26-28,2018, Chicago, IL, U.S.ASHRAE. 2017.ASHRAE Handbook – Fundamentals.Bianchini, G., Casini, M., Pepe, D., Vicino, A.,Zanvettor, G. G. 2019. An Integrated ModelPredictive Control Approach for Optimal HVACand Energy Storage Operation in Large-ScaleBuildings. Applied Energy 240 (January): 327–40.Blum, D. H., Arendt, K., Rivalin, L., Piette, M. A.,Wetter, M., Veje, C. T. 2019. Practical Factors ofEnvelope Model Setup and Their Effects on thePerformance of Model Predictive Control for550 2020 ASHRAE (www.ashrae.org) and IBPSA-USA (www.ibpsa.us).For personal use only. Additional reproduction, distribution, or transmission in either print or digital form is not permitted withoutASHRAE or IBPSA-USA's prior written permission.
Building Heating , Ventilating , and AirConditioning Systems. Applied Energy 236(November 2018): 410–25.Cai, J., Braun, J. E. 2015a. An Inverse HygrothermalModel for Multi-Zone Buildings. Journal ofBuilding Performance Simulation 1493 (November):1–19.Cai, J., Braun, J. E. 2015b. A generalized controlheuristic and simplified model predictive controlstrategy for direct-expansion air-conditioningsystems, Science and Technology for the BuiltEnvironment 21(6), 773-788.Cai, J., Braun, J. E., Kim, D., Hu, J. 2016. Generalapproaches for determining the savings potential ofoptimal control for cooling in commercial buildingshaving both energy and demand charges, Scienceand Technology for the Built Environment 22(6),733-750.Cui, B., Fan, R., C., Munk, J., Mao, N., Xiao, F., Dong,J., Kuruganti, T. 2019. A hybrid building thermalmodeling approach for predicting temperatures intypical, detached, two-story houses. Applied Energy236: 101-116.Henze, G. P. 2013. Model predictive control forbuildings: a quantum leap?. Journal of BuildingPerformance Simulation, 6(3), 157–158.Hosni, Mohammad H., Byron W. Jones, and HanmingXu. 1999. Experimental Results for Heat Gain andRadiant/Convective Split from Equipment inBuildings. ASHRAE Transactions 105.Joe, J. Karava, P. 2016. Agent-Based SystemIdentification for Control- Oriented BuildingModels. Journal of Building PerformanceSimulation 0 (0): 1–22.Joe, J., Karava, P., Hou, X., Xiao, Y., & Hu, J. 2018. Adistributed approach to model-predictive control ofradiant comfort delivery systems in office spaceswith localized thermal environments. Energy /J.ENBUILD.2018.06.068Joe, J. Karava, P. 2019. A model predictive controlstrategy to optimize the performance of radiant floorheating and cooling systems in office buildings.Applied Energy 245: 65–77.Kim, D., Cai, J., Ariyur, K. B., & Braun, J. E. 2016.System identification for building thermal systemsunder the presence of unmeasured disturbances inclosed loop operation: Lumped disturbancemodeling approach. Building and Environment, 107,169–180.Kim, D., Cai, J.,Braun, J. E., Ariyur, K. B. 2018. Energy& Buildings System Identification for BuildingThermal Systems under the Presence ofUnmeasured Disturbances in Closed LoopOperation: Theoretical Analysis and Application.Energy & Buildings 167: 359–69.Mathworks /ug/fmincon.htmlRawlings, B. James, David, Q. Mayne, Moritz, M. Diehl.2018. Model Predictive Control: Theory,Computation, and Design, 2nd Edition, Nob HillPublishing.TRNSYS 16. 2007. Multizone Building modeling ublic/Documentation/06-MultizoneBuilding.pdfU.S. Department of Energy. 2018. .gov/sites/prod/files/2018/07/f54/steab-july12 bto geb.pdf551 2020 ASHRAE (www.ashrae.org) and IBPSA-USA (www.ibpsa.us).For personal use only. Additional reproduction, distribution, or transmission in either print or digital form is not permitted withoutASHRAE or IBPSA-USA's prior written permission.
modeling the control-oriented building model s to need be developed which is flexible, scalable, and applicable to large-scale building applications such as zonemulti, - the whole building, or building clusters. This study aims to develop the decentralized modeling method for the grey -box model in MPC applied to the building/HVAC system.