Transcription
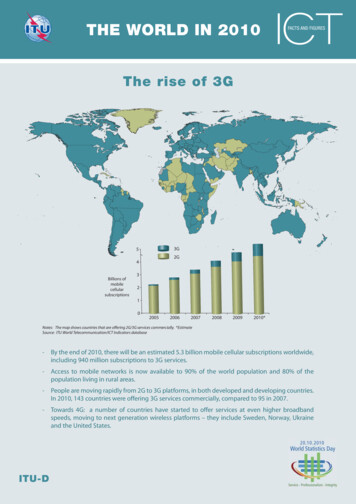
THE WORLD IN 2010FACTS AND FIGURESThe rise of 3G3G52G4Billions 0092010*Notes: The map shows countries that are offering 2G/3G services commercially. *EstimateSource: ITU World Telecommunication/ICT Indicators database- By the end of 2010, there will be an estimated 5.3 billion mobile cellular subscriptions worldwide,including 940 million subscriptions to 3G services.- Access to mobile networks is now available to 90% of the world population and 80% of thepopulation living in rural areas.- People are moving rapidly from 2G to 3G platforms, in both developed and developing countries.In 2010, 143 countries were offering 3G services commercially, compared to 95 in 2007.- Towards 4G: a number of countries have started to offer services at even higher broadbandspeeds, moving to next generation wireless platforms – they include Sweden, Norway, Ukraineand the United States.ITU-D
THE WORLD IN 2010FACTS AND FIGURESTowards the end of double-digitmobile growthMobile cellulargrowth rate 06/072007/082008/092009/10*Note: *EstimateSource: ITU World Telecommunication/ICT Indicators database- Mobile cellular growth is slowing worldwide. In developed countries, the mobile market isreaching saturation levels with on average 116 subscriptions per 100 inhabitants at the end of2010 and a marginal growth of 1.6% from 2009-2010.- At the same time, the developing world is increasing its share of mobile subscriptions from 53%of total mobile subscriptions at the end of 2005 to 73% at the end of 2010.1502520Mobile cellularsubscriptionsper 100inhabitants,20101001510502009/2010growth rate (%)500CISEuropeTheAmericasArabStatesAsia &PacificAfricaNote: 2010 data are estimatesSource: ITU World Telecommunication/ICT Indicators database- In the developing world, mobile cellular penetration rates will reach 68% at the endof 2010 - mainly driven by the Asia and Pacific region. India and China alone are expected to addover 300 million mobile subscriptions in 2010.- In the African region, penetration rates will reach an estimated 41% at the end of 2010 (comparedto 76% globally) leaving a significant potential for growth.
THE WORLD IN 2010FACTS AND FIGURESSMS triples in three yearsNote: *EstimateSource: ITU World Telecommunication/ICT Indicators database- The total number of SMS sent globally tripled between 2007 and 2010, from an estimated 1.8trillion to a staggering 6.1 trillion. In other words, close to 200 000 text messages are sent everysecond.- Assuming an average cost of USD 0.07 per SMS, in 2010 SMS traffic is generating an estimatedUSD 812 000 every minute (or around USD 14 000 every second).- In 2009, SMS revenue accounted for 12% of China’s largest mobile operator’s total revenue.- The Philippines and the United States combined accounted for 35% of all SMS sent in 2009.
THE WORLD IN 2010FACTS AND FIGURESTwo billion people on the Internet but too few in AfricaPer 100 inhabitants, 2010Billions ofInternet usersAfricaArab StatesCISEuropeThe AmericasAsia & 50200520062007200820092010Note: *EstimateSource: ITU World Telecommunication/ICT Indicators database- The number of Internet users has doubled between 2005 and 2010.- In 2010, the number of Internet users will surpass the two billion mark, of which 1.2 billion will bein developing countries.- A number of countries, including Estonia, Finland and Spain have declared access to the Internetas a legal right for citizens.- With more than 420 million Internet users, China is the largest Internet market in the world.- While 71% of the population in developed countries are online, only 21% of the population indeveloping countries are online. By the end of 2010, Internet user penetration in Africa will reach9.6%, far behind both the world average (30%) and the developing country average (21%).
THE WORLD IN 2010FACTS AND FIGURESConnecting homes98.0%72.4%71.0%65.6%22.5%15.8%1.8 billion 1.4 billion0.6 billion0.5 billionHouseholds Households with computerPenetration, developed countriesHouseholds with TV Households with Internet accessPenetration, developing countriesNote: Data refer to 2010 and are estimatesSource: ITU World Telecommunication/ICT Indicators database- While in developing countries 72.4% of households have a TV, only 22.5% have a computer andonly 15.8% have Internet access (compared to 98%, 71% and 65.6% respectively in developedcountries).- At the end of 2010, half a billion households worldwide (or 29.5%) will have access to the Internet.- In some countries, including the Republic of Korea, Netherlands and Sweden, more than 80% ofhouseholds have Internet access, almost all of them through a broadband connection.- The number of people having access to the Internet at home has increased from 1.4 billion in2009 to almost 1.6 billion in 2010.
THE WORLD IN 2010FACTS AND FIGURESThe continuing broadband divideFixed broadbandsubscriptionsper 100 inhabitants25DevelopedWorldDeveloping201510502000 2001 2002 2003 2004 2005 2006 2007 2008 2009 2010*2010Note: *EstimateSource: ITU World Telecommunication/ICT Indicators database- There has been strong growth in fixed (wired) broadband subscriptions, in both developed anddeveloping countries: at the end of 2010, fixed (wired) broadband subscriptions will reach anestimated 555 million globally (or 8% penetration), up from 471 million (or 6.9% penetration)a year earlier.- Despite these promising trends, penetration levels in developing countries remain low:4.4 subscriptions per 100 people compared to 24.6 in developed countries.Fixed broadbandsubscriptionsper 100 inhabitants2520151050AfricaArabStatesAsia &PacificCISTheAmericasEuropeNote: Data refer to 2010 and are estimatesSource: ITU World Telecommunication/ICT Indicators database- The developing world’s share of fixed (wired) broadband subscriptions is growing steadily:by the end of 2010, the developing world will account for an estimated 45% of globalsubscriptions (up from 42% five years earlier).- Africa still lags behind when it comes to fixed (wired) broadband. Although subscriptions areincreasing, a penetration rate of less than 1% illustrates the challenges that persist in increasingaccess to high-speed, high-capacity Internet access in the region.
THE WORLD IN 2010FACTS AND FIGURESBroadband speed and affordabilityTime needed to download online content at different connection speeds256kbpsConnection speed2Mbps10Mbps100MbpsContent(160 KB)00:00:0500:00:01 * 00:00:00 * 00:00:00 *(5MB)00:02:3600:00:2000:00:0400:00:00 *(20MB)CD / low quality movie 09:2000:00:0200:00:56DVD / high quality movie (4GB)34:43:2004:26:4000:53:2000:05:20Google home pageMusic trackVideo clip*Source: ITU calculation.Note: * Rounded values.- With the rapidly increasing high-bandwidth content and applications on the Internet, there is agrowing demand for higher-speed connections. For example, at the minimum broadband speedof 256 kbps, downloading a high-quality movie takes almost 1½ days - compared to 5 minutes ata connection speed of 100 Mbps.Average price in developing countries, 2009Monthly price,PPP Penetration in developing countries, 2009Per 100inhabitants200706015050401003020501000Mobile cellular basketFixed broadband basketMobile cellularsubscriptionsFixed broadbandsubscriptionsSource: Measuring the Information Society Report 2010, ITU- Fixed (wired) broadband prices dropped by 42% between 2008 and 2009 but there are hugedifferences among countries when it comes to the affordability of broadband: in 2009,an entry-level fixed (wired) broadband connection cost on average 190 PPP per month indeveloping countries, compared to only 28 PPP per month in developed countries. This hassignificant implications for the uptake of ICT services, which is much higher for lower-cost mobilecellular compared to higher-priced fixed broadband.
THE WORLD IN 2010FACTS AND FIGURESFor more information:Market Information and Statistics DivisionTelecommunication Development BureauInternational Telecommunication Union (ITU)Place des Nations1211 Geneva 20 - /Partnership on MeasuringICT for DevelopmentPARTNERSHIP ONMEASURING ICTFOR DEVELOPMENTwww.itu.intPromoting developmentthrough ICT statisticsI n t e r n a t i o n a lT e l e c o m m u n i c a t i o nU n i o nMANUALfor Measuring ICT Access and Useby Households and Individuals2009 EDITIONITU-D
THE WORLD IN 2010 FACTS AND FIGURES - By the end of 2010, there will be an estimated 5.3 billion mobile cellular subscriptions worldwide, including 940 million subscriptions to 3G services. - Access to mobile networks is now available to 90% of the world population and 80% of the population living in rural areas.