Transcription
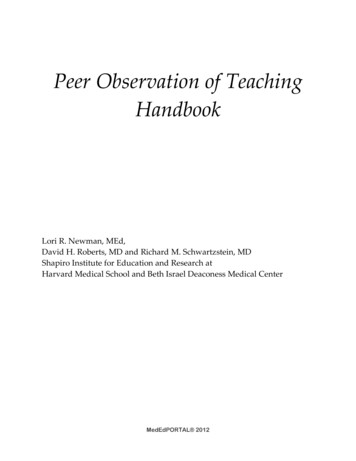
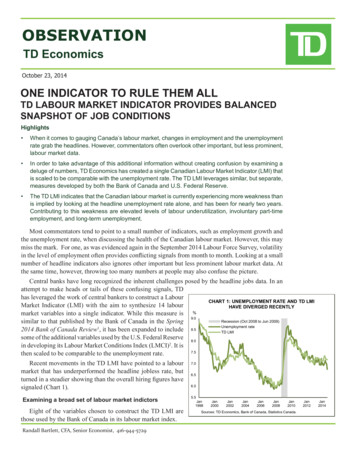
OBSERVATIONTD EconomicsOctober 23, 2014ONE INDICATOR TO RULE THEM ALLTD LABOUR MARKET INDICATOR PROVIDES BALANCEDSNAPSHOT OF JOB CONDITIONSHighlights When it comes to gauging Canada’s labour market, changes in employment and the unemploymentrate grab the headlines. However, commentators often overlook other important, but less prominent,labour market data. In order to take advantage of this additional information without creating confusion by examining adeluge of numbers, TD Economics has created a single Canadian Labour Market Indicator (LMI) thatis scaled to be comparable with the unemployment rate. The TD LMI leverages similar, but separate,measures developed by both the Bank of Canada and U.S. Federal Reserve. The TD LMI indicates that the Canadian labour market is currently experiencing more weakness thanis implied by looking at the headline unemployment rate alone, and has been for nearly two years.Contributing to this weakness are elevated levels of labour underutilization, involuntary part-timeemployment, and long-term unemployment.Most commentators tend to point to a small number of indicators, such as employment growth andthe unemployment rate, when discussing the health of the Canadian labour market. However, this maymiss the mark. For one, as was evidenced again in the September 2014 Labour Force Survey, volatilityin the level of employment often provides conflicting signals from month to month. Looking at a smallnumber of headline indicators also ignores other important but less prominent labour market data. Atthe same time, however, throwing too many numbers at people may also confuse the picture.Central banks have long recognized the inherent challenges posed by the headline jobs data. In anattempt to make heads or tails of these confusing signals, TDhas leveraged the work of central bankers to construct a LabourCHART 1: UNEMPLOYMENT RATE AND TD LMIMarket Indicator (LMI) with the aim to synthesize 14 labourHAVE DIVERGED RECENTLYmarket variables into a single indicator. While this measure is %9.0Recession (Oct 2008 to Jun 2009)similar to that published by the Bank of Canada in the SpringUnemployment rate12014 Bank of Canada Review , it has been expanded to include 8.5TD LMIsome of the additional variables used by the U.S. Federal Reserve 8.0in developing its Labour Market Conditions Index (LMCI)2. It is7.5then scaled to be comparable to the unemployment rate.Recent movements in the TD LMI have pointed to a labourmarket that has underperformed the headline jobless rate, butturned in a steadier showing than the overall hiring figures havesignaled (Chart 1).Examining a broad set of labour market indictorsEight of the variables chosen to construct the TD LMI arethose used by the Bank of Canada in its labour market index.Randall Bartlett, CFA, Senior Economist, 04Jan2006Jan2008Jan2010Sources: TD Economics, Bank of Canada, Statistics Canada.Jan2012Jan2014
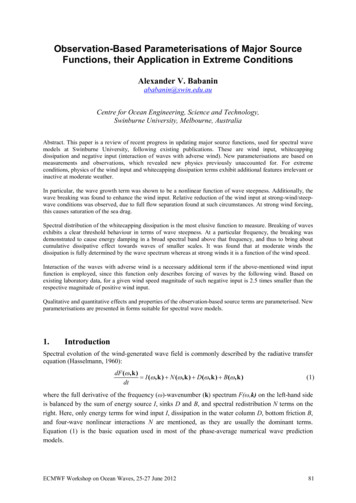
TD Economics www.td.com/economicsunemployed in the past four weeks.Variables positively correlated with the TD LMIo Unemployment rate – Among the better known labourmarket indicators, the unemployment rate is the numberof unemployed Canadians that are actively looking forwork as a share of the labour force (Chart 2). FromJanuary 2013 to September 2014, the unemploymentrate has remained broadly unchanged at round 7%.o Labour underutilization rate – The labour underutilizationrate (the so-called ‘R8’) includes the official unemploymentrate as well as discouraged searchers, those waiting toreturn to work, and a portion of involuntary part-timers(Chart 2). Therefore, it provides a broader glimpse atthe state of the labour market than the unemploymentrate alone. Much like the unemployment rate, the labourunderutilization rate has remained elevated since therecession, hovering around 10% from January 2013 toSeptember 2014.o Long-term unemployment – Similar to the Bank ofCanada, we use the share of long-term unemployed(Canadians unemployed for 27 weeks or more) in totalunemployed. As is clear from Chart 2, the share of longterm unemployed in Canada has remained high since therecession and been broadly unchanged from late-2009through September 2014 at around 20%.o Separation rate – The separation rate is the proportionof total employed last month that became unemployedwithin the past 4 weeks, including those that have lefttheir positions voluntarily or otherwise. The separationrate has fallen by about one-third from its recessionarypeak, to reach about 2.5% in September 2014. This meansthat about 2.5% of those employed last month becameCHART 2: THE CLOSER YOU LOOK, THE WORSETHE UNEMPLOYMENT NUMBERS%25Recession (Oct 2008 to Jun 2009)Unemployment rateLabour underutilization rateLong-term unemployment share2015o Job-finding rate – Essentially the opposite of theseparation rate, the job-finding rate is the proportionof total unemployed workers last month who becameemployed in the past four weeks. The job-finding rate hasrisen to about 35% in September 2014 from around 30%during the recession, although the current level is downfrom the pre-recession peak of around 42%. The currentjob-finding rate means that 35% of those unemployed lastmonth became employed in the previous four weeks.o Participation rate of prime-aged workers – For thepurpose of this report, we defined the participation rateas the share of Canadians aged 25 to 54 that are workingor unemployed but actively looking for work in that samepopulation. The participation rate provides an indicationof the level of labour force attachment among Canadians,where increases are considered to indicate an improvinglabour market. This age group, in particular, includesthose most likely to be active in the labour force, with aparticipation rate of over 85% in September 2014, albeitdown from over 87% a couple of years before.o Growth in average weekly hours worked – While theabove indicators give us an idea of Canadians activeinvolvement in the labour force, average weekly hoursworked provides an indication of the intensity of the workbeing done. Growth in average weekly hours worked istherefore used in the TD LMI. On a seasonally-adjustedbasis, average weekly hours worked have been fallingover time, and have averaged just below 34 hours a weekso far in 2014.o Wage growth – Finally, wage growth is an importantindicator of labour market tightness. This is because,when labour demand outstrips supply, one would expectwages to rise more quickly as companies compete forworkers with the skills they need. Wages would beexpected to rise more slowly in the opposite situation. InSeptember 2014, average hourly wage growth was 2.1%y/y, roughly equivalent to total CPI inflation.Expanding on the Bank of Canada’s work105Variables negatively correlated with the TD 10Jan2012Jan2014Sources: Statistics Canada, TD Economics.Note:All non-seasonally adjusted series were seasonally adjusted usingCensus X12.October 23, 2014While the indicators provided by the Bank of Canada areuseful, the list is not exhaustive. A newly-unveiled index onU.S. labour market conditions that was developed by theFederal Reserve includes a number of additional variables.Leveraging this analysis, we have elected to add six addi2
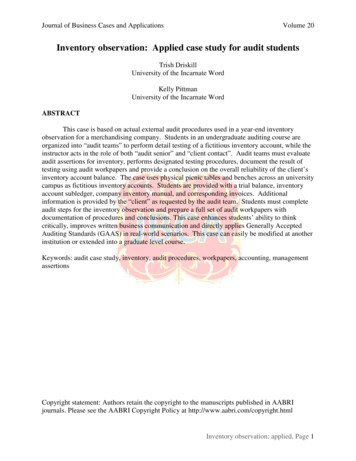
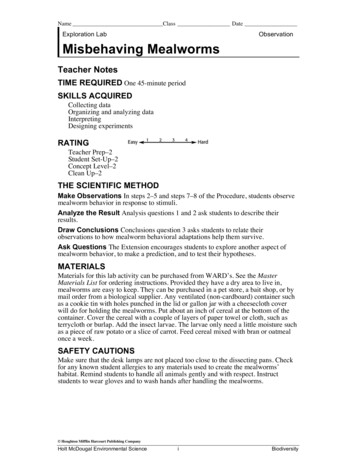
TD Economics www.td.com/economicsCHART 3: INVOLUNTARY PART-TIME AND% of labour TEMPORARY EMPLOYMENT REMAIN % of labourELEVATEDforceforce5.511.5Recession (Oct 2008 to Jun 2009)Involuntary part-time (LHS)Temporary employment 5Sources: Statistics Canada, TD Economics.Note:All non-seasonally adjusted series were seasonally adjusted usingCensus X12.tional labour market variables to our TD LMI for Canada.Variables positively correlated with the TD LMIo Involuntary part-time employed – In the TD LMI,we capture the evolution of involuntary part-timeemployment by including it as a share of the labour force(Chart 3). In September 2014, about 20% of Canadiansthat work part-time that would prefer not to, a share thathas remained broadly unchanged for nearly two decades.That said, when the economy is struggling, the share ofpart-time employed in the labour force rises, particularlyfor those working part-time that would prefer not to be.o Self-employment – Self-employment (measured here as ashare of the labour force), while a preferred employmentchoice for many, is well known to increase during periodsof economic stress. For instance, self-employmentpeaked at 14.9% of the labour force in October 2009,following a dramatic rise during the 2008-09 recession.Since then, the most notable increases have occurredsince the beginning of 2013, although the share of thelabour force remained at a more subdued 14.0% inSeptember 2014. As such, we have chosen to use selfemployed Canadians in the TD LMI.o Benefits-to-unemployed ratio – When the economyenters recession, unemployment often increases. Atthe same time, the number of Canadians receivingEmployment Insurance (EI) benefits also increases,often at a faster rate, as recently unemployed are morelikely to qualify for benefits. However, if a recipient ofEI benefits remains unemployed for an extended periodof time, those benefits may be exhausted. As a result, theOctober 23, 2014benefits-to-unemployed ratio tends to fall as the economyrecovers, reaching a near historic low of around 37% inSeptember 2014. As such, we have selected the benefitsto-unemployed ratio, defined as the ratio of Canadiansreceiving regular EI benefits to total unemployment, asan input into the TD LMI (Chart 4).Variables negatively correlated with the TD LMIo Private payroll employment – During good times, privatesector employment (measured here as a share of thelabour force) should be leading employment growth, aswas the case coming out of the 2008-09 recession. Assuch, we would assume that private payroll employmentwould be a good indicator of the state of the Canadianlabour market. That said, at 60.1% in September 2014,private-sector employees as a share of the labour forceremains well below the pre-recession peak of 61.7%reached in October 2006 and has remained broadlyunchanged since September 2013. This suggests someweakness in private-sector hiring has persisted followingits initial strength in the early part of the recovery.o Government payroll employment – Much like theself-employed, the share of government employees inthe labour force tends to rise during periods of labourmarket weakness. However, unlike self-employment,this is because the public sector is less likely to reduceits workforce and may indeed even expand its workforceduring this period along with increased governmentspending. This pattern is clear from the data, as the shareof government employees in the labour force rose from18.4% to 19.2% from early-2009 to early-2011, and hasremained broadly unchanged since.%CHART 4: LONG-TERM UNEMPLOYED LOOK TOBE EXHAUSTING EI BENEFITS55%25205015451040Recession (Oct 2008 to June 2009)5Benefits-to-unemployed ratio (LHS)Long-term unemployment share an2010Jan2012Jan20140Sources: Statistics Canada, TD Economics.Note:All non-seasonally adjusted series were seasonally adjusted usingCensus X12.3
TD Economics www.td.com/economicso Temporary workers – Much like Canadians that workpart time, there are many Canadians that are employedon a temporary basis (measured here as a share of thelabour force) that would prefer to have a permanentposition. However, unlike self-employment, temporaryemployment tends to follow movements in the broadereconomy, increasing when the economy is doing well andfalling otherwise. According to this measure, Canadiansemployed on a temporary basis have increased to 10.5%of the labour force, on average, from July 2009 toSeptember 2014, as compared to 10.1% over a similarperiod prior to the recession (Chart 3). However, bothof these levels are more elevated than the recessionarytrough of 9.3% reached in March 2009.Over history, the TD LMI has tracked the headlineunemployment rate closely. The TD LMI has tended to beless volatile than the unemployment rate, posting less pronounced improvement during good times and the converseduring bad times. That said, beginning in early 2013, the TDLMI began to diverge from the unemployment rate. Specifically, the TD LMI has been gradually trending up to 7.2% inSeptember 2014 while the official unemployment rate hasedged down, reaching a low of 6.8% in the same month. TheTD LMI therefore suggests that labour market conditionsworsened slightly over the past two years, while the unemployment rate has suggested that they had improved. Theresulting spread between these two measures is currentlythe widest it has been since the 2008-09 recession (Chart 5).To explain this divergence, Chart 6 illustrates the correlation between the TD LMI with each of the 14 variablesCHART 5: TD LMI POINTS TO GREATER LABOURMARKET WEAKNESSpercentagepoints0.4TD LMI less unemployment rate0.30.20.10.0Apr 2013Jul 2013Oct 2013Jan 2014Sources: TD Economics, Statistics Canada.October 23, 2014Apr 2014Labour underutilization rateUnemployment rateInvoluntary part-timeLong-term unemploymentSelf-employedSeparation rateEI beneficiariesAverage weekly hoursPublic employeesTemporary employmentParticipation rate (prime-age)Job-finding rateWage growthPrivate employees-1.0-0.50.00.51.0Sources: TD Economics, Statistics Canada.Source:The LMI points to labour market weakness-0.1Jan 2013CHART 6: WEAK LABOUR MARKET VARIABLESHIGHLY CORRELATED WITH THE TD LMIJul 2014used to construct it. Specifically, it is those variables thatare most highly correlated with the TD LMI that havegenerally shown the most weakness since the beginning of2013. These include the long-term unemployment, labourunderutilization rate, and involuntary part-time employment,all of which have either increased or remained es
Market Indicator (LMI) with the aim to synthesize 14 labour market variables into a single indicator. While this measure is . remains well below the pre-recession peak of 61.7% reached in October 2006 and has remained broadly unchanged since September 2013. This suggests some weakness in private-sector hiring has persisted following its initial strength in the early part of the recovery. o .