Transcription
On Our Portfolio12 October 2016On Our PortfolioHolding Our BreathBy the Kenanga Research Team l research@kenanga.com.myWhile oil prices continue to be the leading indication for the benchmark index, theupcoming Budget 2017 could provide some hints to the overall local market direction inOctober. On the macro scene, the upcoming US Presidential Election is a proverbial wildcard and could push volatility higher should the outcome is less than favourable to theglobal economy. “Buy-on-Weakness” trading strategy remains our preferred strategy fornow with an ideal buying zone set at 1,625 and below as well as a “Sell on Strength” atabove 1,715 level. Portfolio-performance-wise, our THEMATIC and GROWTH portfoliosmanaged to outpace the benchmark index in September while DIVIDEND YIELD portfoliosuffered a loss, in tandem with the broader market performance.All eyes on Budget 2017. While the local stock market trading sentiment is stilldictated by crude oil price and forex movements, a fresh focus is on theupcoming Budget 2017 presentation with hopes of economic stimulus to upliftthe market. A little further down the road, the US Presidential Election outcomewould further determine its foreign economic policies which shape thelandscape of the global economy. While all this is still up in the air, we continueto advocate our “Buy-on-Weakness” trading strategy with an ideal buying zoneat 1,625 and below as well as a “Sell on Strength” level at above 1,715. Despitewe expect the net FBMKLCI’s earnings growth rate to improve by 1.6%/7.2% forFY16E/FY17E (due to the lower base effect), there is room for earningsdowngrade (espectially in the Oil & Gas, Plantations as well as Property sectors) as a broad-based earnings growth story isstill missing.Oil prices at play again. The rise in oil prices at the beginning of the month reignited some bullish spirit in the FBMKLCI,However, in less than two weeks, the Ringgit’s weakness against the USD expanded and correction in oil prices suppressedthe growing sentiment. At the end of September, the FBMKLCI fell 25.51 pts or -1.52% to close at 1652.55, with 20 out of 30of the index component stocks showing declines. The top three index leaders for the month were YTL ( 6.55%), GENM( 2.48%) and KLK ( 1.70%) while the laggers came from ASTRO (-7.46%), RHBBANK (-7.00%) and AMBANK (-6.83%). AtWall Street, stocks also appeared to slump in line with the declining oil prices towards the second week. The bears, however,started losing impetus following the favourable outcome from US FOMC meeting which send the DOW to its strongestquarter-ending performance of the year.Portfolios are more resilient against benchmark. Although the benchmark index suffered some degree of correctiontowards the end of the month, our THEMATIC and DIVIDEND YIELD Portfolios were on stronger foothold against the marketpressures to outperform the benchmark index. While the FBMKLCI index declined by 1.08% MoM and sent the YTD return to0.04%, our THEMATIC portfolio managed to climb 2.50% MoM with a positive YTD gain of 0.51%, thanks to a betterperformance of PESTECH ( 8.50%) as a result of positive projects news flow. Meanwhile, our DIVIDEND YIELD Portfolioslumped by 2.04% MoM due to the overall decline in stocks but was still able to outpace the benchmark index with a 4.07%return YTD. The GROWTH portfolio, on the other hand, inched higher by 1.8% MoM in September, narrowing the YTD lossto 0.29%.Total Return (%)MoMYTDFBMKLCIThematicGrowthDividend .51-0.294.07Key economic events to watchChina CPI YoYUS CPI YoYChina Industrial Production YoYEUR PPI Industrial 4%-2.7%Page 1 of 7
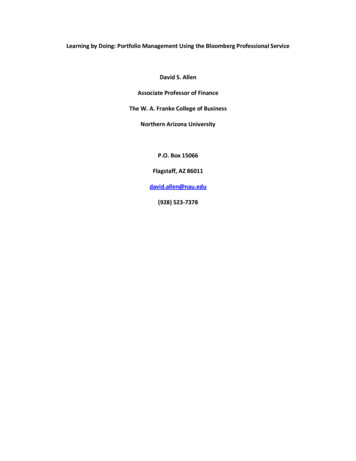
On Our Portfolio12 October 2016Retail Model Portfolio - THEMATICNoCATSCodeCompanyLast Buy/SellDateRMSharePrice@30 Sep2016RM1252195347PESTECH INTERNATIONAL BHDTENAGA NASIONAL 320172WAAPOLLO FOOD HOLDINGS BHDOCK .7800.1805.9300.22017,79011,0004502,00080,300No. ofSharesAverage CostRMAvgCost/Share75,985ValueUnrealisedProfit /(Loss)RMRMTotal Dividend Received YTDTotal Realised ReturnTotal Return (based on the total allocated amount of RM100k)KLCIKLCI – TOTAL RETURNTotal Realised PositionNoCATS Code17113Total Dividends ReceivedNoCATS Code15219271133471135347FBMKLCI IndexCompanyTOP GLOVE CORP BHDCompanyPESTECH INTERNATIONAL BHDTOP GLOVE CORP BHDTOP GLOVE CORP BHDTENAGA NASIONAL ngeYTDWeighting(as % ofNAV)%%Consensus12M side1.263.060.04%Last Buy/Sell DateNo of SharesCost @AvgCost/ShareSharePrice @ValueRealised% .78%TOTAL REALISED POSITION-4,180No. of Shares2,5002,000Ex-Date26-Jan-1611-Jan-16Gross Div0.030.02Div 20.00150.00TOTAL DIVIDEND RECEIVED375.00Page 2 of 7
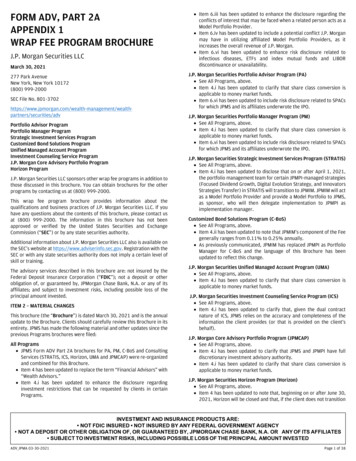
On Our Portfolio12 October 2016Retail Model Portfolio - GROWTHNo.CATSCodeIndustry / Company15219PESTECH INTERNATIONAL BHD25347TENAGA NASIONAL BHD30089TEX CYCLE TECHNOLOGY4564320172WAAPOLLO FOOD HOLDINGS BHDOCK GROUP-CW20LastBuy/SellDateNo. 0 Profit 4.18%5.7800.18084,180Total Dividend Received YTD-4,180Total Return (based on the total allocated amount of RM100k)4,470-0.29%-39.96-2.36%0.04%Total Realised PositionNoCATS Code7113Total Dividends ReceivedNoCATS Code1521927113GrossDivConsensus12M 1.35410Total Realised ReturnKLCIKLCI – TOTAL RETURN1Weighting(as % ofNAV)FBMKLCI IndexCompanyTOP GLOVE CORP BHDCompanyPESTECH INTERNATIONAL BHDTOP GLOVE CORP BHD3471135347TOP GLOVE CORP BHDTENAGA NASIONAL BHD55347TEX CYCLE TECHNOLOGY1,692.511,652.55Last Buy/Sell DateNo of Shares16-Jun-162,0003.06Cost @13,580AvgCost/Share6.790SharePrice @4.700ValueRealised% Change9,400-4,180-30.78%TOTAL REALISED POSITION-4,180No. of Shares2,0002,000Ex-Date26-Jan-1611-Jan-16Gross Div0.030.02Div 20.00150.0010,0001-Jun-160.0150.00TOTAL DIVIDEND RECEIVEDPP7004/02/2013(031762)410.00Page 3 of 7
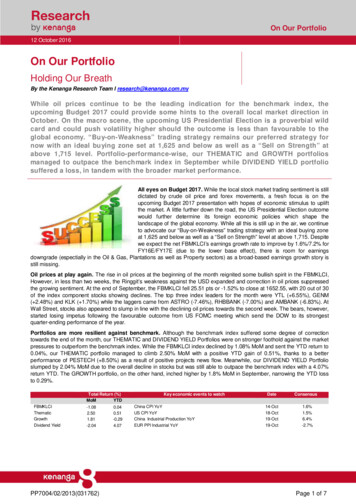
On Our Portfolio12 October 2016Retail Model Portfolio - DIVIDEND YIELDNo. 50SharePrice@30 ,00017,3405.780LastBuy/SellDateNoCATSCodeIndustry / Company11562BERJAYA SPORTS TOTO BHD31-Dec-1525347TENAGA NASIONAL BHD36432APOLLO FOOD HOLDINGS BHD52,570ValueUnrealisedProfit 3%12/8/201655,7903,2206.13%52.6%Consensus12M N.A.2.008500Total Return (based on the total allocated amount of RM100k)KLCIFBMKLCI Index1,692.511,652.554,0704.07%-39.96-2.36%KLCI – TOTAL RETURN53471562LatestDividendEx-DateRM1,300Total Realised Return34Weighting(as % ofNAV)RM16,550Total Dividend Received YTDTotal Dividends ReceivedNoCATS Code1156221562%Chg.YTD3.060.04%CompanyBERJAYA SPORTS TOTO BHDBERJAYA SPORTS TOTO BHDNo. of Shares5,0005,000Ex-Date18-Jan-1611-Apr-16Gross Div0.050.04Div Rec250.00200.00TENAGA NASIONAL BHDBERJAYA SPORTS TOTO 0TOTAL DIVIDEND RECEIVEDPP7004/02/2013(031762)850.00Page 4 of 7
On Our Portfolio12 October 2016Portfolios Total Return 2013 (based on the total allocated amount) vs FBMKLCI PerformanceSource: Bloomberg, Kenanga ResearchPortfolios Total Return 2014 (based on the total allocated amount) vs FBMKLCI PerformanceSource: Bloomberg, Kenanga ResearchPortfolios Total Return 2015 (based on the total allocated amount) vs FBMKLCI PerformanceSource: Bloomberg, Kenanga ResearchPP7004/02/2013(031762)Page 5 of 7
On Our Portfolio12 October 2016Daily Charting: FBMKLCIWeekly Charting: FBMKLCIDaily Charting: FBM70Weekly Charting: FBM70Daily Charting: FBMSCWeekly Charting: FBMSCDaily Charting: DJIAWeekly Charting: DJIASource: BloombergPP7004/02/2013(031762)Page 6 of 7
On Our Portfolio12 October 2016Stock Ratings are defined as follows:Stock RecommendationsOUTPERFORMMARKET PERFORMUNDERPERFORM: A particular stock’s Expected Total Return is MORE than 10% (an approximation to the5-year annualised Total Return of FBMKLCI of 10.2%).: A particular stock’s Expected Total Return is WITHIN the range of 3% to 10%.: A particular stock’s Expected Total Return is LESS than 3% (an approximation to the12-month Fixed Deposit Rate of 3.15% as a proxy to Risk-Free Rate).Sector Recommendations***OVERWEIGHTNEUTRALUNDERWEIGHT: A particular sector’s Expected Total Return is MORE than 10% (an approximation to the5-year annualised Total Return of FBMKLCI of 10.2%).: A particular sector’s Expected Total Return is WITHIN the range of 3% to 10%.: A particular sector’s Expected Total Return is LESS than 3% (an approximation to the12-month Fixed Deposit Rate of 3.15% as a proxy to Risk-Free Rate).***Sector recommendations are defined based on market capitalisation weighted average expected totalreturn for stocks under our coverage.This document has been prepared for general circulation based on information obtained from sources believed to be reliable but we do notmake any representations as to its accuracy or completeness. Any recommendation contained in this document does not have regard tothe specific investment objectives, financial situation and the particular needs of any specific person who may read this document. Thisdocument is for the information of addressees only and is not to be taken in substitution for the exercise of judgement by addressees.Kenanga Investment Bank Berhad accepts no liability whatsoever for any direct or consequential loss arising from any use of this documentor any solicitations of an offer to buy or sell any securities. Kenanga Investment Bank Berhad and its associates, their directors, and/oremployees may have positions in, and may effect transactions in securities mentioned herein from time to time in the open market orotherwise, and may receive brokerage fees or act as principal or agent in dealings with respect to these companies.Published and printed by:KENANGA INVESTMENT BANK BERHAD (15678-H)8th Floor, Kenanga International, Jalan Sultan Ismail, 50250 Kuala Lumpur, MalaysiaTelephone: (603) 2166 6822 Facsimile: (603) 2166 6823 Website: www.kenanga.com.myPP7004/02/2013(031762)Chan Ken YewHead of ResearchPage 7 of 7
dictated by crude oil price and forex movements, a fresh focus is on the upcoming Budget 2017 presentation with hopes of economic stimulus to uplift the market. . ( 1.70%) while the laggers came from ASTRO (-7.46%), RHBBANK (-7.00%) and AMBANK (-6.83%). At Wall Street, stocks also appeared to slump in line with the declining oil prices .