Transcription
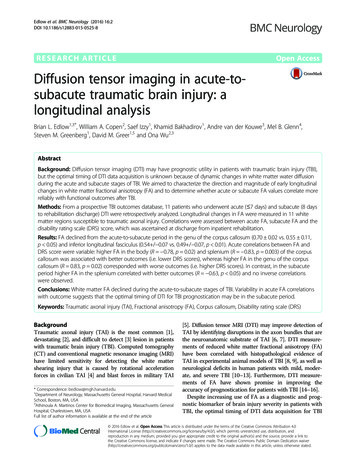
Edlow et al. BMC Neurology (2016) 16:2DOI 10.1186/s12883-015-0525-8RESEARCH ARTICLEOpen AccessDiffusion tensor imaging in acute-tosubacute traumatic brain injury: alongitudinal analysisBrian L. Edlow1,3*, William A. Copen2, Saef Izzy1, Khamid Bakhadirov1, Andre van der Kouwe3, Mel B. Glenn4,Steven M. Greenberg1, David M. Greer1,5 and Ona Wu2,3AbstractBackground: Diffusion tensor imaging (DTI) may have prognostic utility in patients with traumatic brain injury (TBI),but the optimal timing of DTI data acquisition is unknown because of dynamic changes in white matter water diffusionduring the acute and subacute stages of TBI. We aimed to characterize the direction and magnitude of early longitudinalchanges in white matter fractional anisotropy (FA) and to determine whether acute or subacute FA values correlate morereliably with functional outcomes after TBI.Methods: From a prospective TBI outcomes database, 11 patients who underwent acute ( 7 days) and subacute (8 daysto rehabilitation discharge) DTI were retrospectively analyzed. Longitudinal changes in FA were measured in 11 whitematter regions susceptible to traumatic axonal injury. Correlations were assessed between acute FA, subacute FA and thedisability rating scale (DRS) score, which was ascertained at discharge from inpatient rehabilitation.Results: FA declined from the acute-to-subacute period in the genu of the corpus callosum (0.70 0.02 vs. 0.55 0.11,p 0.05) and inferior longitudinal fasciculus (0.54 / 0.07 vs. 0.49 / 0.07, p 0.01). Acute correlations between FA andDRS score were variable: higher FA in the body (R 0.78, p 0.02) and splenium (R 0.83, p 0.003) of the corpuscallosum was associated with better outcomes (i.e. lower DRS scores), whereas higher FA in the genu of the corpuscallosum (R 0.83, p 0.02) corresponded with worse outcomes (i.e. higher DRS scores). In contrast, in the subacuteperiod higher FA in the splenium correlated with better outcomes (R 0.63, p 0.05) and no inverse correlationswere observed.Conclusions: White matter FA declined during the acute-to-subacute stages of TBI. Variability in acute FA correlationswith outcome suggests that the optimal timing of DTI for TBI prognostication may be in the subacute period.Keywords: Traumatic axonal injury (TAI), Fractional anisotropy (FA), Corpus callosum, Disability rating scale (DRS)BackgroundTraumatic axonal injury (TAI) is the most common [1],devastating [2], and difficult to detect [3] lesion in patientswith traumatic brain injury (TBI). Computed tomography(CT) and conventional magnetic resonance imaging (MRI)have limited sensitivity for detecting the white mattershearing injury that is caused by rotational accelerationforces in civilian TAI [4] and blast forces in military TAI* Correspondence: bedlow@mgh.harvard.edu1Department of Neurology, Massachusetts General Hospital, Harvard MedicalSchool, Boston, MA, USA3Athinoula A. Martinos Center for Biomedical Imaging, Massachusetts GeneralHospital, Charlestown, MA, USAFull list of author information is available at the end of the article[5]. Diffusion tensor MRI (DTI) may improve detection ofTAI by identifying disruptions in the axon bundles that arethe neuroanatomic substrate of TAI [6, 7]. DTI measurements of reduced white matter fractional anisotropy (FA)have been correlated with histopathological evidence ofTAI in experimental animal models of TBI [8, 9], as well asneurological deficits in human patients with mild, moderate, and severe TBI [10–13]. Furthermore, DTI measurements of FA have shown promise in improving theaccuracy of prognostication for patients with TBI [14–16].Despite increasing use of FA as a diagnostic and prognostic biomarker of brain injury severity in patients withTBI, the optimal timing of DTI data acquisition for TBI 2016 Edlow et al. Open Access This article is distributed under the terms of the Creative Commons Attribution 4.0International License (http://creativecommons.org/licenses/by/4.0/), which permits unrestricted use, distribution, andreproduction in any medium, provided you give appropriate credit to the original author(s) and the source, provide a link tothe Creative Commons license, and indicate if changes were made. The Creative Commons Public Domain Dedication o/1.0/) applies to the data made available in this article, unless otherwise stated.
Edlow et al. BMC Neurology (2016) 16:2outcome prediction has yet to be determined. In the subacute [11, 16–18] and chronic [10, 11, 19–21] stages ofTBI, low white matter FA consistently correlates with pooroutcomes, as determined by the Glasgow Outcome Scalescore [11, 17, 18, 20] or neurocognitive tests [10, 19, 21].However, in the acute stage of TBI, white matter FA mayincrease or decrease due to the heterogeneous effects ofintracellular and extracellular edema on local water diffusion [22, 23]. Accordingly, there are conflicting data onthe relationship between acute FA and functional outcomes: acute increases in FA [24, 25] and acute decreasesin FA [12, 13] may both be associated with poor outcome.Clarification of the time course of FA changes in theacute-to-subacute stages of TBI is therefore critical forunderstanding the pathophysiology of TAI, as well as fordetermining the optimal timing of DTI for TBI outcomeprediction. The purpose of this study is to investigatelongitudinal FA changes in a population of patients withcomplicated mild (Glasgow Coma Scale [GCS] score 13–15 with abnormal CT), moderate (GCS 9–12), and severe(GCS 3–8) TBI who underwent DTI scans during boththe acute and subacute stages of injury. We hypothesizedthat white matter FA declines between the acute andsubacute periods and that subacute FA correlates withfunctional outcome more consistently than does acute FA.Page 2 of 11acute TBI at Massachusetts General Hospital, where DTIwas routinely performed.All local TBIMS database enrollees who underwent anacute (day 1–7) and a subacute (day 8 to RH discharge)DTI scan were eligible for inclusion in this study. Ourdefinition of the acute and subacute time periods wasbased on prior TBI imaging studies [13, 25, 27]. Of the 350subjects in our local TBIMS database, 146 were treated foracute TBI at our hospital from 2003 to 2007, which is theperiod during which DTI was routinely performed with allclinical MRI scans. Thirteen of these 146 patients underwent both an acute and a subacute DTI scan. All DTIscans were evaluated by a neuroradiologist for data quality,and clinical records were reviewed to identify neurologicevents that could confound DTI measurements of FA.Two patients were excluded because of infarcts diagnosedin close temporal proximity to their TBIs.All MRIs were performed at the discretion of the treatingclinicians. The 11 acute MRI scans were ordered to diagnose intracranial pathology relating to the TBI. The 11 subacute MRI scans were ordered for prognostication (n 4),suspected intracranial or subgaleal infection (n 5), changein mental status (n 1), and left arm weakness (n 1). Nonew parenchymal lesions were identified on the subacutescans. One of the 11 patients did not have a DRS scoreassessed at the time of RH discharge.MethodsParticipantsImage acquisition and processingThree-hundred fifty subjects were retrospectively identifiedfrom a single center’s prospective contribution to the TBIModel Systems National Database (TBIMS ND) from 1999to 2007. The TBIMS ND is a multicenter, longitudinal TBIstudy funded by the U.S. National Institute on Disabilityand Rehabilitation Research. TBIMS ND enrollees were16 years or older, received TBI care in a TBIMS-affiliatedhospital within 24 h of injury, and were transferred directlyfrom acute care to an affiliated inpatient rehabilitationhospital (RH). Patients enrolled in the TBIMS ND studyunderwent a Disability Rating Scale (DRS) assessment thatwas performed by a certified examiner on the day of RHdischarge. The DRS score incorporates assessments ofarousal and awareness, ability to perform self-care, level ofphysical dependence, and psychosocial capacity for workor school [26]. Total DRS score ranges from 0 (no disability) to 29 (vegetative state). All study procedures wereapproved by the Spaulding Rehabilitation Hospital Institutional Review Board. Written informed consent was obtained from all study participants or next-of-kin surrogatedecision-makers if study participants were deemed unableto provide consent. A separate research protocol was approved by the Massachusetts General Hospital InstitutionalReview Board for a retrospective review of clinical recordsand DTI scans of patients enrolled in the SpauldingRehabilitation Hospital database who were treated forThe 22 patient MRI scans analyzed in this study were obtained on multiple 1.5 Tesla scanners (General ElectricMedical Systems, Waukesha, WI), which were upgradedseveral times at our institution over the 4-year studyperiod. The DTI sequence was either a single-shot, spinecho echo-planar imaging (SE-EPI) sequence (n 10) or atwice refocused SE-EPI sequence [28] (n 12). Otheracquisition parameters are shown in Table 1. For nine patients (patients 1–9), 6 diffusion-encoding directions wereused for both the acute and subacute DTI scans. For twopatients (patients 10 and 11), the acute DTI scan utilized 6diffusion-encoding directions repeated three times,whereas the subacute DTI scan utilized 25 directions. AllDTI data were eddy-current corrected to minimize motion artifact and post-processed using techniques previously described [29].Region of interest (ROI) analysesROIs were manually traced on the b0 images by an investigator blinded to the clinical data using Analyze 10.0image display software (Mayo Clinic Biomedical ImagingResource, Rochester, Minnesota, USA). Confirmation ofROI neuroanatomic localization was performed by aboard-certified neuroradiologist, after which the meanand standard deviation values for FA and the apparentdiffusion coefficient (ADC) were measured in each ROI.
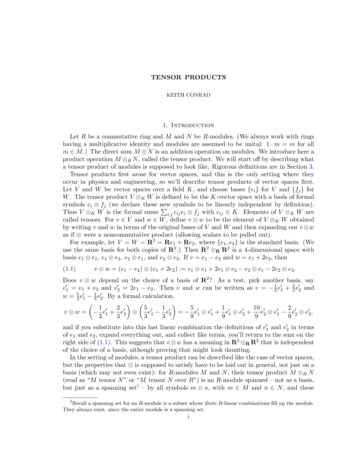
Edlow et al. BMC Neurology (2016) 16:2Page 3 of 11Table 1 DTI data acquisition parameters (n 11 TBI patients, n 22 DTI scans)Slice thickness Inter-slice MatrixID Post-TBIFieldFOV b value # Directions # b0 NEX TR (msec) TE (msec) In-planeresolution (mm) (mm)gap (mm)scan days strength (mm) (s/mm2)15141.5 T2201000613750099.21.72 1.7261128 128221.5 T2201000613750099.21.72 1.725.51128 128131.5 T2201000613750072.91.72 1.7251128 128311.5 T2201000613750099.31.72 1.7251128 128291.5 T2201000613750072.91.72 1.7251128 128411.5 T2201000613750099.31.72 1.7251128 128191.5 T2201000613750099.31.72 1.7251128 128521.5 T2201000615500088.90.86 0.8651128 128a971.5 T2201000615500095.70.86 0.8651128 128a21.5 T2201000613750099.21.72 1.7251128 128111.5 T2201000615500099.40.86 0.8651128 128a51.5 T2201000615500088.90.86 0.8651128 128a171.5 T2201000615500088.90.86 0.8651128 128a21.5 T2201000615500091.90.86 0.8651128 128a321.5 T2601000615700091.31.02 1.0251128 128a71.5 T2201000615500096.90.86 0.8651128 128a151.5 T2201000615500091.90.86 0.8651128 128a1.5 T2201000615500091.90.86 0.8651128 128a1.5 T22010002531500078.80.86 0.8651128 128a1.5 T2201000613750099.31.72 1.7251128 12822010002531500085.30.86 0.8651128 128a678910 21911 5381.5 T1.5 T2201000613750099.31.72 1.7251128 128Abbreviations: b0 b 0 s/mm , FOV field of view, NEX number of excitations (i.e. number of averages), T Tesla, TBI traumatic brain injury, TE echo time, TR repetition time,# number of. aAcquisition matrix was 128 x 128, zero-filled to 256 2562All ROIs were elliptical, and ROI dimensions were keptconstant for bilateral ROIs and for each ROI acrosssubjects.Eleven white matter ROIs were selected for analysis ofFA and ADC (Fig. 1): genu of the corpus callosum (CC),body of the CC, splenium of the CC, posterior limb ofthe internal capsule, uncinate fasciculus, anterior coronaradiata, centrum semiovale, cingulum bundle, inferiorlongitudinal fasciculus, cerebral peduncle, and dorsolateral midbrain. All ROIs were chosen on the basis ofprior studies demonstrating an association between FAand functional or cognitive outcomes in TBI [10–13,17–19, 24], except for the dorsolateral midbrain ROI,which was chosen on the basis of data demonstratingdiffusivity changes in the brainstem tegmentum in patients with traumatic disorders of consciousness [30, 31].The putamen and CSF were included as internal controlROIs, since FA in these regions should not be affectedby TAI [11, 13].Statistical analysesStatistical analyses were performed using R version2.11.1. Since TAI may cause asymmetric white matterinjury [32, 33], FA and ADC values in bilateral ROIs werecompared using a two-tailed Wilcoxon signed-rank test. Ifa contusion or susceptibility artifact from intracranialhardware overlapped with an ROI, the ROI was excludedfrom analysis. When the excluded ROI was a midlinestructure (i.e. genu, body or splenium of the CC), the ROIwas excluded from all longitudinal and correlationanalyses for that subject. When one side (left or right) of abilateral ROI was excluded at a single time point, only thediffusion measurements from the contralateral side wereused in the longitudinal and outcome correlation analyses.No laterality effect on FA or ADC was identified (p 0.05for all bilateral ROIs); thus, left- and right-sided valueswere averaged.Differences in acute and subacute FA and ADC weretested using a two-tailed paired Wilcoxon signed-ranktest. To determine if variability in the timing of DTI dataacquisition modulated any statistically significant longitudinal FA changes, we tested for correlations between thenumber of days between the acute and subacute DTIscans and the change in FA using a two-tailed Spearmancorrelation test. Correlations between acute FA, subacuteFA, and DRS were assessed for each white matter ROI
Edlow et al. BMC Neurology (2016) 16:2Page 4 of 11Fig. 1 Neuroanatomic localization of regions of interest on b0 images. a Dorsolateral midbrain (blue), cerebral peduncle (maroon), and inferiorlongitudinal fasciculus (turquoise); b uncinate fasciculus (green); c genu of corpus callosum (yellow), posterior limb of the internal capsule (red), andputamen (pink); d splenium of the corpus callosum (yellow) and cerebrospinal fluid (purple); e anterior corona radiata (turquoise) and body of thecorpus callosum (yellow); f cingulum bundle (pink) and centrum semiovale (blue)using a two-tailed Spearman correlation test. Intraraterand interrater reliability of FA measurements were testedusing the intraclass correlation coefficient for the ROIsthat demonstrated significant longitudinal changes or correlations with outcome in the patient cohort. Raters weretreated as a random factor. For the intrarater analysis,ROIs were placed by the same rater at least 4 weeks apart.For the interrater analysis, we calculated intraclass correlation coefficients for all 22 DTI scans, the 11 acute DTIscans, and the 11 subacute DTI scans. The latter two analyses were performed to determine whether the timing ofDTI data acquisition affected the reproducibility of the FAmeasurements. We also used the two-tailed Spearman’scorrelation coefficient to test whether correlations between regional FA and DRS persisted when FA was measured by ROIs drawn by the second rater.Healthy control DTI dataSince DTI data in our retrospective patient cohort wereobtained with variable hardware (i.e. different MRIscanners) and software (i.e. different DTI sequence), weconsidered the possibility that this variability may haveconfounded our longitudinal measurements of changes inFA [34]. Some investigators have proposed acquiring control DTI data using the same scanner and sequence usedfor the patient cohort and then normalizing patient FA tocontrol FA for each ROI [14], but no such control datasetwas available for our retrospective patient cohort. Wetherefore prospectively acquired DTI data in a healthycontrol subject to measure the repeatability and variabilityof regional FA measurements. The control subject was ahealthy man who underwent six DTI scans on a 1.5 TeslaSiemens MRI scanner and three DTI scans on threedifferent 3 Tesla Siemens MRI scanners (Siemens MedicalSolutions, Erlangen, Germany) over a period of 6 years(age 30 to 36). The healthy volunteer provided writteninformed consent in accordance with a research protocolapproved by the Massachusetts General Hospital Institutional Review Board.The six DTI scans on the single 1.5 Tesla SiemensMRI scanner were performed during three separatescanning sessions over a 2 h period (the subject wasremoved from the scanner inbetween scans). The threeDTI scans on the 3 Tesla MRI scanners were performed on different days. The parameters of interest inall nine control DTI scans were varied to either matchor fall within the range of the number of diffusionencoding directions and spatial resolution (voxel size)of the DTI parameters used in the patient cohort (seeTable 2). All other parameters (e.g. repetition time,echo time, etc.) were matched as closely as possibleto those of the patient DTI scans. To reduce thenumber of statistical comparisons, we performed FAanalyses in the control DTI scans only in the ROIsthat demonstrated significant longitudinal changes orcorrelations with outcome in the patient cohort. We
Edlow et al. BMC Neurology (2016) 16:2Page 5 of 11Table 2 Healthy control DTI data acquisition parameters (n 1 subject, n 9 DTI scans)ScanningsessionDTIscan #FieldstrengthFOV(mm)b value(s/mm2)# Directions# b0NEXTR (msec)TE r-slicegap (mm)Matrix113T25670012258000842.0 2.051.0128 128223T220100025314800911.4 1.451.0160 160333T2201000253353001081.4 1.451.0160 160441.5 T22010006135000881.72 1.725.01.0128 128551.5 T22010006135000881.72 1.725.01.0128 12861.5 T22010006135000881.72 1.725.01.0128 12871.5 T22010006135000881.72 1.725.01.0128 12881.5 T22010006139400882.0 2.02.00110 11091.5 T220100025315000881.72 1.725.01.0128 1286The control subject’s first three DTI scans were performed on three different 3 Telsa MRI scanners on different days, whereas the next six DTI scans wereperformed on a 1.5 Tesla MRI scanner on a single day during three separate scanning sessions over a 2-hour period. Abbreviations: b0 b 0 s/mm2, FOV field ofview, NEX number of excitations (i.e. number of averages), T Tesla, TE echo time, TR repetition time, # number ofcalculated the coefficient of variation (CV standarddeviation/mean) and reproducibility coefficient (RDC 2.77*standard deviation), both measures of precision forimaging biomarkers [35]. We then compared FA variability in the control subject with longitudinal FAchanges in the TBI patients to determine if the meandifference of the patients’ longitudinal FA changesexceeded the expected FA RDC (the 95 % precisionlimit) for each region.ResultsParticipant demographics and clinical characteristicsDemographic and clinical data are summarized in Table 3.The patient cohort was comprised of eight men and threewomen. Mean (SD) age was 36.2 (19.7) years, with a rangeof 16 to 77 years. All patients had at least one contusionon the admission head CT scan, and ten of the 11 patientsunderwent one or more neurosurgical intervention:intracranial bolt placement, hemicraniectomy, or externalTable 3 Demographic and clinical informationPatient ID GCSMechanism CT ClassificationIMPACT Score Neurosurgery(favorable)AcuteDTI daySubacuteDTI dayDRS score RH D/C day110MVADiffuse injury IV63 %bolt5142.56326MVADiffuse injury II62 %bolt21311241313fallEvacuated mass lesion 68 %bolt, crani12945347MVADiffuse injury II83 %none1193.54556MVADiffuse injury III62 %bolt2974.512266MVADiffuse injury II88 %EVD2114.510275MVAEvacuated mass lesion 45 %crani, bolt, EVD 5175.5363814FallEvacuated mass lesion 61 %EVD232–6697MVADiffuse injury IIIEVD715131103MVAEvacuated mass lesion 67 %crani, bolt219231781115fallDiffuse injury II44 %crani5388.5108Summary7 (3–15) 8 MVA4 diffuse II66.0 13.5 %6 bolt3.1 / 1.9 27.6 / 23.4 4.5 (1–23)3 Fall81 %2 diffuse III4 EVD1 diffuse IV4 crani4 evacuated mass1 none124.7 / 96.0Summary data in the bottom row are provided as mean / standard deviation except for GCS and DRS scores, which are reported as median (range). Abbreviations: cranihemicraniectomy, DTI diffusion tensor imaging, EVD external ventricular drain, DRS disability rating scale, GCS admission Glasgow Coma Scale score, MVA motor vehicleaccident, RH rehabilitation hospital, TBI traumatic brain injury. The IMPACT score is reported for the complete IMPACT model (core CT lab data elements), based uponclinical, imaging, and laboratory data recorded at the time of admission. Scores were calculated using the online IMPACT prognostic calculator (http://www.tbi-impact.org/?p impact/calc). Of note, we report the IMPACT model’s predicted probability of a favorable outcome at 6 months. Subject 8 did not have DRS data recorded ( ) at thetime of RH discharge
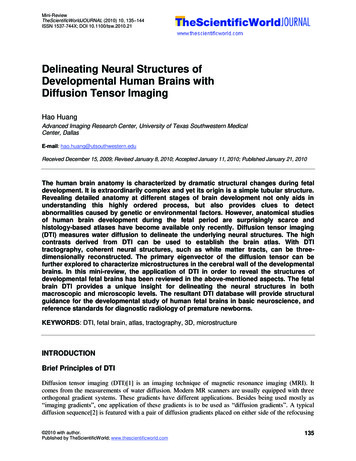
Edlow et al. BMC Neurology (2016) 16:2ventricular drain placement. One patient had a unilateralnon-reactive pupil on admission (patient 7). None had aspinal cord injury. The acute DTI scan was performed on[mean / SD] day 3.1 / 1.9, and the subacute DTI scanwas performed on day 27.6 / 23.4. Of note, FA andADC could not be measured from the following ROIs inat least one DTI scan, because of overlapping contusion orsusceptibility artifact from intracranial hardware: leftCP (n 1), right CP (n 1), left UF (n 7), and rightUF (n 8), left PL IC (n 1), right PL IC (n 1), leftACR (n 5), right ACR (n 11), genu of the CC (n 5),body of the CC (n 3), right CB (n 2), left CS (n 2),right CS (n 1), left putamen (n 1), and right putamen (n 6).Longitudinal DTI resultsFA declined from the acute to the subacute period in thegenu of the CC (acute FA [mean / SD] 0.70 / 0.02,subacute FA 0.55 / 0.11; p 0.02), inferior longitudinalfasciculus (acute FA 0.54 / 0.07, subacute FA 0.49 / 0.07; p 0.01) and cingulum bundle (acute FA 0.58 / 0.04, subacute FA 0.51 / 0.09; p 0.02). Thenumber of days between the acute and subacute DTI scanswas not associated with the change in FA for any of thesePage 6 of 11ROIs (p 0.42 to 0.99). Of note, longitudinal FA changesin the genu of the corpus callosum and the inferiorlongitudinal fasciculus remained statistically significantwhen the two patients with different acute and subacutediffusion-encoding directions were excluded from the analysis (patients 10 and 11; p 0.03 for both tests). However,the longitudinal FA change in the cingulum bundle wasno longer statistically significant when these two subjects were excluded (p 0.10). When the longitudinalFA change within the cingulum bundle was also reanalyzed without the two subjects for whom unilateralROIs were excluded due to contusions or susceptibilityartifacts, the acute-to-subacute FA change was nolonger statistically significant: acute FA 0.57 / 0.04,subacute FA 0.51 / 0.09, p 0.07. ADC increasedfrom the acute to the subacute period in the uncinatefasciculus (acute ADC 747 / 91 10 6 mm2/s,subacute ADC 889 / 64 10 6 mm2/s; p 0.008).Longitudinal FA and ADC data for all ROIs areprovided in Fig. 2. Figure 3 shows the results of a posthoc DTI tractography analysis that demonstrates thedifference between acute-to-subacute splenium FAchanges in a patient with good outcome (DRS 1) andin a patient with poor outcome (DRS 8.5).Fig. 2 Longitudinal changes in FA and ADC. a Acute and subacute FA measurements, and b acute and subacute ADC measurements for eachROI. All data are displayed as mean / SD. Acute time period is defined as post-trauma days 1–7. Subacute period is defined as post-traumaday 8 until discharge from rehabilitation hospital. Acute and subacute diffusion parameters were compared using a two-tailed paired Wilcoxonsigned-rank test. *p 0.05; **p 0.01. Of note, the longitudinal FA change in CB was within the 95 % precision limit for the healthy control’s FAmeasurements in this region. The acute CSF ADC value (2729 / 461 x 10 6 mm2/s) and the subacute CSF ADC value (3049 / 231 x 10 6 mm2/s) arenot shown in panel b because of the difference in scale between CSF ADC values and all other ADC values. Abbreviations: ACR, anterior corona radiata;CB, cingulum bundle; CP, cerebral peduncle; CS, centrum semiovale; CSF, cerebrospinal fluid; DL MB, dorsolateral midbrain; ILF, inferior longitudinalfasciculus; PL IC, posterior limb of internal capsule; UF, uncinate fasciculus
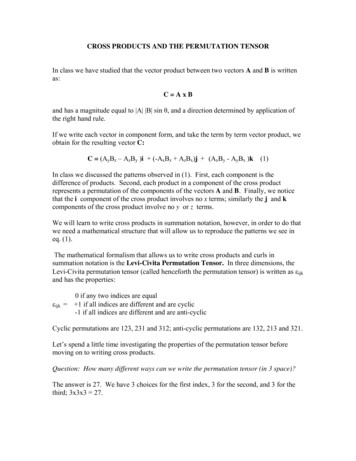
Edlow et al. BMC Neurology (2016) 16:2Page 7 of 11Fig. 3 Longitudinal changes in fiber tract FA in the splenium of the corpus callosum. Superior view of acute (a) and subacute (b) fiber tracts of thesplenium of the corpus callosum (CC) in a patient with good outcome (DRS 1). Fiber tracts are color-coded according to mean FA (center inset) sothat longitudinal splenium FA changes in each patient can be observed. Superior view of acute (c) and subacute (d) fiber tracts of the splenium of theCC in a patient with poor outcome (DRS 8.5). In the patient with good outcome, splenium FA values are high in both the acute andsubacute periods, as indicated by the red tract colors (solid arrows). In the subject with poor outcome, splenium FA values decline from the acute to thesubacute period, as indicated by the red tracts in the acute period as compared to yellow tracts in the subacute period (dotted arrows). All tracts werereconstructed using Diffusion Toolkit version 0.6.2 and virtually dissected by manually tracing a splenium ROI in TrackVis version 5.2 (Wang & Wedeen,Athinoula A. Martinos Center for Biomedical Imaging, www.trackvis.org). Fiber tracts from the fornix and optic radiations were excluded to isolate thesplenium fiber tracts. Tracts are superimposed on axial diffusion-weighted images at the level of the inferior aspect of the splenium of the CCIn the acute period, decreasing FA in the genu of the CCcorrelated with better outcome (lower score) on theDRS (R 0.83, p 0.02), whereas increasing FA in thebody of the CC (R 0.78, p 0.02) and splenium of theCC (R 0.83, p 0.003) correlated with better outcome. In the subacute period, increasing FA in the splenium of the CC correlated with better outcome on theDRS (R 0.63, p 0.049).subacute 0.88 (p 0.001)]. When correlations betweengenu, body, and splenium FA and DRS score wereretested using FA measurements generated by the second rater, we found similar correlations between DRSscore and acute splenium FA (R 0.63, p 0.05), aswell as between DRS score and subacute splenium FA(R 0.67, p 0.03). However, correlations betweenDRS score and acute FA in the body and genu of theCC were no longer significant (p 0.05).Intrarater and interrater reliability analysesComparison of patient and control DTI dataIn the intrarater reliability analysis for all 22 DTIscans, the intraclass correlation coefficients were:genu of the CC 0.96, body of the CC 0.96, splenium of the CC 0.97, cingulum bundle 0.93, andinferior longitudinal fasciculus 0.94 (p 0.001 for allanalyses). In the interrater reliability analysis, theintraclass correlation coefficients were: genu of the CC[all 0.93 (p 0.001); acute 0.53 (p 0.07); subacute 0.94 (p 0.001)], body of the CC [all 0.72 (p 0.001);acute 0.84 (p 0.001); subacute 0.60 (p 0.03)],splenium of the CC [all 0.93 (p 0.001); acute 0.92(p 0.002); subacute 0.93 (p 0.001)], cingulumbundle [all 0.96 (p 0.001); acute 0.92 (p 0.001);subacute 0.95 (p 0.001)], and inferior longitudinalfasciculus [all 0.88 (p 0.001); acute 0.85 (p 0.001);For the control subject’s regional FA measurements andtheir reproducibility, see Table 4. Our results are similar tothose previously reported by other studies involving tenhealthy controls [36, 37]. For the genu of the CC, body ofthe CC, splenium of the CC, and the ILF, the mean differences in the patients’ acute-to-subacute FA changes werelarger than the corresponding regional RDCs for the control dataset: 0.15 vs. 0.02, 0.08 vs. 0.06, 0.031 vs. 0.030, and0.06 vs. 0.05, respectively. However, for the cingulum bundle, the patients’ longitudinal FA changes were within thecontrol’s regional RDC: 0.07 vs. 0.09.Correlations between DTI and functional outcomeDiscussionThe main findings of this study are that white matter FAdeclined significantly between the acute and subacute
Edlow et al. BMC Neurology (2016) 16:2Page 8 of 11Table 4 Comparison of DTI measurements of FA in the control dataset (n 1 subject, n 9 DTI scans) and TBI dataset (n 22 TBIpatients, n 11 acute scans, n 11 subacute scans)Control DTI Scan #Genu CC FABody CC FASplenium CC FAILF FACB FASession 110.810.650.820.550.65Session 220.810.640.820.580.61Session 330.800.620.820.550.58Session 440.800.660.830.570.63Session 660.800.580.6980.790.700.830.610.649Session 60.800.650.820.570.61Control Mean SD0.80 / 0.010.65 / 0.020.82 / 0.010.57 / 0.020.63 / 0.03Control CV1.1 %3.4 %1.3 %3.2 %4.9 %Control RDC0.020.060.0300.050.09Patient Mean DifferenceAcute-to-Subacute FA [95 % CI] 0.15 [ 0.25, 0.04] 0.08 [ 0.20, 0.04] 0.031 [ 0.11, 0.05] 0.06 [ 0.10, 0.01] 0.07 [ 0.12, 0.02]Abbreviations: CB cingulum bundle, CC corpus callosum, CV coefficient of variation, FA fractional anisotropy, ILF inferior longitudinal fasciculus, RDC reproducibilitycoefficient. Note that for the splenium of the CC, the RDC value and the patient mean difference between acute and subacute FA are shown with three decimalplaces to demonstrate that the latter value was larger in magnitude than the formerstages of TBI, and subacute FA correlated more consistently with DRS than acute FA. While a longitudinal decline in FA has been previously observed between thesubacu
Review Board for a retrospective review of clinical records . echo echo-planar imaging (SE-EPI) sequence (n 10) or a twice refocused SE-EPI sequence [28] (n 12). Other acquisition parameters are shown in Table 1. For nine pa- . (Mayo Clinic Biomedical Imaging Resource, Rochester, Minnesota, USA). Confirmation of