Transcription
ContentsChapter 3Risk Assessment . 33.1 Exposure and Analysis of State Development Trends . 53.1.1. Growth . 53.1.2. Population . 53.1.3 Social Vulnerability. 243.1.4. Land Use and Development Trends . 273.1.5. Exposure of Built Environment/Cultural Resources . 353.2. Hazard Identification. 483.2a. Potential Climate Change Impacts on the 22 Identified Hazards in Kansas . 633.3. Hazard Profiles and State Risk Assessment . 653.3.1. Agricultural Infestation . 683.3.2. Civil Disorder . 873.3.3. Dam and Levee Failure. 933.3.4. Drought . 1523.3.5. Earthquake . 1763.3.6. Expansive Soils . 2033.3.7. Extreme Temperatures . 2073.3.8. Flood . 2263.3.9. Hailstorm . 2963.3.10. Hazardous Materials. 3183.3.11. Land Subsidence . 3423.3.12. Landslide . 3583.3.13. Lightning . 3643.3.14. Major Disease Outbreak . 3803.3.15. Radiological . 3973.3.16. Soil Erosion and Dust . 4033.3.17. Terrorism/Agri-Terrorism . 4093.3.18. Tornado . 4173.3.19. Utility/Infrastructure Failure. 4533.3.20. Wildfire . 4703.3.21. Windstorm . 486Kansas Hazard Mitigation Plan2018Final3-1
3.3.22. Winter Storm . 5093.4. Integration of Local Plans: Vulnerability and Loss Estimates . 5343.4.1. Overview and Analysis of Local Plan Vulnerability Assessments. 5343.4.2. Overview and Analysis of Local Plan Potential Loss Estimates . 5483.5. State Owned and Operated Facilities: Vulnerability and Loss Estimates . 5563.5.1. Agricultural Infestation . 5643.5.2. Civil Disorder . 5643.5.3. Dam and Levee Failure. 5663.5.4. Drought . 5683.5.5. Earthquake . 5683.5.6. Expansive Soils . 5723.5.7. Extreme Temperatures . 5723.5.8. Flood . 5723.5.9. Hailstorm . 5743.5.10. Hazardous Materials. 5753.5.11. Land Subsidence . 5783.5.12. Landslide . 5803.5.13. Lightning . 5823.5.14. Major Disease Outbreak . 5833.5.15. Radiological . 5833.5.16. Soil Erosion and Dust . 5853.5.17. Terrorism/Agri-terrorism . 5853.5.18. Tornado . 5853.5.19. Utility/Infrastructure Failure. 5863.5.20 Wildfire . 5863.5.21. Windstorm . 5873.5.22. Winter Storm . 5883.6. References . 590Kansas Hazard Mitigation Plan2018Final3-2
Chapter 3Risk AssessmentThe foundation of the Kansas Hazard Mitigation Plan is the statewide risk assessment. In orderto define effective mitigation actions to make Kansas more resilient to the impacts of futuredisasters, it is necessary to understand the hazards that threaten the state and how they disruptKansas communities. It is also necessary to understand how the communities are vulnerable tothe impacts of the identified hazards and the scope or extent of that vulnerability. This chapterdetails the risk assessment process conducted by the Kansas Hazard Mitigation Team (KHMT).Its purpose is to provide, on a statewide basis, an understanding of the risks posed by the hazardsthat threaten Kansas. This allows the KHMT to focus its planning efforts on the hazards thatpose the most risk to the people of Kansas, their property, and their communities.The Federal Emergency Management Agency (FEMA) defines risk assessment terminology asfollows: Hazard – a hazard is an act or phenomenon that has the potential to produce harm or otherundesirable consequences to a person or thing.Vulnerability – Vulnerability is susceptibility to physical injury, harm, damage or economicloss. It depends on an asset’s construction, contents and economic value of its functions.Exposure – Exposure describes the people, property, systems, or functions that could be lostto a hazard. Generally, exposure includes what lies in the area the hazard could affect.Risk – Risk depends on hazards, vulnerability, and exposure. It is the estimated impact thata hazard would have on people, services, facilities, and structures in a community. It refersto the likelihood of a hazard event resulting in an adverse condition that causes injury ordamage.The risk assessment in this 2018 plan update is to reflect recent events, the availability of newinformation, and a reevaluation of the hazards that threaten Kansas. This chapter has beenorganized and is broken down into six sections: Exposure and Analysis of State Development Trends – This sections looks at populationchanges, social vulnerability, land use and development trends and building exposure.Hazard Identification – This section identifies the hazards of greatest concern to Kansasand how and why they were identified.Hazard Profiles and State Risk Assessment – This section describes each hazard identifiedin the previous section, discusses where in the state the hazard is most likely to occur, givesexamples of previous occurrences, states the probability of occurrence and analyzes thevulnerability and potential losses by jurisdiction (county), which includes discussions ondevelopment in hazard-prone areas.Integration of Local Plans: Vulnerability and Loss Estimates – This section includes anoverview and analysis of potential losses to identified vulnerable structures based onestimates provided in local risk assessments.Kansas Hazard Mitigation Plan2018Final3-3
State Owned or Operated Facilities: Vulnerability and Loss Estimates – This sectionaddresses the vulnerability and loss estimates to state owned or operated facilities located inthe identified hazard areas.References – This section consolidates the hazard references used throughout Chapter 3.Like any other aspect of planning, hazard identification and vulnerability assessment is anongoing, continually evolving process. This plan incorporates efforts to not only improve theknowledge of the KHMT, stakeholders, and citizens regarding the hazards known to threaten theState but also to assess if previously unidentified natural, technological or manmade hazardsneed to be addressed by the Kansas Hazard Mitigation Plan.Kansas Hazard Mitigation Plan2018Final3-4
3.1 Exposure and Analysis of State Development TrendsRequirement for Update 201.4(d): Plan must be reviewed and revised to reflect changes indevelopment.Development, demographic and land use trends along with building value exposure areimportant elements to consider in a risk assessment. This section will examine growth, socialvulnerability, other demographics, land use and development trends and exposure of the builtenvironment as inputs to the vulnerability discussions that will take place by hazard in Section3.3 Hazard Profiles and State Risk Assessment.3.1.1. GrowthAs part of the plan update process, the State looked at changes in growth and development andexamined these changes in the context of the State’s hazard-prone areas and how the changes ingrowth and development affect loss estimates and vulnerability. When the population in ahazardous area increases, so does the vulnerability of people and property associated with thehazards unless mitigation measures are taken. Recognizing both the population growth trendsand the geographic locations of the growth patterns within the State is necessary to understandthis issue. The discussion here focuses on population growth and increases in housing units anddensity by county, based on U.S. Census Bureau data.3.1.2. PopulationThe U.S. Census Bureau lists the Kansas population estimate in V2016 at 2,907,289. Thisreflects a 1.9% increase between 2010 and 2016. In 2016 Kansas ranked 33rd among the 50states in population, 13th in land area at 81,758.72 square miles, and 41st in population density.Decennial census findings from the last few decades illustrate growth in Kansas (see Table 3.1).(The year V2016 was added to show more current population trends due to the plan update beingtwo years prior to the next census).Table 3.1. Kansas’ Decennial Census 1970 - V2016YearPopulation% Change19702,246,578 3.119802,363,679 5.219902,477,574 4.820002,688,418 8.520102,853,118 6.1V20162,907,289 1.9%Source: U.S. Census Bureau, 20*V means vintage year.Figure 3.1 shows Kansas’ numerical population changes by county. Between 2010 and 2016,Kansas saw an increase in population of 54,171 people (See Table 3.5 and Table 3.6). Table3.5a shows the 10 least populous counties in Kansas and Table 3.2 below lists all the KansasKansas Hazard Mitigation Plan2018Final3-5
County populations in 2000, 2010, V2016 estimates and population changes categorized by theirmitigation planning region.Table 3.2 shows Kansas’ population by Counties as of the V2016 estimate.Table 3.2. Kansas Counties Census Population for 2000, 2010, and V2016 Estimates(numbers in red in the V2016 estimate column denote declines in sV2016Population Change(Numerical) 2010 V2016Mitigation Planning Region 5-812-283Mitigation Planning Region talMitigation Planning Region 154Kearny4,5313,977-554-12.23%3,917-60Kansas Hazard Mitigation Plan2018Final3-6
-122-1072SubtotalMitigation Planning Region SubtotalMitigation Planning Region 4.37%59,281-72-229-1,801Mitigation Planning Region -130Osborne4,4523,858-594-13.34%3,642-216Kansas Hazard Mitigation Plan2018Final3-7
on Planning Region ,379KingmanSedgwickMitigation Planning Region -8,792ChautauquaMitigation Planning Region 5%33,510-180Kansas Hazard Mitigation Plan2018Final3-8
lMitigation Planning Region nMitigation Planning Region 97963-2536,618DoniphanWashingtonSubtotalMitigation Planning Region : U.S. Census Bureau, Factfinder 2016, index.xhtmlTable 3.3 shows the Top 10 Counties Ranked by Population by the census bureau, V2016estimates. Table 3.4 shows the Ten Counties with the greatest population gains, and Table 3.5Kansas Hazard Mitigation Plan2018Final3-9
reflects counties with the greatest loss of population and Table 3.5a shows the 10 least populouscounties in Kansas per the Census Bureau in V2016 estimates.Table 3.3. Top 10 Counties Ranked by Population, 2010-V2016 EstimatedCountyMitigation PlanningRegionV2016 ineF55,142Source: U.S. Census Bureau, Factfinder 2016, index.xhtmlTable 3.4. Ten Counties with Greatest Population Gains, 2010-V2016 EstimatedCountyMitigation PlanningRegionPopulation GainV2016 ieI2,057GearyI1,224ButlerG1,145EllisB441Source: U.S. Census Bureau, Factfinder 2016, index.xhtmlTable 3.5. Ten Counties with Greatest Population Losses, 2010 – V2016 (est)CountyMitigation PlanningRegionPopulation lsonH-686AllenH-657Kansas Hazard Mitigation Plan2018Final3-10
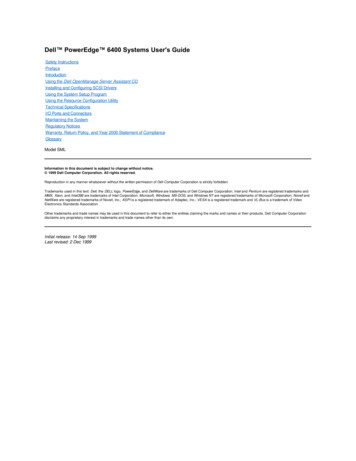
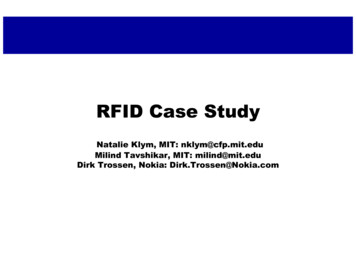
CowleyG-558BourbonH-556Source: U.S. Census Bureau, Factfinder 2016, index.xhtmlTable 3.5a. Ten Smallest Counties Ranked by Population, V2016 EstimatesCountyMitigation 72WichitaC2,112KiowaE2,483SheridanA2,509V2016 PopulationSource: U.S. Census Bureau, Factfinder 2016, index.xhtmlInterim population projections issued by the U.S. Census suggest that state-wide Kansas’population will continue to grow, but percentage increase will drop, through 2030 (see Table3.6).Table 3.6. Interim Kansas Populations 2015-2030YearProjected PopulationPercent 1.33%20252,919,0020.98%20302,940,0840.72%Source: U.S. Census Bureau 2010, www.census.govFigure 3.1 shows the population trends in the State of Kansas for the V2016 census bureauestimates. Red hues are a population decrease and green hues are a population increaseKansas Hazard Mitigation Plan2018Final3-11
Figure 3.1. Population Trends Based on Census Bureau Estimates, V2016Kansas Hazard Mitigation Plan2018Final3-13
The number of housing units is also an indicator of growth for population and the economy. Thecensus defines a housing unit as: a house, an apartment, a mobile home or trailer, a group ofrooms, or a single room that is occupied, or, if vacant, is intended for occupancy as separateliving quarters. According to the U.S. Census Bureau, the number of housing units in Kansasincreased 3.98 percent (44,959 units) between 2000 and 2010. As of 2015 the estimate is:1,243,672, an increase of 10,457 units since 2010. Johnson and Sedgwick counties top the listfor numerical gains in this time period, and the 10 counties with the greatest rate of populationgrowth (percent change) also had the greatest growth in housing units with the exception of EllisCo. Shawnee County was added to the list for top ten counties for housing unit gains, while EllisCounty did not make this list.Table 3.7. Ten Counties with Greatest Housing Unit Gains (Numerical) 2010 – V2015(Est)CountyMitigation PlanningRegionHousing Unit Gains2010-V2015 omieI292ShawneeJ285ButlerG271Source: U.S. Census Bureau 2015, leservices/jsf/pages/productview.xhtml?pid ACS 15 5YR DP04&src ptTable 3.8. Six Counties with Greatest Housing Unit Gains (Percent) 2010-V2015 estCountyMitigation PlanningRegionHousing Unit Gains2010-V2015 3.4%PottawatomieI3.4%DouglasK2.3%Source: U.S. Census Bureau 2015, leservices/jsf/pages/productview.xhtml?pid ACS 15 5YR DP04&src ptNote: In order to be consistent, only six counties are reflected due to the year parameters, that had a measureable percentage gain.Kansas Hazard Mitigation Plan2018Final3-14
Table 3.9. Top 10 Counties Ranked by Number of Housing Units V2015 (estimate)Mitigation PlanningRegionCountyNumber of HousingUnits, 2015JohnsonL231,029SedgwickG213,700ShawneeJ79,425. ,999RenoG28,274ButlerG26,329SalineF24,192. RileySource: U.S. Census Bureau 2015, leservices/jsf/pages/productview.xhtml?pid ACS 15 5YR DP04&src ptTable 3.10 shows the Kansas County census housing units data from 2000 and 2010 and theestimates for V2015. This information is categorized by the Mitigation Planning Regions.Table 3.11 shows the Housing Density by Mitigation Planning Region for the top 10 counties.Table 3.10. Kansas Counties Census Housing Units 2000 – 2010, and 2015 estimatesCounty2000CensusHousingUnits2010 CensusHousing UnitsV2015 CensusHousing UnitsEstimateHousing Unit Change(Numerical) 2010 V2015Mitigation Planning Region ,66816,33816331-7SubtotalMitigation Planning Region ps3,0883,0493,044-5Kansas Hazard Mitigation Plan2018Final3-15
1,91631,206-710SubtotalMitigation Planning Region 614,80814,37614,280-96GreeleySubtotalMitigation Planning Region 942,44442,623179HodgemanSubtotalMitigation Planning Region 30,31829,34629,212-134Mitigation Planning Region FKansas Hazard Mitigation Plan2018Final3-16
62,427128SubtotalMitigation Planning Region hersonMarionSedgwickMitigation Planning Region 7,5137,653140Wilson4,9374,6824,663-19Kansas Hazard Mitigation Plan2018Final3-17
5-94Mitigation Planning Region unseeSubtotalMitigation Planning Region nLinnMitigation Planning Region 079SubtotalMitigation Planning Region 0,457SubtotalStatewideTotalKansas Hazard Mitigation Plan2018Final3-18
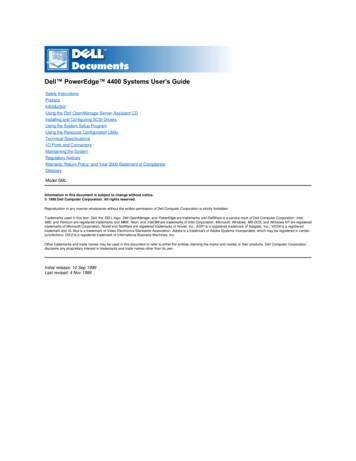
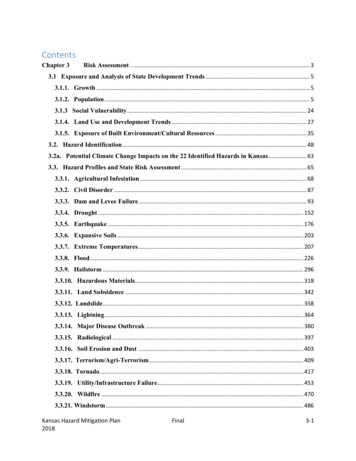
Source: U.S. Census Bureau 2015, leservices/jsf/pages/productview.xhtml?pid ACS 15 5YR DP04&src ptDensityKansas has a surface land area of 81,758 square miles (2010 census), a population of 2,907,289(V2016 census estimate), and a population density of 35.5 people per square mile. In V2016, 31(29 percent) of Kansas’ counties had population densities of less than five people per squaremile. Figure 3.2 shows a map that reflects the Kansas’ Population Density by Census Tract,based on the estimated V2016 population changes. Note: county square miles was taken fromthe 2010 census, and the population figure was taken from the V2016 census estimates in orderto get a more current population density per county. While the square miles could have hadshrinkage, it was felt that it would be statistically insignificant.Figure 3.2. Kansas Population Density by Census Total, V2016 (Estimate)Kansas Hazard Mitigation Plan2018Final3-19
Table 3.11. Top 10 Counties Ranked by Population Density, V2016 (est)CountyMitigationPlanningRegionV2016 HousingDensity (est)V2016PopulationDensity gwickG214.23513.27Shawne
Kansas Hazard Mitigation Plan Final 3-4 2018 State Owned or Operated Facilities: Vulnerability and Loss Estimates - This section addresses the vulnerability and loss estimates to state owned or operated facilities located in