Transcription
Chapter 1Synthetic Aperture Radars (SAR)Imaging BasicsThe word “radar” is an acronym for Radio Detection and Ranging. A radarmeasures the distance, or range, to an object by transmitting an electromagneticsignal to and receiving an echo reflected from the object. Since electromagneticwaves propagate at the speed of light, one only has to measure the time it takesthe radar signal to propagate to the object and back to calculate the range to theobject. The total distance traveled by the signal is twice the distance betweenthe radar and the object, since the signal travels from the radar to the object andthen back from the object to the radar after reflection. Therefore, once wemeasured the propagation time ( t ), we can easily calculate the range ( R ) as1R ct ,2(1-1)where c is the speed of light in vacuum. The factor ½ accounts for the fact thatthe radar signal actually traveled twice the distance measured: first from theradar to the object and then from the object to the radar. If the electric propertyof the propagation medium is different from that of vacuum, the actualpropagation velocity has to be estimated for advanced radar techniques, such asSynthetic Aperture Radars (SAR) interferometry.Radars provide their own signals to detect the presence of objects. Therefore,radars are known as active, remote-sensing instruments. Because radars providetheir own signal, they can operate during day or night. In addition, radar signalstypically penetrate clouds and rain, which means that radar images can beacquired not only during day or night, but also under (almost) all weatherconditions. For these reasons, radars are often referred to as all-weather1
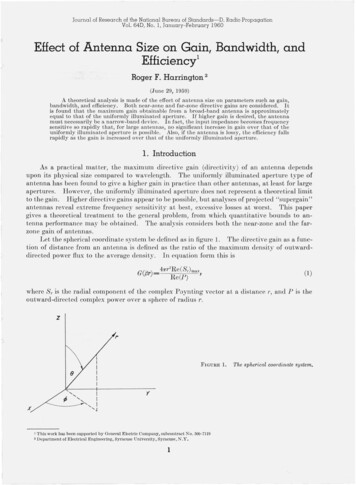
2Chapter 1instruments. Imaging, remote-sensing radars, such as SAR, produce highresolution (from sub meter to a few tens of meters) images of surfaces. Thegeophysical information can be derived from these high-resolution images byusing proper post-processing techniques.This book focuses on a specific class of implementation of synthetic apertureradar with particular emphasis on the use of polarization to infer thegeophysical properties of the scene. As mentioned above, SAR is a way toachieve high-resolution images using radio waves. We shall first describe thebasics of radar imaging. This shall be followed by a description of the syntheticaperture principle. Finally, we shall discuss some advanced SARimplementations, such as SAR polarimetry and polarimetric SARinterferometry.1.1 Basic Principles of Radar ImagingImaging radars generate surface images that are at first glance very similar tothe more familiar images produced by instruments that operate in the visible orinfrared parts of the electromagnetic spectrum. However, the principle behindthe image generation is fundamentally different in the two cases. Visible andinfrared sensors use a lens or mirror system to project the radiation from thescene on a “two-dimensional array of detectors,” which could be an electronicarray or, in earlier remote-sensing instruments, a film using chemical processes.The two-dimensionality can also be achieved using scanning systems or bymoving a single line array of detectors. This imaging approach — an approachwith which we are all familiar from taking photographs with a camera —conserves the relative angular relationships between objects in the scene andtheir images in the focal plane, as shown in Fig. 1-1. Because of thisconservation of angular relationships, the resolution of the images depends onhow far away the camera is from the scene it is imaging. The closer the camera,the higher the resolution and the smaller the details that can be recognized inthe images. As the camera moves further away from the scene, the resolutiondegrades and only larger objects can be discerned in the image.Imaging radars use a quite different mechanism to generate images, with theresult that the image characteristics are also quite different from that of visibleand infrared images. There are two different mechanisms by which radars canbe used to produce images; the two types of radars are broadly classified as realaperture and synthetic aperture radars. We shall discuss the differences betweenthese two types in more detail later in this chapter.Radar images are typically acquired in strips as the satellite or aircraft carryingthe radar system moves along its flight path. These strips are often referred toas swaths or tracks. To separate objects in the cross-track direction and the
SAR Imaging Basics3Fig. 1-1. Passive imaging systems conserve the angular relationships betweenobjects in the scene and their images in the focal plane of the instrument.along-track direction within a radar image, two different methods must beimplemented. The cross-track direction, also known as the range direction inradar imaging, is the direction perpendicular to the direction in which theimaging platform is moving. In this direction, radar echoes are separated usingthe time delay between the echoes that are back-scattered from the differentsurface elements. This is true for both real aperture and synthetic aperture radarimagers. The along-track direction, also known as the azimuth direction, is thedirection parallel to the movement of the imaging platform. The angular size (inthe case of the real aperture radar) or the Doppler history (in the case of thesynthetic aperture radar) is used to separate surface pixels in the along-trackdimension in the radar images. As we will see later, only the azimuth imagingmechanism of real aperture radars is similar to that of regular cameras. Usingthe time delay and Doppler history results, SAR images have resolutions thatare independent of how far away the radar is from the scene it is imaging. Thisfundamental advantage enables high-resolution, spaceborne SAR withoutrequiring an extremely large antenna.Another difference between images acquired by cameras operating in thevisible and near infrared part of the electromagnetic spectrum and radar images
4Chapter 1is the way in which they are acquired. Cameras typically look straight down, orat least have no fundamental limitation that prevents them from taking pictureslooking straight down from the spacecraft or aircraft. Not so for imaging radars.To avoid so-called ambiguities, which we will discuss in more detail later, theimaging radar sensor has to use an antenna that illuminates the surface to oneside of the flight track. Usually, the antenna has a fan beam that illuminates ahighly elongated, elliptically shaped area on the surface, as shown in Fig. 1-2.The illuminated area across track generally defines the image swath.Within the illumination beam, the radar sensor transmits a very short effectivepulse of electromagnetic energy. Echoes from surface points farther away alongthe cross-track coordinate will be received at proportionally later time (seeFig. 1-2). Thus, by dividing the receive time in increments of equal time bins,the surface can be sub-divided into a series of range bins. The width in thealong-track direction of each range bin is equal to the antenna footprint alongthe track xa . As the platform moves, the sets of range bins are coveredsequentially, thereby allowing strip mapping of the surface line by line. This iscomparable to strip mapping with a so-called pushbroom imaging system usinga line array in the visible and infrared part of the electromagnetic spectrum. Thebrightness associated with each image pixel in the radar image is proportionalto the echo power contained within the corresponding time bin. As we will seelater, the real difference between real aperture radars and synthetic apertureradars lies in the way in which the azimuth resolution is achieved.Fig. 1-2. Imaging geometry for a side-looking radar system.
SAR Imaging Basics5This is also a good time to point out that there are two different meanings forthe term range in radar imaging. The first is the so-called slant range and refersto the range along the radar line-of-sight, as shown in Fig. 1-3. Slant ranges aremeasured along the line connecting the radar and the object being imaged, oftencalled the target or the scatterer. The second use of the term range is for theground range, which refers to the range along a smooth surface (the ground) tothe scatterer. The ground range is measured from the so-called nadir track,which represents the line described by the position directly underneath the radarimaging platform. One has to be careful to take topography into account whenre-sampling radar images from slant range to ground range. This will bediscussed in more detail in Section 1.6.2.Before looking at radar resolutions, let us define a few more terms commonlyencountered in radar imaging. The look angle is defined as the angle betweenthe vertical direction and the radar beam at the radar platform. The incidenceangle is defined as the angle between the vertical direction and the radar wavepropagation vector at the surface (as shown in Fig. 1-3). When surfacecurvature effects are neglected, the look angle is equal to the incidence angle atthe surface when the surface is flat. In the case of space-borne systems, surfacecurvature must be taken into account; this leads to an incidence angle that isalways larger than the look angle for flat surfaces. It is quite common in theliterature to find authors using the terms look angle and incidence angleinterchangeably. That is only correct for low-flying aircraft, and only whenthere is no topography present in the scene. As we will see next, if topographyis present (i.e., if the surface is not flat), the local incidence angle might vary inthe radar image from pixel to pixel.SensorDepression AngleLook AngleIncidence AngleLocal NormalTo SurfaceGrazing AngleGround RangeFig. 1-3. Definition of some common radar imaging terms.“Target”
6Chapter 1Consider the simple case of a single hill illuminated by a radar system, as isshown in Fig. 1-4. Also shown in the figure are the local normal to the surfacefor several positions on the hill. Relative to a flat surface, it is clear that forpoints on the hill facing the radar, the local normal tilts more towards the radar;therefore, the local incidence angle will be smaller than for a point at the sameground range, but on a flat surface.A term commonly encountered in military literature is depression angle. This isthe angle between the radar beam and the horizontal at the radar platform. Thedepression angle is, therefore, related to the look angle in that one is equal to90 degrees minus the other. A small look angle is equivalent to a largedepression angle, and vice versa. Similarly, one often finds the term grazingangle describing the angle between the horizontal at the surface and the incidentwave in the military literature. The grazing angle is, therefore, related to theincidence angle in the same way that the depression angle is related to the lookangle. In this text, we shall use look angle and incidence angle to describe theimaging geometry.1.2 Radar ResolutionThe resolution of an image is defined as that separation between the two closestfeatures that can still be resolved in the final image. First, consider two pointtargets that are separated in the slant range direction by xr . Because the radarwaves propagate at the speed of light, the corresponding echoes will beseparated by a time difference t equal to:Case 1: The local normal at the top ofthe hill is the same as that of a flatsurface, leaving the incidence angleunchanged.Case 2: The local normal on theside of the hill facing the radar istilted towards the radar, decreasingthe local incidence angle.Case 3: On the side of the hill facingaway from the radar, the local normalis tilted away form the radar,increasing the local incidence angle.Fig. 1-4. Topographic variations in the image will cause the local incidence angle to bedifferent from that expected for a flat surface with no relief.
SAR Imaging Basics7 t 2 xr c ,(1.2-1)where c is the speed of light and the factor 2 is included to account for thesignal round trip propagation, as was previously described. Radar waves areusually not transmitted continuously; instead, a radar usually transmits shortbursts of energy known as radar pulses. The two features can be discriminatedif the leading edge of the pulse returned from the second object is received laterthan the trailing edge of the pulse received from the first feature, as shown inFig. 1-5.Therefore, the smallest separable time difference in the radar receiver is equalto the effective time length τ of the pulse. Thus, the slant range resolution of aradar is:2 xr c τcτ xr 2(1.2-2)Now let us consider the case of two objects separated by a distance x g on theground. The corresponding echoes will be separated by a time difference tequal to:Fig. 1-5. If the radar echoes from two point targets are separated in time by morethan or equal to the length of the radar pulse, it is possible to recognize theechoes as those from two different scatterers, as shown in the top two panels. Ifthe time difference between the echoes is less than the radar pulse length, it isnot possible to recognize two distinct scatters, as in the case of the bottompanel.
8Chapter 1 t 2 xg sin θ c .(1.2-3)The angle θ in Eq. (1.2-3) is the local incidence angle. (This should actually becalled the incident angle, or angle of incidence. Since incidence angle is usedalmost universally in the literature, we shall continue to use that term to avoidconfusion.). As in the case of the slant range discussed above, the two featurescan be discriminated if the leading edge of the pulse returned from the secondobject is received later than the trailing edge of the pulse received from the firstfeature. Therefore, the ground range resolution of the radar is given by2 xg sin θ c τ cτ.xg 2sin θ(1.2-4)In other words, the ground range resolution is equal to half the footprint of theradar pulse on the surface. Note that Eq. (1.2-4) implies that the ground rangeresolution is different for different incidence angles. This also means that thelocal slopes in the images will affect the ground range resolution. For slopesfacing the radar, the ground range resolution will be poorer than that for slopesfacing away from the radar.Occasionally, the effective pulse length is described in terms of the systembandwidth B . As we will show in the next section, to a good approximation,τ 1 B .(1.2-5)A pulsed radar determines the range by measuring the round trip time bytransmitting a pulse signal. In designing the signal pattern for a radar sensor,there is usually a strong requirement to have as much energy as possible in eachpulse in order to enhance the signal-to-noise ratio. This can be done byincreasing the transmitted peak power or by using a longer pulse. However, thepeak power is usually strongly limited by the available power sources,particularly in the case of spaceborne sensors. On the other hand, an increasedpulse length leads to a worse range resolution (see Eq. (1.2-4)). This dilemma isusually resolved by using modulated pulses, which have the property of a widebandwidth even when the pulse is very long. After so-called pulse-compression,a short effective pulse length is generated, increasing the resolution. One way tomodulate the pulse is to vary the radar signal frequency linearly while the pulseis being transmitted. This waveform is known as chirp. Although other ways ofmodulating pulses are occasionally used, the chirp modulation is by far themost common; we shall, therefore, use this scheme to illustrate how signalmodulation can be used to enhance radar range resolution.
SAR Imaging Basics9In a chirp, the signal frequency within the pulse is linearly changed as afunction of time. If the frequency is linearly changed from f 0 to f 0 f , theeffective bandwidth would be equal to:B ( f0 f ) f0 f ,(1.2-6)which is independent of the pulse length τ p . Thus, a pulse with long duration(i.e., high energy) and wide bandwidth (i.e., high range resolution) can beconstructed. The instantaneous frequency for such a signal is given by:f ( t ) f0 Bτpt τ p 2 t τ p 2 .for(1.2-7)The corresponding signal amplitude is: B 2 A ( t ) ℜ exp i 2π f ( t ) dt cos 2π f 0t t , 2τ p {}(1.2-8)where ℜ(x ) means the real part of x . Note that the instantaneous frequency isthe derivative of the instantaneous phase. A pulse signal such as shown inequation (1.2-8) has a physical pulse length τ p and a bandwidth B . Theproduct τ p B is known as the time bandwidth product of the radar system. Intypical radar systems time bandwidth products of several hundred are used.At first glance, it might seem that using a pulse of the form shown inEq. (1.2-8) cannot be used to separate targets that are closer than the projectedphysical length of the pulse (as shown in the previous section). It is, indeed,true that the echoes from two neighboring targets that are separated in the rangedirection by much less than the physical length of the signal pulse will overlapin time. If the modulated pulse and, therefore, the echoes have a constantfrequency, it will not be possible to resolve the two targets. However, if thefrequency is modulated as described in Eq. (1.2-7), the echoes from the twotargets will have different frequencies at any instant of time and, therefore, canbe separated by frequency filtering.In actual radar systems, a matched filter is used to compress the returns fromthe different targets. Consider an example where we transmit a signal of theform described in Eq. (1.2-8). The signal received from a single point scattererat a range R is a scaled replica of the transmitted signal delayed by a timet 2R c . The output of the matched filter for such a point scatterer ismathematically described as the convolution of the returned signal with a
10Chapter 1replica of the transmitted signal. Being careful about the limits of theintegration, one finds that for large time-bandwidth products, Vo ( t ) τ p Er exp ( iωt ) exp ( i 4π R λ )sin (π B ( t 2 R c ) )π B (t 2R c )(1.2-9)whereω 2π f 0andEr electric field received by radar from a point source.This compressed pulse has a half power width of approximately 1 B and itspeak position occurs at time 2R c . Therefore, the achievable range resolutionusing a modulated pulse of the kind described in Eq. (1.2-8) is a function of thechirp bandwidth and not the physical pulse length. In typical spaceborne andairborne SAR systems, physical pulse lengths of several tens of micro-secondsare used, while bandwidths of several tens of megahertz are no longeruncommon for spaceborne systems, and several hundreds of megahertz arecommon in airborne systems.So far, we have seen the first major difference between radar imaging and thatused in passive imaging systems. The cross-track resolution in the radar case isindependent of the distance between the scene and the radar instrument and is afunction of the system bandwidth. Before looking at the imaging mechanismsin the along-track direction, we will examine the general expression for theamount of reflected power that the radar receiver would measure. This isdescribed through the so-called radar equation, which we will examine in thenext section.1.3 Radar EquationOne of the key factors that determine the quality of the radar imagery is thecorresponding signal-to-noise ratio (SNR), commonly called SNR. This is theequivalent of the brightness of a scene being photographed with a cameraversus the sensitivity of the film or detector. Here, we consider the effect ofthermal noise on the sensitivity of radar imaging systems. The derivation of theradar equation is graphically shown in Fig. 1-6.In addition to the target echo, the received signal also contains noise, whichresults from the fact that all objects at temperatures higher than absolute zeroemit radiation across the whole electromagnetic spectrum. The noise
SAR Imaging Basics11Fig. 1-6. Schematic of the derivation of the radar equation.component that is within the spectral bandwidth B of the sensor is passedthrough with the signal. The receiver electronics also generates noise thatcontaminates the signal. The thermal noise power is given by:PN kTB ,(1.3-1) 23k 1.6 10W/K/Hz) and T is the totalwhere k is Boltzmann’s constant ( equivalent noise temperature in kelvin. The resulting SNR is then:SNR Pr PN .(1.3-2)Notice that the noise bandwidth is usually larger than the transmit bandwidth,due to the hardware limitation.One common way of characterizing an imaging radar sensor is to determine thesurface backscatter cross section σ N , which gives an SNR 1 . This is calledthe noise equivalent backscatter cross section. It defines the weakest surfacereturn that can be detected and, therefore, identifies the range of surface unitsthat can be imaged.
12Chapter 11.4 Real Aperture RadarThe real aperture imaging radar sensor also uses an antenna that illuminates thesurface to one side of the flight track. As mentioned before, the antenna usuallyhas a fan beam that illuminates a highly elongated elliptical shaped area on thesurface (see Fig. 1-2). As shown in Fig. 1-2, the illuminated area across trackdefines the image swath. For an antenna of width W operating at a wavelengthλ , the beam angular width in the range plane is given by:θr λ W(1.4-1)and the resulting surface footprint or swath S is given byS hθ rλh ,cos θ W cos 2 θ(1.4-2)2where h is the sensor height above the surface, θ is the angle from the centerof the illumination beam to the vertical (the look angle at the center of theswath), and θ r is assumed to be very small. Note that Eq. (1.4-2) ignores thecurvature of the Earth. For spaceborne radars, this effect should not be ignored.If the antenna beam width is large, one needs to use the law of cosines to solvefor the swath width.A real aperture radar relies on the resolution afforded by the antenna beam inthe along-track direction for imaging. This means that the resolution of a realaperture radar in the along-track direction is determined by the size of theantenna as well as the range to the scene. Assuming an antenna length of L ,the antenna beam width in the along-track direction isθa λL.(1.4-3)At a distance R from the antenna, this means that the antenna beam widthilluminates an area with the along-track dimension equal toxa Rθ a λRλh .L L cos θ(1.4-4) To illustrate, for h 800 km, λ 23 cm, L 12 m and θ 20 , then xa 16km. Even if λ is as short as 2 cm and h as low as 200 km, xa will still beequal to about 360 meters, which is considered to be a relatively poorresolution, even for remote sensing. This has led to very limited use of the realaperture technique for surface imaging, especially from space. A real apertureradar uses the same imaging mechanism as a passive optical system for the
SAR Imaging Basics13along-track direction. However, because of the small value of λ (about 1 µm),resolutions of a few meters can be achieved from orbital altitudes with anaperture only a few tens of centimeters in size. From aircraft altitudes, however,reasonable azimuth resolutions can be achieved if higher frequencies (typicallyX-band or higher) are used. For this reason, real aperture radars are notcommonly used in spaceborne remote sensing (except in the case ofscatterometers and altimeters that do not need high-resolution data).In terms of the radar equation, the area responsible for reflecting the powerback to the radar is given by the physical size of the antenna illumination in thealong-track direction and the projection of the pulse on the ground in the crosstrack direction. This is shown in Fig. 1-2 for the pulses in the radar swath. Thealong-track dimension of the antenna pattern is given by Eq. (1.4-4). If thepulse has a length τ p in time, and the signal is incident on the ground at anangle θi the projected length of the pulse on the ground islg cτ p2sin θi.(1.4-5)Therefore, the radar equation in the case of a real aperture radar becomesP G G λ 2 λ R cτ pσ0 .Pr t t r( 4π )3 R 4 L 2sin θi(1.4-6)The normalized backscattering cross section ( σ 0 ) is defined as24π R 2 Erσ 0 lim2AR 0 Ei(1.4-7)where A0 is the illuminated surface area, Er is the reflected electric field, andEi is the incident electric field.This shows that when a real aperture radar images an extended area, thereceived power decreases as the range to the third power. In terms of thephysical antenna sizes, we can rewrite this expression asPr 2PWLcτ pσ 0t8πλ R3 sin θi.(1.4-8)
14Chapter 1This is the radar equation for a so-called distributed target for the real apertureradar case. From Eq. (1.4-7), it is clear that the received power increases as thesquare of the width of the antenna. However, increasing the antenna width alsodecreases the swath width. The received power only increases linearly with anincrease in antenna length. Increasing the antenna length also improves thealong-track resolution of the real aperture radar. For this reason, real apertureradars usually operate with antennas that are the longest that could bepractically accommodated.In summary, a real aperture radar uses the same imaging mechanism as passiveimaging systems to achieve along-track resolution. The practically achievableresolutions are usually poorer than what is generally required for remotesensing applications. Real aperture radars are, therefore, not commonly used forremote sensing applications.1.5 Synthetic Aperture RadarSynthetic aperture radar refers to a particular implementation of an imagingradar system that utilizes the movement of the radar platform and specializedsignal processing to generate high-resolution images. Prior to the discovery ofsynthetic aperture radar, principle imaging radars operated using the realaperture principle and were known as side-looking aperture radars (SLAR).Carl Wiley of the Goodyear Aircraft Corporation is generally credited as beingthe first person to describe the use of Doppler frequency analysis of signalsfrom a moving coherent radar to improve along-track resolution. He noted thattwo targets at different along-track positions will be at different angles relativeto the aircraft velocity vector, resulting in different Doppler frequencies. (TheDoppler effect is the well-known phenomenon that causes a change in the pitchof a car horn as it travels past a stationary observer.) Using this effect, targetscan be separated in the along-track direction on the basis of their differentDoppler frequencies. This technique was originally known as Doppler beamsharpening, but later became known as synthetic aperture radar (SAR).The main difference between real and synthetic aperture radars is, therefore, inthe way in which the azimuth resolution is achieved. The range resolution andradar equation derived previously for a real aperture radar is still valid here.The along-track imaging mechanism and the resulting along-track resolution is,however, quite different for the real and synthetic aperture radar case.As the radar moves along the flight path, it transmits pulses of energy andrecords the reflected signals, as shown in Fig. 1-2. When the radar data areprocessed, the position of the radar platform is taken into account when addingthe signals to integrate the energy for the along-track direction. Consider thegeometry shown in Fig. 1-7. As the radar moves along the flight path, the
SAR Imaging Basics15R0θaScattererAntenna beamwhen scattererexits beamAntenna beamwhen scattererenters beamFig. 1-7. The synthetic aperture radar integrates the signal from thescatter for as long as the scatterer remains in the antenna beam.distance between the radar and the scatterer changes, with the minimumdistance occurring when the scatterer is directly broadside of the radar platform.The phase of the radar signal is given by 4π R ( s ) λ . The changing distancebetween the radar and the scatterer means that after range compression, thephase of the signal will be different for the different positions along the flightpath.This changing distance can be written asR (s)R02 v 2 s 2 ,(1.5-1)where R0 is the range at closest approach to the scatterer, v is the velocity ofthe radar platform, and s is the time along the flight path (so-called slow time)with zero time at the time of closest approach. To a good approximation forremote sensing radars, we can assume that vs R0 . (This might not be truefor very-high-resolution radars; however, the basic principle remains the same.)In this case, we can approximate the range as a function of slow time asR ( s ) R0 v2 2s .2 R0(1.5-2)
16Chapter 1The phase of the signal after range compression, as shown in the secondexponential in Eq. (1.2-9), then becomesφ (s) 4π R ( s )λ 4π R0λ 2π v 2 2s .R0λ(1.5-3)The instantaneous frequency of this signal isf (s) 1 φ ( s )2v 2 s.2π sR0 λ(1.5-4)This is the expression of a linear frequency chirp. To find the bandwidth of thissignal, we have to find the maximum time that we can use in the signalintegration. This maximum “integration time” is given by the amount of timethat the scatterer will be in the antenna beam. For an antenna with a physicallength L , the half-power horizontal beam width is θ a λ L , so that thescatterer at the range of closest approach R0 is illuminated for a timestot λ R0.Lv(1.5-5)Half of this time occurs when the radar is approaching the range of closestapproach and half of it is spent traveling away from the range of closestapproach. Therefore, the bandwidth of the signal shown in Eq. (1.5-4), which isthe Doppler bandwidth of the SAR signal, isBD 2v.L(1.5-6)If this signal is filtered using a matched filter, as described earlier under signalmodulation, the resulting compressed signal will have a width in time of 1 BD .Since the radar platform moves at a speed of v , this leads to an along-trackresolution of a vL. BD 2(1.5-7)This result shows that the azimuth (or along-track) sur
1 Chapter 1 Synthetic Aperture Radars (SAR) Imaging Basics The word "radar" is an acronym for Radio Detection and Ranging.A radar measures the distance, or range, to an object by transmitting an electromagnetic