Transcription
NBER WORKING PAPER SERIESBUBBLE INVESTING:LEARNING FROM HISTORYWilliam N. GoetzmannWorking Paper 21693http://www.nber.org/papers/w21693NATIONAL BUREAU OF ECONOMIC RESEARCH1050 Massachusetts AvenueCambridge, MA 02138October 2015The author thanks Elroy Dimson, Paul Marsh and Mike Staunton for the generous use of the DMSdatabase and Michele Fratianni for providing the data on the Casa di San Giorgio. The views expressedherein are those of the author and do not necessarily reflect the views of the National Bureau of EconomicResearch.NBER working papers are circulated for discussion and comment purposes. They have not been peerreviewed or been subject to the review by the NBER Board of Directors that accompanies officialNBER publications. 2015 by William N. Goetzmann. All rights reserved. Short sections of text, not to exceed two paragraphs,may be quoted without explicit permission provided that full credit, including notice, is given tothe source.
Bubble Investing: Learning from HistoryWilliam N. GoetzmannNBER Working Paper No. 21693October 2015, Revised January 2016JEL No. G01,G14,N2ABSTRACTHistory is important to the study of financial bubbles precisely because they are extremely rare events,but history can be misleading. The rarity of bubbles in the historical record makes the sample sizefor inference small. Restricting attention to crashes that followed a large increase in market level makesnegative historical outcomes salient. In this paper I examine the frequency of large, sudden increasesin market value in a broad panel data of world equity markets extending from the beginning of the20th century. I find the probability of a crash conditional on a boom is only slightly higher than theunconditional probability. The chances that a market gave back it gains following a doubling in valueare about 10%. In simple terms, bubbles are booms that went bad. Not all booms are bad.William N. GoetzmannSchool of ManagementYale UniversityBox 208200New Haven, CT 06520-8200and NBERwilliam.goetzmann@yale.edu
I. IntroductionThe broad awareness of financial history seems to correlate to extreme market events. Forexample, the closest comparison to the Dot-Com bubble of the 1990’s was the run-up in U.S. stockprices in the 1920’s. During the 2008 financial crisis, the financial press frequently referencedpast bubbles– periods of market euphoria followed by sharp price declines. In this paper I arguethat using past crashes in this way is misleading to both investors and policy-makers. Particularlyduring periods of market booms, focusing attention on a few salient crashes in financial historyignores the base rate for bubbles. In simple terms, bubbles are booms that went bad but not allbooms are bad.To illustrate this last point, I present empirical evidence drawn from more than a centuryof global stock market data. I define a bubble as a large price decline after a large price increaseor, a crash after a boom. I find that the frequency of bubbles is quite small. The unconditionalfrequency of bubbles in the data is 0.3% to 1.4% depending on the definition of a bubble. Notonly are bubbles rare but conditional upon a market boom (i.e. increasing by 100% in a one tothree year period). Crashes that gave back prior gains happened only 10% of the time. Marketprices were more likely to double again following a 100% price boom.Prior to the empirical analysis, I present evidence about bubbles (as well as the lack ofthem) in very early equity investments. Thus, the next section discusses some of the early bubblesin financial history. Section III describes the databases used in the study and the empirical analysis.Section IV discusses the implications of the results for investors and regulators.II. Data on Markets and BubblesThe first bubbles precede the development of organized stock exchanges. Stuart Jenksreports evidence of a bubble in speculative German mining shares, kuxe, at the end of the 15thcentury.1 Fractional equity interest in individual silver mines in the Hartz mountain district wereevidently freely traded, purchased on credit and occasionally had option-like features.Transactions were settled at financial fairs during which share prices could fluctuate dramatically.Jenks, Stuart, ND, “THE FIRST BUBBLE Silver mining in the Saxon Erzgebirge, c. rch/Lists/Seminar%20Program/Attachments/37/The first bubble.PDF. Hecites Werner (1936) and Laub (1974) for empirical price evidence.11
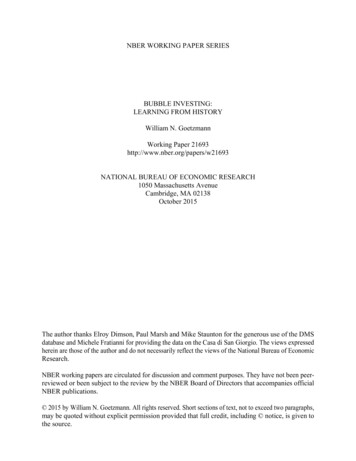
These were famously condemned by Martin Luther in 1554: “Ich will kein kuks haben! Es istspiegelt, und es will nicht wudeln [gedeihen] dasselbige gelt.” “I will have nothing to do withkuxen. They are play money and will not generate hard cash.”In 1502, on the eve of sailing on his final voyage, Christopher Columbus expressed a desirethat his son use his inheritance to purchase shares in the Casa di San Giorgio in Genoa which heobserved would generate “6 % interest and constitute a very safe investment.”2 The firm was afinancial institution that owned and managed government contracts and ultimately became a bank.Its board regularly declared dividends and these, as well as the shares themselves, were activelytraded.3Shares in Genoa’s Casa di San Giorgio fluctuated considerably in the 16th century. Figure1 shows an index of prices and yields. The dramatic doubling of prices in 1602 looks like a bubbleto the modern eye because yields declined from 3% to 1 ½%. This bubble sustained itself for along time however, prices did not drop back to their former level until 1683. Likewise, a peak in1622 looks ex post like a bubble, although the fortunes of Genoa as a financial power in the early17th century also fluctuated considerably. The variation on both occasions might be due to rationalspeculation on events of the time. Nevertheless, they appear to fit a price-based definition of abubble. This bubble pattern is not ubiquitous in the early history of equity shares. In Le Bris etal. (2014) we found no evidence of a bubble in the trading history of an even older corporation.Stock prices for the Bazacle milling company of Toulouse, over an extended period from the1530’s to 1946, moved fairly closely with dividends.The first discussions in England of a stock market bubble centered on the speculation inshares for start-up companies during the 1690’s. McCleod (1986) argued that intellectual propertyrights were more likely the excuse for stock market speculation rather than the basis for realvaluation in this first English market bubble.The first great stock market bubble began in France, with the creation of the MississippiCompany by John Law which was an ingenious financial innovation that merged a bankempowered to issue currency with companies chartered for overseas trade– hence the nameMississippi Company. The price of shares grew by more than 10 times during 1719 and 1720.Harrisse, Henry, 1888, Christopher Columbus and the Bank of Saint George (Ufficio Di San Giorgio in Genoa):Two Letters Addressed to Samuel L.M. Barlow, Esquire, Priv. print. [Chiswick Press; C. Wittingham and Company,London].3Cf. Fratianni (2006).22
The Mississippi Bubble burst in the spring of 1720 when shares were made exchangeable withpaper currency at a fixed rate, resulting in a massive government commitment to propping up shareprices by printing money.4 The Mississippi Bubble was followed shortly by the South Sea Bubblein London and a smaller but significant bubble for shares in the Netherlands. The British andDutch bubbles subsequently burst in late 1720, and by the end of the year, the boom in stock marketspeculation was effectively over.My co-authors and I have worked to understand the basis for this remarkable sequence ofinternational stock bubbles from 1719-1720.5 We found empirical and archival evidence thatregulatory enforcement following the Bubble Act in London triggered a crash in the prices ofinsurance company stocks and that this ultimately spread to the large trading companies and banksin the UK and then overseas to the Dutch West Indies Company and a number of recently launchedcompanies in the Netherlands.Figure 2 illustrates the parallel growth in share prices for selected companies in Londonand Amsterdam in this period. The three London companies are Royal Exchange Assurance,London Assurance and the South Sea Company. The two Dutch companies are the Dutch WestIndies Company and Stad Rotterdam– an insurance company whose successor firm still existstoday. The figure shows the scale of the London and Amsterdam bubbles. The South SeaCompany rose by a factor of 7.5 over the year leading to the eponymous “South Sea Bubble.” Thetwo marine insurance companies grew much more by multiples of more than 10 and 13. Only theDutch West Indies Company grew at a comparable scale in Amsterdam by a factor of 7. StadRotterdam did not quite double before declining in price. The graph also shows how interconnected the Dutch and British bubbles were. Although they rose at different times in the year1720, the crash in the prices of the London insurance firms and the Dutch West Indies Companyoccurred at about the same time (a few days lag is consistent with travel times between the twofinancial centers).In the United Kingdom, the Bubble Act curtailed the issuance and trading of unauthorizedcompany shares and set back the development of an equity market as a vehicle for a financingenterprise. In the Netherlands, there was no such governmental response but nevertheless, initialpublic offerings stopped and a cultural re-examination of stock market speculation occurred. Stock45C.f. Murphy (1997) & Velde (2009).Cf. Frehen et al (2013).3
schemes were ridiculed and speculators were caricatured. One curious legacy of the 1720international stock market bubble was a lavishly illustrated volume, Het Groote Tafereel DerDwaasheid, or The Great Mirror of Folly, a book of satirical poems, prints, plays and engravingsspecifically intended to preserve the memory of the folly of speculation during the crisis.Bubbles make interesting stories.Charles MacKay’s classic book, Memoires ofExtraordinary Popular Delusions and the Madness of Crowds, was first published in 1852 and isstill in print. Using illustrations redrawn from The Great Mirror of Folly, MacKay poked fun atboth the South Sea Bubble and the Mississippi Company including them along with chapters onalchemy, fortune-telling and “magnetizers.” MacKay regarded stock speculation as a “madnesswhich infected the people of England.”In Frehen et al. (2013) we used cross-sectional evidence from the 1720 bubble to argue thatthe stock boom in 1720 was founded on economic fundamentals including the economic potentialof trans-Atlantic trade, innovations in maritime insurance and the potential of the publicly tradedcorporation itself as a vehicle for enterprise. Nicholas (2008) likewise, used cross-sectionalevidence for companies with patents in the 1920’s. He shows that, ex-post, firms with valuablepatents, rose relatively more. In seeking to understand the economics underlying the causes ofbubbles, Pástor, L’, & Veronesi, P. (2009) build a model of technological innovation and test it oncross-sectional historical data from the 19th century railroad boom in the U.S. Perez (2009)explored the relationship between technological innovation and financial innovation in five majorbubbles that occurred in the 19th, 20th and 21st centuries. In each of these cases evidence suggeststhat there was at least some method to the madness of the investors. While potentially overlyoptimistic about valuations for new technology companies, investors in these bubbles identified,ex ante, the potential transformative value of innovations.4
III. AnalysisIII.1 DataThis brings us to the empirical analysis of market booms and busts. Dimson, Marsh andStaunton (DMS) have constructed an annual database of equity returns for 21 of the world’s stockmarkets by collecting stock and dividend data beginning in 1900 and extending through 2014. Weused their equity total return real return indexes denominated in dollars as our market measuresfor these countries. We augmented these with the annualized dollar-denominated stock marketindexes used in Jorion and Goetzmann (1999) (JG). For countries in DMS, we dropped the JGindexes resulting in 20 remaining JG indexes.The JG indexes are taken mostly from contemporaneous sources that sought to trackindices in real time. The League of Nations (LofN) maintained indexes for several countriesbeginning in 1919 and these were continued by the United Nations (UN). We collected theseindexes in a “follow forward” manner from the published periodicals and linked them to IFCindexes available in the 1990’s. The advantage of augmenting the DMS series is that the JGdatabase contains a number of markets that failed or disappeared during the 20th century due towars, revolutions and various other reasons.Reliance on LofN and UN sources means that we do not control the manner in which theindexes were created and cannot be sure that the capital appreciation returns we calculated wereactually obtainable. On the positive side, the JG indexes derive from documentary data widelyavailable in libraries through much of the 20th century. Hence, the frequency of past bubbles sinceat least 1920 has been available for establishing a “base rate” for price run-ups and crashes andtheir coincidence in time.We include two additional series constructed for the International Center for Finance (ICF)at the Yale School of Management– The Saint-Petersburg Stock Exchange and the Shanghai StockExchange are both dollar-denominated, total return indexes. Finally, we augment both the JG andICF series with FTSE dollar-denominated price appreciation series available in the MorningstarEnCorr database. We have not used the IFC or FTSE indexes to add additional markets, althoughthese could provide an even broader set of indexes. The reason is survival-conditioning bias.Taking markets that exist today and tracing them back may result in a series that is mean-revertingor displays more complex time-series behavior associated with recent growth (cf. Goetzmann and5
Jorion, 1999). This could then bias the analysis of stock market performance conditional on aboom, which is our aim.Table 1 lists the markets in this study and calculates summary statistics for the DMS andthe JG/ICF databases. Note that the JG/ICF series are discontinuous and start and stop at variousintervals. They are generally considered emerging markets and have a strong representation ofSouth American, Central American and Eastern European countries. The JG/ICF series are morevolatile by far, with an average standard deviation of 50% per year. On the other hand, theiraverage annual returns for years we have data is no higher than the DMS series. For series knownto have been expropriated, a minus 100% return is included.III.2 Booms and CrashesFor the purposes of this analysis, a bubble is defined as a boom followed by a crash. Aboom is a large, rapid increase in stock prices. A crash is a large, rapid decline in market prices.What is large? What is rapid? Table 2 defines booms in two ways: (1) a single year in which amarket value (or cumulative return) increased by at least 100%; (2) a period of three years overwhich the market increased by 100%. This second definition is chosen so as to include the famousU.S. bubbles of the 1920’s and 1990’s.A crash is defined as: (1) a drop of at least 50% in the following year; (2) a drop of at least50% over the next five years. There are other ways to use price dynamics to define a bubble. Forexample, a high price-earnings ratio is a common metric invoked as a bubble indicator. Longterm data for dividends are not available for most of the markets examined here. However, mostpeople would agree that a doubling in market prices followed by a halving in value is a significantreversal, and further absent are details about economic fundamentals. Thus, this study can beinterpreted as focusing on one common notion of a bubble, but not the only one.Table 2 reports results for each of the two bubble definitions. The first horizontal block inpanel one shows the unconditional counts of market-years and the frequency of doubling andhalving. Column one, for example, shows that there are 3,470 market-years in the database, 72 ofwhich were returns over 100% and 84 of which were returns under 50%. Moving to column two,the market-year count declines to 3,308 reflecting the requirement of a prior year return.6 TwoThat is, conditional upon the existence of a return in a prior year, what is the frequency of doubling or halving.This excludes, for example, the first year in a series, and a year following a resumption of market data after a break.66
percent of these market years (i.e. years with an existing prior year) were returns in excess of100%.In the next horizontal block, Table 2 follows the 72 market years that had 100% or bettergrowth in a calendar year. The conditional frequency of doubling in the subsequent year is 8.33%which is much higher than the population fraction in the block above. This is not surprising giventhat a doubling is more likely in volatile markets. Likewise, the probability of halving is 4.17%which is about twice the unconditional probability. Six of the 72 “doubling” markets more thandoubled again in the following year. Three of the 72 declined by a half or more, essentially givingback the prior year’s gains. Table 3 identifies these reversal events which are Argentina in 197677, Austria in 1923-24 and Poland in 1993-94.Bubbles may take some time to deflate. Counts and frequencies at the five year horizonare reported for the T 5 columns in Table 2. After five years, 15.28% percent of the boom marketshad crashed to less than half their levels at T 0. On the other hand, 26.93% of the markets had atleast doubled in value again. After a stock market boom of at least 100% in a single year, thefrequency of doubling in the next five years was significantly greater than the frequency of halving.Note that the frequency of crashing at the five year horizon is significantly higher forbooming markets than the unconditional frequency, while the frequency of doubling after fiveyears is about the same. Thus, a boom does increase the probability of a crash, however the crashprobability is low. A rapid boom is not a strong indicator of a bust– probabilities move from 2%to 4% at the one year horizon and from 6% to 15% at the five year horizon. The significance ofthis shift depends of course on investor risk aversion. From a historical perspective, it is importantto recognize that the overwhelming proportion of booms that doubled market values in a singlecalendar year were not followed by a crash that gave back these gains.Table 2 also includes results for markets that halved in value in a single year. These aresimilar to the doubling market results. Subsequent tail events (doubling or halving) at the one yearand five year horizons are higher than the unconditional probabilities of these events.Doubling in a single year may be too restrictive as a definition of a boom. The Dot-Combubble of the 1990’s evolved over several years. Panel two of Table 2 reports results for the seconddefinition of a boom– one that doubles market value over a three year horizon. This definition ischosen so that it includes the U.S. booms of 1928 and 1999. This definition also includes boomsin the US in 1935, 1945, 1956 and 1997. This broader definition of a boom generates 460 events7
of a doubling over three years– roughly 14% of the overlapping three year return periods in thedata. In the context of global equity markets, the 1928 and 1999 booms were not that unusual,although three-year bubbles were not common. After a three year run-up, markets subsequentlyhalved in the following year 4.57% of the time. This is about twice the unconditional probabilityof a one year halving event, but it is still rare. At the five year horizon, the probability of themarket value declining by a half after five years is 10.42%, which is higher than the unconditionalprobability of 6.31% but not dramatically so.One important caveat– the frequencies in Table 2 are conditional upon data existing insubsequent years after the event of interest. I’ve taken care to include markets known to haveclosed after wars and revolutions, and assigned -99% returns to them. A robustness test thatassigns a -100% return to all missing observations (not reported) increases the frequency ofhalving for both conditional and unconditional distributions but not the basic result thatconditioning of a boom has a relatively minor effect.Past studies of the mean reversion of stock markets suggests that what goes up must comedown and thus a large boom should increase the probability of a future decline. However, focusingon the rejection of the null of no association between past and future multi-year market returns canbe misleading for economic decision-making. The fact that probabilities of a decline increase from6% to 10% following a three year boom may not be as relevant to investor choice as the fact thatthe chance of doubling in value is twice the chance of halving in value over that same horizon.IV. ConclusionThe most important thing a financial historian can tell investors about bubbles is that theyare rare. Indeed any discussion of bubbles quickly turns to history because recent evidence islacking. Most models and analysis of stock market bubbles focuses on a few well-knowninstances. Gathering data about the world’s stock markets helps to fill in this lack of empiricalevidence. The DMS and JG/ICF data provide some insight into the rarity of bubbles. Theoverwhelming proportion of price increases in global markets were not followed by crashes.Investor decision making under uncertainty involves a consideration of the probabilities offuture outcomes and attitudes about these outcomes. The bubbles that did not burst are just asimportant for investors to know about as bubbles that did burst. Placing a large weight on avoidinga bubble, or misunderstanding the frequency of a crash following a boom, is dangerous for the8
long-term investor because it foregoes the equity risk premium. If investors in the shares of theCasa di San Giorgio had sold out in 1603, they would have missed a 20 year boom in prices andwould have had to wait 80 years to be proven right.For regulators, the evidence raises the question of whether deflating a bubble is the rightcourse of action. If a bubble is associated with investment in new technologies with high economicpotential as well as high economic uncertainty, it forces a choice between guarding against afinancial crisis vs. allowing productive investment.This chapter presents a preliminary examination of bubbles in stock markets around theworld over the last 115 years. While economists often focus on a few representative andmemorable bubbles, the analysis presented here suggests there are dozens more we shouldinvestigate. The list in Table 3 is a good starting point for financial historians seeking tounderstand what factors determine whether a boom turns into a bust. Learning something aboutthe fundamentals underlying these other bubbles may help to more rationally assess the causes ofbooms and crashes and their consequences– economic, financial and regulation.9
Table 1: Summary Statistics for Global MarketsData sources: (1) Total return indices for stock markets in 21 countries over the period 1900 to 2014, converted to U.S. dollars, provided by Dimson, Marsh and Staunton [DMSGlobal] via Morningstar. (2) Real capital appreciation indices for 18 countries from 1919 onwards used in Jorion & Goetzmann (1999) and available on the website of the ICF. It isconstructed from indices reported in League of Nations and United Nations periodicals, augmented with published IFC data. (3) Total return indices in U.S. dollars for Russia andChina from the International Center for Finance (ICF) at the Yale School of Management, constructed from official publications and/or newspaper sources. Jorion-Goetzmann &ICF indices are augmented for recent years by the FTSE and IFC country dollar-denominated stock market appreciation indices as available via ndsNew ZealandNorwayPortugalSouth AfricaSpainSwedenSwitzerlandUnited KingdomUnited 141900-20141900-2014averagemedianstd G&FTICF&FTICF & 20141928-20141937-20141935-20141942-1977, 1989-20141937-19431938-20071920-1944, 1995-20141930-1939, 1998-20141926-1940, 1995-20141922-1938, 1993-20141938-1940, 2006-20141938-1961, 1995-20141951-20141900-1940, 1994-20141900-1913, .70-1.00-1.00averagemedianstd 211.252.271.381.910.327.45-0.76-0.730.20-1.00-0.26
Table 2: What happened when a stock market doubled or halved in valueA boom is defined as either (1) a return of more than 100% to a stock market index within a single year, defied according to availability inreal or dollar-valued and total or capital appreciation only or (2) a return of more than 100% to a stock market index within a three yearcalendar period, defied according to availability in real or dollar-valued and total or capital appreciation only. A bubble is a boom followed bya bust, defined as either (1) more than a 50% decline in index value in the following year or (2) more than a 50% decline over the followingfive years. The conditional bubble frequency is the percentage of booms followed by a bust. A crash is similarly defined as a decline in realor dollar-valued and total or capital appreciation of a market index within a one year or a three year calendar period. Missing observationsdue to interruption of market are deleted from frequency calculation. Data sources are reported in Table 1.100% Real One-Year Price IncreaseT 0CountMarket-Year Counts (frequencies)Double in valueHalve in valueYears with a 100% real price increaseCount338772Counts (frequencies) of doubling84-7263Counts (frequencies) of halvingYears with subsequent a -50% declineCounts (frequencies) of doublingCounts (frequencies) of halving33086873T %1911752772.48%13.16%6.58%Count0.30%0.15%T 80%0.21%
Table 2 Continued: 100% Real Three Year Price IncreaseT 0Counts (frequencies)Double again in valueHalve in valueThree year periods with a 100% increaseCounts (frequencies) of doublingCounts (frequencies) of subsequent halvingThree year periods with a -50% declineCounts (frequencies) of doublingCounts (frequencies) of subsequent halvingT 1CountCount3271318670744601721178156460203T 21.73%10.42%3.00%1.44%5.47%47.49%7.82%2.60%0.43%
Table 3: Markets that doubled in value in dollar (or real) terms in a calendar yearThis table reports the cumulated dollar-valued capital appreciation return to markets following a calendar year in which the dollar-valued index level at least doubled. Subsequentevent-years in which the index value doubled again are highlighted in green. Subsequent event years in which the index gave back all or more of its one year gain at some pointin the next five years are highlighted in pink. Values are sorted on event-year five cumulative capital appreciation BrazilAustriaColombiaUnited anyFinlandGermanyChileColombiaSouth 21.302
Bubble Investing: Learning from History William N. Goetzmann NBER Working Paper No. 21693 October 2015, Revised January 2016 JEL No. G01,G14,N2 ABSTRACT History is important to the study of financial bubbles precisely because they are extremely rare events, but history can be misleading. The rarity of bubbles in the historical record makes the .