Transcription
Technical Report Documentation Page1. Project No.2. Government Accession No.3. Recipient's Catalog No.SWUTC/14/161305-14. Title and Subtitle5. Report DateStrategic Transportation Finance ClearinghouseMay 20146. Performing Organization Code7. Author(s)8. Performing Organization Report No.Robert Farley, Dr. David Ellis, Allison Weldon161305-19. Performing Organization Name and Address10. Work Unit No. (TRAIS)Texas A&M Transportation InstituteThe Texas A&M University System3135 TAMUCollege Station, TX 77843-313511. Contract or Grant No.1072712. Sponsoring Agency Name and Address13. Type of Report and PeriodCoveredSouthwest Region University Transportation CenterTexas A&M Transportation InstituteTexas A&M University SystemCollege Station, Texas 77843-3135Final Report14. Sponsoring Agency Code15. Supplementary NotesSupported by general revenues from the State of Texas16. AbstractBetween now and 2030, there will be a significant gap, well in excess of 100 million, betweenthe amount of revenue needed to funded infrastructure projects and the amount of revenueavailable to fund those projects in Texas. At the same time, there is private capital seeking toinvest in infrastructure projects. Despite the need for capital on the part of the public sector andthe willingness to supply capital on the part of the private sector, to date, there have been onlya limited number of public-private partnership projects. This paper seeks to begin a process toconstruct an environment in which more projects can be funded with private capital to thebenefit of both the public and private sectors.17. Key Word18. Distribution StatementPublic-private PartnershipNo restrictions. This document is availableto the public through NTIS:National Technical Information ServiceAlexandria, Virginiahttp://www.ntis.gov19. Security Classif. (of this report)20. Security Classif. (of this page)21. No. of PagesUnclassifiedUnclassified44Form DOT F 1700.7 (8-72)22. PriceReproduction of completed page authorized
Strategic Transportation Finance ClearinghouseByRobert FarleyDr. David EllisAllison WeldonReport 161305-1Project Title: Strategic Transportation Finance ClearinghouseSponsored bySouthwest Region University Transportation CenterTexas A&M Transportation InstituteThe Texas A&M University SystemCollege Station, Texas 77843-3135May 2014
iv
AcknowledgmentSupport for this research was provided by a grant from the U.S. Department of Transportation,University Transportation Centers Program to the Southwest Region University TransportationCenter which is funded, in part, with general revenue funds from the State of Texas.DisclaimerThe contents of this report reflect the views of the authors, who are responsible for the facts andthe accuracy of the information presented herein. This document is disseminated under thesponsorship of the Department of Transportation, University Transportation Centers Program inthe interest of information exchange. The U.S. Government assumes no liability for the contentsor use thereof.v
vi
TABLE OF CONTENTSList of Figures . viiiList of Tables . viiiExecutive Summary . ix1.0 Background . 11.1 Current State of the U.S. Transportation System . 11.1.1 Desperate Need for Funding . 41.1.2 Untapped Investment Solution. 41.1.3 Behind the Curve . 51.1.4 Uncovering the Knowledge Gap . 61.1.5 Bridging the Gap . 62.0 The Problem . 92.1 A Texas Perspective . 92.1.1 The Challenge Facing Texans . 92.1.2 Texas Transportation Action Principles. 112.1.3 Four Transportation Scenarios—Texas’ Alternative Futures . 122.1.4 How Will Texans Pay for Transportation? . 132.1.5 Total Scenario Costs and Deficits . 142.2 Recent Legislative Action in Texas . 173.0 Approach and Methodology . 193.1 Objectives of Study . 193.2 Methodology/Work Plan . 194.0 Results to Date . 215.0 Preliminary Conclusions: A Necessary Shift in Thinking . 25Appendix A: Public-Private Partnership in Detail . 27Appendix B: Legislative Action in Texas . 31References . 33vii
List of FiguresFigure 1. Vehicle Miles Traveled and Lane Miles in the United States, 1980–2010. . 2Figure 2. The Road Home: Average daily commuting time, minutes per day Selectedcountries, latest available year. . 3Figure 3. Motor Fuel Revenue (Billions of 2010). . 11Figure 4. Statewide Total Transportation Costs between 2011 and 2035 (Billions of 2010). . 13Figure 5. Average Annual Household Transportation Costs, 2011 to 2035 ( 2010). . 14Figure 6. Proposed Structure for Strategic Transportation Clearinghouse. . 23List of TablesTable 1. Worldwide PPP Infrastructure Projects from 1985-2004 by Project Type . 5Table 2. On-Time Performance of Highway PPPs in New South Wales, Australia. . 7Table 3. Statewide Total Implementation Costs for Scenarios (Billions of 2010). . 15Table A-1. Major Types of Public-Private Partnerships. . 27Table A-2. Project Delivery Approaches. . 28Table A-3. PPP Success Factors. . 30Table B-1. Transportation Funding Legislation in Texas. . 31viii
Executive SummaryOften there is a disconnect between public entities at the local level seeking access to privateentities seeking to fund infrastructure projects. This condition limits the number of transportationprojects that otherwise could be funded with private investment and increases the demand forscarce public funds.States, metropolitan planning organizations (MPOs), and local city governments continue tostruggle to find sufficient funding for transportation projects. At the same time, an increasingamount of private capital is seeking viable transportation projects to fund. A 2011 book, Road toRenewal by Richard Geddes, recorded over 30 infrastructure funds prepared to invest in U.S.transportation infrastructure projects with a levered investment potential of 475 billion, while70 new funds were preparing to enter the transportation infrastructure market.Despite the opportunity that exists to access private capital and the willingness of public entitiesto undertake projects, few parties on either side of the potential transaction have participated inactual projects. We believe the reason is because of a knowledge gap between private sectorinvestors who seek to invest and the state, regional, and local governments that seek to fundtransportation projects.This knowledge gap manifests itself in two ways: (1) investment funds (particularly U.S.investment funds) are relatively new to the transportation arena and are not necessarily familiarwith the organizations and planning processes that lead to or constrain project development, and(2) regional and local transportation planning entities are not familiar with the analyticalprocesses and evaluation criteria investment firms use to make judgments relative to projectviability or the project characteristics different firms will find attractive. Identifying ways to fillthat knowledge gap is the essence of this research project.ix
x
1.0 BackgroundAn identifiable disconnect exists between local public entities seeking access to private capitalfor transportation projects and private entities seeking to fund infrastructure projects. Astransportation needs increase in Texas and across the nation, this disconnect creates anunnecessary barrier, impeding the number of viable transportation projects from securingfunding. When private investment is excluded from the transportation industry, the strain on apublic transportation system already overwhelmed with demand and inadequate funding isfurther exacerbated.This funding gap, which currently amounts to hundreds of millions of dollars in the U.S. andTexas, is certain to increase exponentially in the next decade. In order to formulate a realisticperspective and develop workable, efficient, innovative solutions to the problems facingtransportation, it is important to first explore why the current barriers exist between the publicand private sectors in regard to transportation funding and infrastructure development exists.1.1 Current State of the U.S. Transportation SystemUnderstanding the current state of the U.S. transportation system is an essential first step thathighlights the urgent need to search out untapped resources, namely the potential of publicprivate partnerships (PPPs). Contending with the growing demand for transportationinfrastructure development and preservation is becoming increasingly difficult for stategovernments, metropolitan planning organizations (MPOs), and local governments across thenation.1
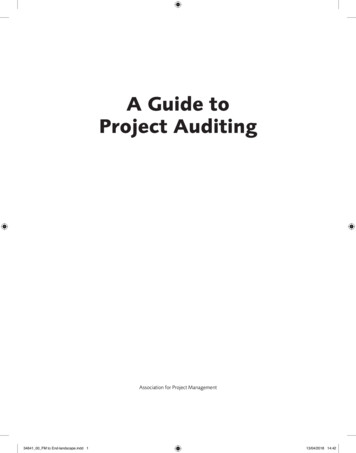
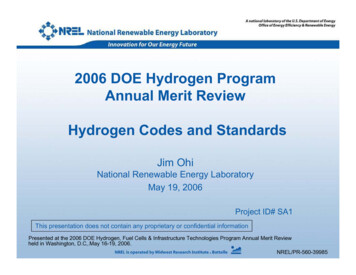
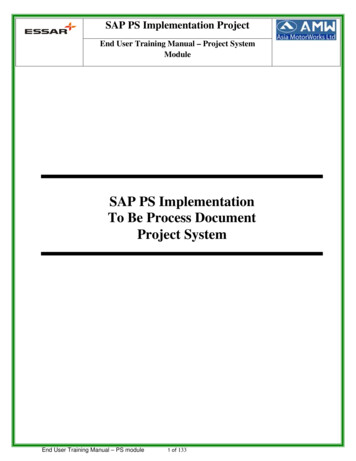
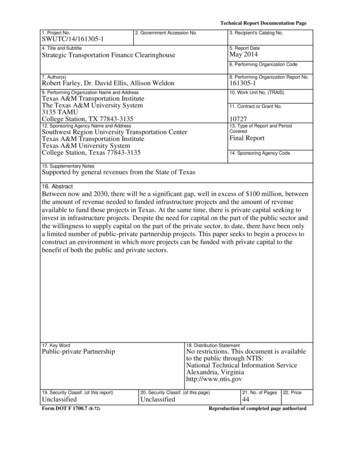
VMT Index/Lane Mile Index (1980-100)250VMTLane 9419921990198819861984198219800Source: figure adapted from FHWA Highway Statistics Series 2010: HM-260 Public road lane-miles by functionalsystem 1980–2010, VM-202 Vehicle-miles of travel by functional system 1980–2010 (1).Figure 1. Vehicle Miles Traveled and Lane Miles in the United States, 1980–2010.One of the principal issues facing the U.S. transportation system is the exponential increase inroadway usage in the past several decades. Between the years of 1990 and 2007, the amount ofvehicular miles traveled in the United States has doubled (Figure 1). Disproportionately, theamount of lane miles across the country has increased by less than 10 percent (1). This majordisparity increases congestion on the roadways and contributes to inaccessibility concerns aswell as public safety threats. Instead of using the transportation system as a means to ease growthtransitions and encourage economic development, it is ultimately being ignored, creatingsignificant problems nationwide.One symptom of this growth problem can be easily seen in the time Americans spend on theroad. In fact, as shown in Figure 2, the average commute time per day in the United States isestimated at 49 minutes, more than the vast majority of European countries including theNetherlands, Poland, Germany, Sweden, Spain, and Britain (2). Italy’s current commute time isdrastically shorter than the average in the United States, at an estimated 32 minutes (2). This2
added amount of commuting time incurs additional fuel costs, takes a higher toll on theenvironment, and decreases productivity, i.e., time spent on the road that could be time spent atwork. Quality roadways are needed to keep pace with the growing population in order to bringthe commute time in the U.S. down to an amount comparable to the other primary worldeconomies.HungaryRomaniaUnited aly0102030Time (minutes)405060Sources: chart adapted from European Survey on Working Conditions; U.S. Census Bureau (2).Figure 2. The Road Home: Average daily commuting time, minutes per day,Selected countries, latest available year.Another problem facing the current transportation system is the decaying condition of theinfrastructure currently in place. The 2013 Infrastructure Report Card, released by the AmericanSociety of Civil Engineers, shows a dismal assessment of our current transportation system. Itreported that an estimated 32 percent of highways in the United States are considered to be inpoor or mediocre condition, which costs Americans billions of dollars a year (3). In addition over10 percent of the bridges in the United States are classified as structurally deficient (3).The combination of rapid population growth and the current deterioration of transportationinfrastructure creates a complex problem. Given these conditions, governments can only focuson maintaining the existing aging infrastructure instead of responding to needs with new, critical3
infrastructure. Unfortunately, the United States is far from even being able to maintain thecurrent status quo.1.1.1 Desperate Need for FundingAs previously discussed, the demand for transportation infrastructure projects is exceedinglyhigh and continuing to grow as our nation’s needs grow. Unfortunately, in most places, publicfunding for transportation is dramatically low, resulting in a standstill in project development andcompletion. The Congressional Budget Office estimates that another 20 billion needs to beinvested annually in order to just maintain the current failing infrastructure (2). Not only is theUnited States not in a position financially to improve the current system, but if immediate actionis not taken, the system’s current conditions will continue to worsen.Combined governmental investment in transportation infrastructure currently equals 91 billion,or only 50 percent of the funding needed (3). Moreover, the problem is estimated to not onlycontinue, but to worsen. In fact, it is estimated that the federal highway and transit funding gapwill total nearly 400 billion in 2010–2015 but will increase to an estimated 2.3 trillion through2035 (4). This exponential increase in unmet transportation needs will have lasting effects,hindering the growth of the U.S. economy. Alternative sources of capital exist in the privatesector but are currently excluded from the transportation market. The introduction of these fundscould provide immediate aid to the decaying transportation infrastructure and help close thecurrent funding gap.1.1.2 Untapped Investment SolutionToday, a sizeable amount of private capital seeks viable transportation projects to fund, and thenumber of interested firms continues to increase. A 2010 report indicated there were over 30private funds ready to directly invest in U.S. transportation infrastructure projects with a leveredinvestment potential of 475 billion (1). Moreover, there are an additional 70 new fundspreparing to enter the transportation infrastructure market (1). The total amount of investmentdedicated to infrastructure has also grown rapidly, tripling from 2006–2009, and continues to rise(1). If this trend continues and private funds are invested wisely, an important shift will occurfrom using almost exclusively public dollars to using a combined, cooperative model with the4
private and public sectors. There are several types of partnerships and project delivery methodsthat exist to bring the public and private sectors together (shown in Appendix A). Theintroduction of these private funds into the market could revive the industry, drasticallyimproving our current transportation capacity. Now, more than ever, a strong transportationindustry is crucial to economic vitality and competition.1.1.3 Behind the CurveDespite the opportunity that exists to access private capital and the willingness of public entitiesto undertake projects, few parties on either side of the potential transaction have participated inactual projects. The U.S. is not alone in looking at ways in which public-private partnerships(PPPs) could be successful; many countries are ahead of the curve in bridging this funding gap intheir respective nations. Between 1985 and 2009, the United States funded only 77 U.S. highwayPPP projects with an estimated value of 85 billion. The global perspective is entirely different;during that same period, 580 billion was spent on PPPs by other countries (1). As shown inTable 1, the use of public-private partnerships on an international scale has become a largemarket. The leading mode funded by PPPs is largely road transport projects.Table 1. Worldwide PPP Infrastructure Projects from 1985–2004 by Project gTotalTotal Planned & Funded Since1985#% Billion%65631% 324.7 37%24712% 280.6 32%1829% 88.0 10%1427% 39.54%61629% 95.4 11%23512% 59.27%2096 100% 887.4 100%Total Funded & Completed by2004#%%Billion%35932% 157.3 35%10710% 143.7 32%676% 49.5 11%444% 10.62%39135% 62.8 14%15314% 27.06%1121 100%450.9 100%% Funded &Completed by2004% of #% of 55%48%43%51%37%56%31%27%63%66%60%46%53%51%Source: (5).The United States has remained a minimal player in the market, with countries such as Australia,France, Japan, Spain, Portugal, and the United Kingdom leading the way (1). With a number ofprivate firms waiting in the wings to leverage a potential investment of 450 billion in U.S.transportation projects, the opportunity exists for the United States to take a larger role andbecome the global leader in developing successful PPPs. The central obstacle preventing theUnited States from becoming a global PPPs leader is the current knowledge gap that exists5
among both private sector investors who seek to invest and the state, regional, and localgovernmental entities seeking to fund transportation projects.1.1.4 Uncovering the Knowledge GapThis knowledge gap prevents successful partnerships from existing for two fundamental reasons.First, investment funds, particularly U.S. investment funds, are relatively new to thetransportation arena and are unfamiliar with the organizations and planning process that can leador constrain policy development. They would enter an investment world that looks entirelyunlike the one in which they are used to securing deals and completing projects. Individuals usedto working in the private sector may find the public sector to be heavily bureaucratic and boggeddown in extraneous processes. The tendency is for private sector individuals to move onto otherprivate investments with which they are more familiar.Conversely, the knowledge gap exists and is perpetuated by the reality that regional and localtransportation planning entities are not familiar with the analytical process and evaluation criteriainvestment firms use. Public sector organizations have little appreciation or insight into thejudgments the private sector makes relative to project viability or with the diverse projectcharacteristics that different firms will find attractive. This disconnect prevents public sectorentities from discerning and acting upon good opportunities with private sector investors. Theability to communicate between these two sectors will promote mutual understanding and willaid in closing this knowledge gap.1.1.5 Bridging the GapOther market sectors have successfully bridged the gap between public and private sector to formlasting, profitable partnerships. By working together, both sectors can capitalize on combinedstrengths while minimizing weaknesses as both sectors bring valuable assets to decision makingand project implementation.6
Table 2. On-Time Performance of Highway PPPs in New South Wales, Australia.M4ProjectOpenedMay 1992Scheduled Opening Time SavedFebruary 19939 monthsM5August 1992February 199418 monthsAugust 1992On timeSydney Harbour Tunnel August 1992M2Eastern DistributorMay 1998November 1997December 1999 August 20006 months8 monthsCross City TunnelAugust 20052 monthsWestlink M7December 2005 August 20068 monthLane Cove TunnelMarch 20072 monthsOctober 2005May 2007Total time saved53 monthsSource: chart adapted from table 10 of (6).Combining the speed and efficiency of the private sector with the experience, transparency, andaccountability of the public sector creates an ideal situation for mutually beneficial projects tosucceed in the marketplace. One tangible example of these two sectors working well together toimprove project delivery is illustrated by Australia’s two decades of experience. According toone study, titled Performance of PPPs and Traditional Procurement in Australia, traditionalprojects typically were completed at an estimated 24 percent behind schedule, while PPPs weregenerally completed before schedule, saving time and money while improving the conditions ofthe transportation system (Table 2) (1).The two sectors have a long-standing history in the United States of effectively working togetherto fund major capital projects including water systems, sports stadiums, and local roadwaysystems using general obligation bond debt packages. However, non-traditional and innovativefunding solutions exist, giving PPPs more options and greater opportunities. PPP contractscontain an array of variables offering changeable degrees of private involvement in each phase ofinfrastructure projects including, but not limited to, designing, building, operating, maintaining,and financing. Options for contractual agreements between the public and private sector areexpansive, allowing for flexibility and control, and increasing the likelihood of success.While there are many examples of public-private partnerships in transportation overseas, U.S.experience is more limited. A few innovative public-private partnership infrastructure projectsinclude the Chicago Environmental and Transportation Efficiency Program (CREATE), theSouth Bay Expressway in San Diego, California, the Foley Beach Express in Foley, Alabama,7
and the Reno Transportation Rail Access Corridor in Reno, Nevada (7). A more systematic andsustained effort to matching the strengths of the public and private sectors will likely helpprovide a significant boost to new PPP funding for U.S. transportation projects.8
2.0 The Problem2.1 A Texas Perspective2.1.1 The Challenge Facing TexansThe trends facing the U.S. have also played out in most states across the country, but nowhereare these macro trends more evident than in Texas. Texas has experienced more than 40 years ofstrong economic growth. Strategic transportation investments have played a significant role inenabling Texans to live and work where they choose and efficiently transport goods to marketsand manufacturers. Unfortunately, transportation investments have not kept pace with the state’sgrowth. Subdivisions, office buildings, schools, and other travel destinations are often builtwithout sufficient facilities to accommodate the travel created by these developments. Increasingtraffic problems in rush hours, and even in the middle of the day in some cities, are only onesymptom of the investment gap. Factors impacting the quality of Texas transportation include: Burgeoning population and job growth—The 15 million new Texans projected toarrive over the next 25 years means Texans will need to make more transportationinvestments. More freight being moved—Freight traffic is expected to grow at twice the rate ofpassenger vehicle traffic as the Texas economy grows over the next 25 years. Trucksand trains in rural and urban corridors are a key part of the economy and must travel onreliable timetables. If freight does not move efficiently in Texas, the state will lose jobsto areas where freight moves more easily. Road preservation concerns—It is cheaper to keep roads in good condition than to fixthem after they deteriorate. Maintaining transportation facilities is similar to maintaininga vehicle; it is easier and cheaper to change the oil and filter than to burn out the motorand then replace it. The projections show that many road miles will require costlyrebuilding even if the best efforts are made to preserve them through the most costeffective maintenance programs. Increased time and costs for system improvement—Waiting until transportationproblems escalate will mean higher costs for transportation system improvements. Majortransportation projects can take years to plan, design, and build.9
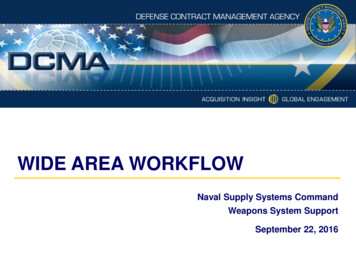
Deficient bridges—Most Texas bridges that are deficient do not collapse completely.Instead, they have weight restrictions placed on them. Increasingly restrictive weightlimits are inconvenient to the traveling public and result in increased costs for freightand commercial vehicles. Significant erosion in traditional funding—Income from traditional transportationfunding sources (taxes and fees) is no longer sufficient to keep pace with current andprojected highway construction and maintenance cost increases. Recent one-time funding infusions breed complacency—Recent one-time fundinginfusions from a variety of sources have enabled road and bridge conditions to bemaintained, even while traditional funding sources have declined. Urban trafficcongestion grew during the last decade; it recently declined with the economic recessionbut is on the rise again. The one-time funding infusions make it too easy to overlook theproblems certain to face Texas in the near future.Adding to funding and growth challenges, today’s more fuel-efficient vehicles pay lower fueltaxes per mile than when the tax rates were set almost two decades ago. While they offer benefitssuch as leaving a smaller carbon footprint and allowing Texans to travel farther per gallon,increasingly fuel-efficient cars and trucks generate less income from motor fuel taxes to fund therising demands on Texas roadways. As Figure 3 shows, Texans will not be able to count on everincreasing fuel tax revenues as they have in the past.10
Source: chart adapted from Texas Comptroller of Public Accounts and TxDOT TRENDS Models (8).Figure 3. Motor Fuel Revenue (Billions of 2010).2.1.2 Texas Transportation Action PrinciplesTo some extent the principles for an improved transportation finance system are already beingdeveloped. A committee on the future of Texas transportation, the 2030 Committee, was formedin 2008 and issued a set of findings on the subject. The Committee believes that theresponsibility of choosing individual transportation projects belongs with local and state officialswho have access to the expertise and necessary information, and are in touch with prevailingpublic opinion. Nonetheless, the Committee believes that certain principles should guideinvestments in the state’s transportation programs. It used these principles to identify methods toselect transportation projects (without choosing individual projects), establish appropriatefunding levels, and ensure accountability with Texans: First and foremost, preserve Texas’ existing substantial investment in transportationinfrastructure. Ensure Texas is getting bang-for-the-buck in using its transportation system. Involve transportation users and employers in transportation solutions. Attack problems and seize opportunities. Display results and support accountability.11
Require users to pay for services they consume. Make timely decisions about transportation investment levels enhancing fundingflexibility and preserving traditional tax based solutions.Adding more PPP funding opportunities to this mix of solutions is entirely in line with theseprinciples, and a potential key component of the financing and management solutions that willkeep the Texas transportation system competitive now and in the future.2.1.3 Four Transportation Scenarios—Texas’ Alternative FuturesThe Committee studied four transportation quality scenarios for pavement and bridge conditionsand urban and rural system performance to illustrate the choices that Texans face between nowand 2035. A letter grade was assigned to each scenario ranging from F to B. The strategies rangefrom doing nothing new to implementing enough programs and projects to maintain conditionsas they are now. The Committee did not assign a letter grade of A to any scenario due to thesignificant funding required to achieve this level of quality for the transportation system. GRADE F: Unacceptable Conditions—The current policies, planning processes, andfund
Source: figure adapted from FHWA Highway Statistics Series 2010: HM-260 Public road lane-miles by functional system 1980-2010, VM-202 Vehicle-miles of travel by functional system 1980-2010 (1). Figure 1. Vehicle Miles Traveled and Lane Miles in the United States, 1980-2010.