Transcription
Chapter 1260Sight Distance1260.01 GeneralExhibit 1260-4 Stopping Sight Distance: Crest Vertical Curves1260.02 ReferencesExhibit 1260-5 Sight Distance: Crest Vertical Curve1260.03 Stopping Sight Distance (Eye height – 3.5 ft, Objectheight – 2.0 ft)Exhibit 1260-6 Stopping Sight Distance for Sag Vertical Curves1260.04 Passing Sight Distance (Eye height – 3.5 ft, Objectheight – 3.5 ft)Exhibit 1260-8 Horizontal Stopping Sight Distance1260.05 Decision Sight Distance (Eye height – 3.5 ft, Objectheight – 2.0 ft)Exhibit 1260-10 Existing Stopping Sight Distance1260.06 DocumentationExhibit 1260-1 Design Stopping Sight DistanceExhibit 1260-2 Design Stopping Sight Distance on GradesExhibit 1260-3 Stopping Sight Distance on GradesExhibit 1260-7 Sight Distance: Sag Vertical CurveExhibit 1260-9 Sight Distance: Horizontal CurvesExhibit 1260-11 Passing Sight DistanceExhibit 1260-12 Passing Sight Distance: Crest Vertical CurveCalculationsExhibit 1260-13 Passing Sight Distance: Crest Vertical CurvesExhibit 1260-14 Decision Sight Distance1260.01 GeneralSight distance allows the driver to assess developing situations and take actions appropriate for the conditions.Sight distance relies on drivers being aware of and paying attention to their surroundings and drivingappropriately for conditions presented. For the purposes of design, sight distance is considered in terms ofstopping sight distance, passing sight distance, and decision sight distance.For additional information, see the following:Chapter 1250 Sight distance at railroad crossingsChapter 1310 Sight distance at intersections at gradeChapter 1320 Sight distance at roundaboutsChapter 1340 Sight distance at drivewaysChapter 1515 Sight distance for shared-use paths1260.02 References1260.02(1) Design GuidanceManual on Uniform Traffic Control Devices for Streets and Highways, USDOT, FHWA; as adopted and modified byChapter 468-95 WAC “Manual on uniform traffic control devices for streets and highways” (MUTCD)1260.02(2) Supporting InformationA Policy on Geometric Design of Highways and Streets (Green Book), AASHTOPassing Sight Distance Criteria, NCHRP 605WSDOT Design Manual M 22-01.20September 2021Page 1260-1
Chapter 1260Sight Distance1260.03 Stopping Sight Distance (Eye height – 3.5 ft, Object height – 2.0 ft)1260.03(1) Design CriteriaStopping sight distance is provided when the sight distance available to a driver equals or exceeds the stoppingdistance for a passenger car traveling at the design speed.Stopping distance for design is very conservatively calculated, with lower deceleration and slower perceptionreaction time than normally expected from the driver. Provide design stopping sight distance at all points on allhighways and on all intersecting roadways, unless a design deviation is deemed appropriate.1260.03(1)(a) Stopping Sight DistanceStopping sight distance is the sum of two distances: the distance traveled during perception and reaction timeand the distance to stop the vehicle. The perception and reaction distance used in design is the distance traveledin 2.5 seconds at the design speed.The design stopping sight distance is calculated using the design speed and a constant deceleration rate of 11.2feet/second2. For stopping sight distances on grades less than 3%, see Exhibit 1260-1; for grades 3% or greater,see Exhibit 1260-2.1260.03(1)(b) Design Stopping Sight DistanceExhibit 1260-1 gives the design stopping sight distances for grades less than 3%, the minimum curve length for a1% grade change to provide the stopping sight distance for a crest (Kc) and sag (Ks) vertical curve, and theminimum length of vertical curve for the design speed (VCLm). For stopping sight distances when the grade is 3%or greater, see Exhibit 1260-2.WSDOT Design Manual M 22-01.20September 2021Page 1260-2
Chapter 1260Sight DistanceExhibit 1260-1 Design Stopping Sight DistanceDesign Speed(mph)Design StoppingSight Distance (ft)KcKsVCLm 842312401260.03(2) Effects of GradeThe grade of the highway has an effect on the stopping sight distance. The stopping distance is increased ondowngrades and decreased on upgrades. Exhibit 1260-2 gives the stopping sight distances for grades of 3% andsteeper. When evaluating sight distance with a changing grade, use the grade for which the longest sightdistance is needed.Exhibit 1260-2 Design Stopping Sight Distance on GradesStopping Sight Distance (ft)Design 6704809651,0351,121859817782WSDOT Design Manual M 22-01.20September 2021DowngradePage 1260-3
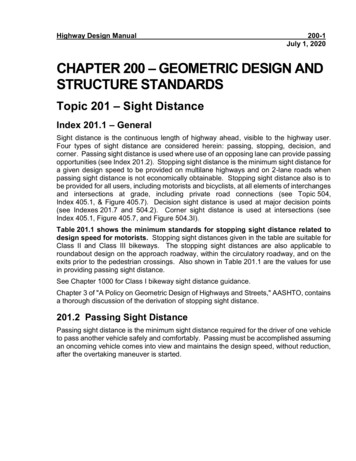
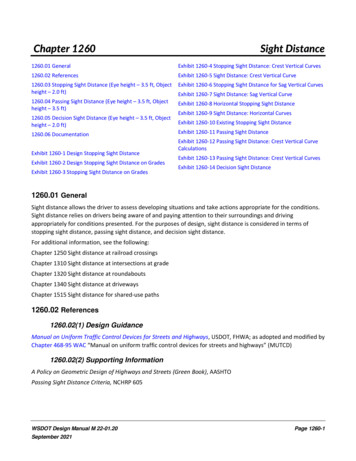
Chapter 1260Sight DistanceFor stopping sight distances on grades between those listed, interpolate between the values given or use theequation in Exhibit 1260-3.Exhibit 1260-3 Stopping Sight Distance on Grades𝑆 1.47𝑉 (2.5) 𝑉2𝐺30 [0.347826 (100)]Where:S Stopping sight distance on grade (ft)V Design speed (mph)G Grade (%)1260.03(3) Crest Vertical CurvesWhen evaluating an existing roadway, refer to Section 1260.03(7).Use Exhibit 1260-4 or the equations in Exhibit 1260-5 to find the minimum crest vertical curve length to providestopping sight distance when given the algebraic difference in grades. Exhibit 1260-4 does not show the sightdistance greater than the length of curve equation.When the sight distance is greater than the length of curve and the length of curve is critical, the S L equationgiven in Exhibit 1260-5 shall be used to find the minimum curve length.When a new crest vertical curve is built or an existing one is rebuilt with grades less than 3%, provide designstopping sight distance from Exhibit 1260-1. For grades 3% or greater, provide stopping sight distance fromSection 1260.03(2).WSDOT Design Manual M 22-01.20September 2021Page 1260-4
Chapter 1260Sight DistanceExhibit 1260-4 Stopping Sight Distance: Crest Vertical CurvesSObject height h2 2.0'Eye height h1 3.5'1225 4,Sphm502 5 mp h ,Algebraic Difference in Grade, A (%)1430 mS 155 ft.ph, S 200ft.35 mph,S 250 ft.40mph,S 305ft.45mph,S 360ft.16ft.The minimum length can also be determined by multiplying the algebraic difference in grades by the KC valuefrom Exhibit 1260-1 (L KC*A). Both the exhibit and the equation give approximately the same length of curve.Neither use the S L equation.55mph,S 549ft.61065p0mmp870h,57S 6 4h, Smpt.0f.5 ft 73h, S.0 ftft.820h, S pm.7510 ft, S 9hp80 m64200500100015002000Length of Vertical Curve, L (ft)WSDOT Design Manual M 22-01.20September 2021Page 1260-5
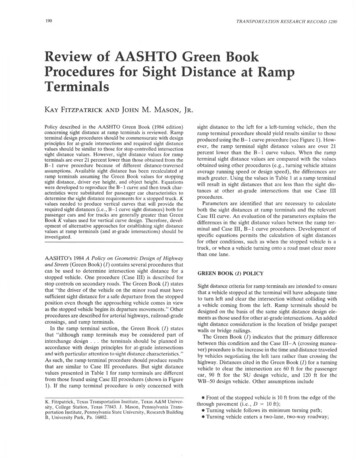
Chapter 1260Sight DistanceExhibit 1260-5 Sight Distance: Crest Vertical CurveWhen S L𝐿 2𝑆 When S L𝐿 21582158𝐴𝐴𝑆 2𝑆 𝐿 (𝑆 2158)𝐴22158𝐿𝐴Where:L Length of vertical curve (ft)S Sight distance (ft)A Algebraic difference in grades (%)1260.03(4) Sag Vertical CurvesWhen evaluating an existing roadway, refer to Section 1260.03(7).Sight distance is not restricted by sag vertical curves during the hours of daylight. Therefore, headlight sightdistance is used for the sight distance design criteria at sag vertical curves. In some cases, a lesser length may beallowed. For guidance, see Chapter 1220.Refer to Exhibit 1260-6 or the equations in Exhibit 1260-7 to find the minimum length for a sag vertical curve toprovide the headlight stopping sight distance when given the algebraic difference in grades. The value for S isshown as the distance between the vehicle and the point where a 1-degree angle upward of the headlight beamintersects with the roadway.The sight distance greater than the length of curve equation is not used in Exhibit 1260-6. When the sight distanceis greater than the length of curve and the length of curve is critical, the S L equation given in Exhibit 1260-7 shallbe used to find the minimum length of curve.When a new sag vertical curve is built or an existing one is rebuilt with grades less than 3%, provide designstopping sight distance from Exhibit 1260-1. For grades 3% or greater, provide stopping sight distance fromSection 1260.03(2).WSDOT Design Manual M 22-01.20September 2021Page 1260-6
Chapter 1260Sight DistanceExhibit 1260-6 Stopping Sight Distance for Sag Vertical CurvesS1 2.0'ft5ftph,S 3050mS 24540h,mp353012mpS 1525 mp h,14Algebraic Difference in Grade, A (%)h, S 205 ft160 ftThe minimum length can also be determined by multiplying the algebraic difference in grades by the KS valuefrom Exhibit 1260-1 (L KS*A). Both the exhibit and equation give approximately the same length of curve.Neither use the S L equation.m,ph36S 0ft50mph,42S 5ft55m49S ,pht5f6065mpmph 5,S70 64h, Sft5 ftft730 Sfth,mp S 82070h,ftmp91075, S hp80 h of Curve, L (ft)WSDOT Design Manual M 22-01.20September 2021Page 1260-7
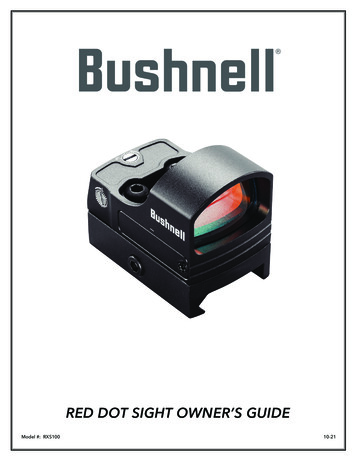
Chapter 1260Sight DistanceExhibit 1260-7 Sight Distance: Sag Vertical Curve400 3.5𝑆When S L𝐿 2𝑆 When S L𝐿 400 3.5𝑆𝐴𝐴𝑆 2𝑆 𝑆 𝐿𝐴 4002𝐴 3.53.5𝐿 (3.5𝐿)2 1600𝐴𝐿2𝐴Where:L Curve length (ft)A Algebraic grade difference (%)S Sight distance (ft)Note:Values for A less than 1.75 are within the 1-degree diverge of the headlight beam and therefore do not need tobe evaluated for SSD on sag curves.1260.03(5) Horizontal CurvesWhen evaluating an existing roadway, see Section 1260.03(7).Use Exhibit 1260-8 or the equation in Exhibit 1260-9 to check stopping sight distance where sightlineobstructions are on the inside of a curve. A stopping sight distance sightline obstruction is any roadside objectwithin the horizontal sightline offset (M) distance (such as median barrier, guardrail, bridges, walls, cut slopes,buildings or wooded areas), 2.0 feet or greater above the roadway surface at the centerline of the lane on theinside of the curve (h0). Exhibit 1260-8 and the equation in Exhibit 1260-9 are for use when the length of curve isgreater than the sight distance and the sight restriction is more than half the sight distance from the end of thecurve. Where the length of curve is less than the stopping sight distance or the sight restriction is near eitherend of the curve, the desired sight distance may be available with a lesser M distance. When this occurs, thesight distance can be checked graphically.WSDOT Design Manual M 22-01.20September 2021Page 1260-8
Chapter 1260Sight DistanceExhibit 1260-8 Horizontal Stopping Sight DistanceSight distance (S)MLine ofsightObstruction orbackslopeRadiusCenter of laneA sightline obstruction is any roadside object within the horizontal sightline offset (M) distance, 2.0 feet orgreater above the roadway surface at the centerline of the lane on the inside of the curve.506580mpft20 8,Sphftm3075 7,Stph5fm6470S h,ft70mp 5h, S60Lateral Clearance to Obstruction, M (ft)604030mph,S 910ft201025 mph, 30 mph, 35 mph,S 155 ft S 200 ft S 250 ft001,00040 mph,S 305 ft2,00045 mph,S 360 ft3,00050 mph,S 425 ft4,00055 mph,S 495 ft5,0006,000Curve Radius, R (ft)When the road grade is less than 3%, provide design stopping sight distance from Exhibit 1260-1. When thegrade is 3% or greater, provide stopping sight distance from Section 1260.03(2).WSDOT Design Manual M 22-01.20September 2021Page 1260-9
Chapter 1260Sight DistanceRoadside objects with a height (h0) between 2.0 feet and 2.75 feet might not be a stopping sight distancesightline obstruction. Objects with an h0 between 2.0 feet and 2.75 feet can be checked graphically to determinewhether they are stopping sight distance sightline obstructions.Where a sightline obstruction exists and site characteristics preclude design modifications to meet criteria,consult with the region Traffic Engineer and Assistant State Design Engineer for a determination of appropriateaction.Exhibit 1260-9 Sight Distance: Horizontal Curves𝑀 𝑅 [1 cos (28.65𝑆𝑅)]𝑆 𝑅28.65[cos 1 (𝑅 𝑀𝑅)]Where:M Horizontal sightline offset measured from the centerline of the inside lane of the curve to thesightline obstruction (ft)R Radius of the curve (ft)S Sight distance (ft)1260.03(6) Overlapping Horizontal and Vertical CurvesVertical curves on a horizontal curve have an effect on which roadside objects are sightline obstructions. Crestvertical curves make roadside objects more likely to become sightline obstructions. Sag vertical curves makeroadside objects less likely to be sightline obstructions.Exhibit 1260-10 can be used to determine the sight distance for crest vertical curves on horizontal curves with: Sightline obstructions inside the M distance.Sightline obstruction height (h0) of 2.0 feet or less.For other locations, the sight distance can be checked graphically.CL of laneIMILine ofSightRoadside sightlineobstruction 2.0' orless above CL of laneEdge of roadwayhOh1 3.5'WSDOT Design Manual M 22-01.20September 2021h2 2.0'Page 1260-10
Chapter 1260Sight DistanceThe following equation may be used to determine the sight distance for roadside sightline obstructions insidethe horizontal sightline offset (M) distance (see Exhibit 1260-9) with a height of 2.0 feet or less above thecenterline of the lane on the inside of the curve on overlapping horizontal and crest vertical curves.2100𝐿[ 2(ℎ1 ℎ0 ) 2(ℎ2 ℎ0 )]𝑆 𝐴Where:L Length of vertical curve (ft)S Sight distance (ft)A Algebraic difference in grades (%)h1 Eye height (3.5 ft)h2 Object height (2.0 ft)h0 Height of roadside sightline obstructions above the centerline of the inside curve lane (2.0ft or less)Note:The above equation cannot be used for sightline obstruction height (h0) more than 2.0 ft above the centerline ofthe lane on the inside of the curve. The available sight distance must be checked graphically for these sightlineobstructions.1260.03(7) Existing Stopping Sight DistanceExisting stopping sight distance values from Exhibit 1260-11 may be used at all horizontal and vertical curveswhere all of the following are met at the curve: There is no identified collision trend.The existing vertical and horizontal alignment is retained.The existing roadway pavement is not reconstructed.The roadway will not be widened, except for minor shoulder widening requiring no work past thebottom of the ditch.The sightline obstruction is existing.Roadside improvements to sight distance are within existing right of way.Crest Vertical Curves – The minimum length of an existing crest vertical curve may be found using the equationsin Exhibit 1260-5 or using the KC values from Exhibit 1260-11.Sag Vertical Curves – The minimum length of an existing sag vertical curve may be found using the equations inExhibit 1260-7 or using the KS values from Exhibit 1260-11.WSDOT Design Manual M 22-01.20September 2021Page 1260-11
Chapter 1260Sight DistanceExhibit 1260-10 Existing Stopping Sight DistanceDesign Speed(mph)Existing StoppingSight Distance 7054013512775585159140806301841521260.04 Passing Sight Distance (Eye height – 3.5 ft, Object height – 3.5 ft)1260.04(1) Design CriteriaMinimum passing sight distance is the distance (on a two-lane highway) used for a driver to execute a normalpassing maneuver based on design conditions and design speed.The potential for passing maneuver conflicts is ultimately determined by the judgments of the driver and theconditions present at the time of the maneuver. Exhibit 1260-12 gives the passing sight distances for variousdesign speeds.Exhibit 1260-11 Passing Sight DistanceDesign Speed (mph)20253035404550556065707580WSDOT Design Manual M 22-01.20September 2021Minimum Passing Sight Distance ge 1260-12
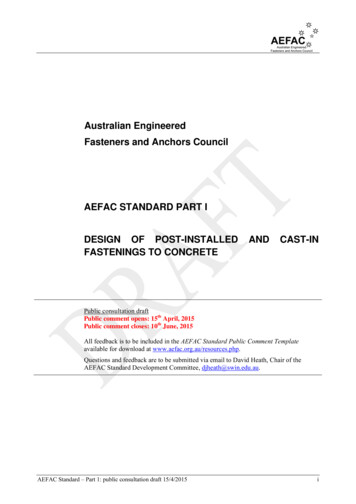
Chapter 1260Sight DistanceOn two-lane two-way highways, provide passing opportunities to meet traffic volume demands. This can beaccomplished with roadway sections that provide passing sight distance or by adding passing lanes at locationsthat would provide the greatest benefit to passing (see Chapter 1270).In the design stage, passing sight distance can be provided by adjusting the alignment either vertically orhorizontally to increase passing opportunities.These considerations also apply to multilane highways where staged construction includes a two-lane two-wayoperation as an initial stage. Whether auxiliary lanes are provided, however, depends on the time lag proposedbetween the initial stage and the final stage of construction.1260.04(2) Passing Sight Distance Vertical CurvesExhibit 1260-14 gives the length of crest vertical curve used to provide passing sight distance for two lanehighways. The distance from Exhibit 1260-12 and the equations in Exhibit 1260-13 may also be used todetermine the minimum length of vertical curve to meet the passing sight distance criteria.Sag vertical curves are not a restriction to passing sight distance.Exhibit 1260-12 Passing Sight Distance: Crest Vertical Curve CalculationsAEye height h1 3.5'Object height h2 3.5'SWhen S L𝐿 2𝑆 2800𝐴𝐿𝑆 2 1400𝐴When S L𝐴𝑆 2𝐿 2800𝑆 2800𝐿𝐴Where:L Length of vertical curve (ft)A Algebraic grade difference (%)S Sight distance (ft)WSDOT Design Manual M 22-01.20September 2021Page 1260-13
Chapter 1260Sight DistanceExhibit 1260-13 Passing Sight Distance: Crest Vertical Curvesftft,S 1,47080 1,240mphh,Smph,mp35730ph ,825 mAlgebraic Difference in Grade, A (%)S 99S 1,0900 ft0ft1045m,phS 12,65ftp0mh,31,8 St5fft859,1S h,p5 ftm,13552S ph,5 ftm,28260 h, Sftmp65,4802 Sph ,70 9,00010,000Length of Vertical Curve, L (ft)1260.04(3) Passing Sight Distance Horizontal CurvesPassing sight distance can be restricted on the inside of a horizontal curve by sightline obstructions that are 3.5feet or more above the roadway surface. Use the distance from Exhibit 1260-12 and the equation in Exhibit1260-9 to determine whether the object is close enough to the roadway to be a restriction to passing sightdistance. The equation assumes that the curve length is greater than the sight distance. Where the curve lengthis less than the sight distance, the desired sight distance may be available with a lesser sightline offset (M)distance.1260.05 Decision Sight Distance (Eye height – 3.5 ft, Object height – 2.0 ft)Decision sight distance values are greater than stopping sight distance values because they give the driver anadditional margin for error and afford sufficient length to maneuver at the same or reduced speed rather thanto just stop.WSDOT Design Manual M 22-01.20September 2021Page 1260-14
Chapter 1260Sight DistanceConsider decision sight distances (see Exhibit 1260-14) at locations where there is high likelihood for driver errorin information reception, decision making, or control actions. If site characteristics and budget allow, locatethese highway features where decision sight distance can be provided. If this is not practicable, use suitabletraffic control devices and positive guidance to give advanced warning of the conditions.Exhibit 1260-14 Decision Sight DistanceDecision Sight Distance for Maneuvers (ft)Design 545809701685126014551650The maneuvers in Exhibit 1260-14 are as follows:A Rural stopB Urban stopC Rural speed/path/direction changeD Suburban speed/path/direction changeE Urban speed/path/direction changeUse the equations in Exhibit 1260-5, Exhibit 1260-7, and Exhibit 1260-9 to determine the available decision sightdistance for crest vertical curves, sag vertical curves, and horizontal curves.1260.06 DocumentationIt is recognized that some designs do not allow all criteria and guidelines to be followed as outlined in thischapter.Refer to Chapter 300 for design documentation requirements.WSDOT Design Manual M 22-01.20September 2021Page 1260-15
The perception and reaction distance used in design is the distance traveled in 2.5 seconds at the design speed. The design stopping sight distance is calculated using the design speed and a constant deceleration rate of 11.2 feet/second2. For stopping sight distances on grades less than 3%, see Exhibit 1260-1; for grades 3% or greater,