Transcription
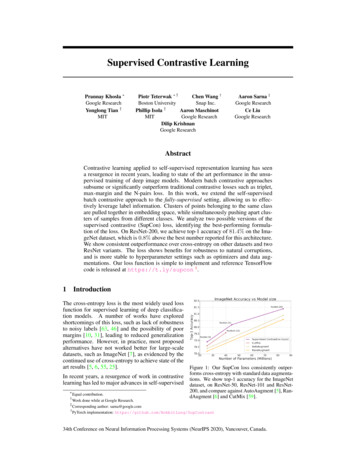
Supervised Contrastive LearningPrannay Khosla Google ResearchYonglong Tian †MITPiotr Teterwak †Chen Wang †Boston UniversitySnap Inc.†Phillip IsolaAaron MaschinotMITGoogle ResearchDilip KrishnanGoogle ResearchAaron Sarna ‡Google ResearchCe LiuGoogle ResearchAbstractContrastive learning applied to self-supervised representation learning has seena resurgence in recent years, leading to state of the art performance in the unsupervised training of deep image models. Modern batch contrastive approachessubsume or significantly outperform traditional contrastive losses such as triplet,max-margin and the N-pairs loss. In this work, we extend the self-supervisedbatch contrastive approach to the fully-supervised setting, allowing us to effectively leverage label information. Clusters of points belonging to the same classare pulled together in embedding space, while simultaneously pushing apart clusters of samples from different classes. We analyze two possible versions of thesupervised contrastive (SupCon) loss, identifying the best-performing formulation of the loss. On ResNet-200, we achieve top-1 accuracy of 81.4% on the ImageNet dataset, which is 0.8% above the best number reported for this architecture.We show consistent outperformance over cross-entropy on other datasets and twoResNet variants. The loss shows benefits for robustness to natural corruptions,and is more stable to hyperparameter settings such as optimizers and data augmentations. Our loss function is simple to implement and reference TensorFlowcode is released at https://t.ly/supcon 1 .1IntroductionThe cross-entropy loss is the most widely used lossfunction for supervised learning of deep classification models. A number of works have exploredshortcomings of this loss, such as lack of robustnessto noisy labels [63, 46] and the possibility of poormargins [10, 31], leading to reduced generalizationperformance. However, in practice, most proposedalternatives have not worked better for large-scaledatasets, such as ImageNet [7], as evidenced by thecontinued use of cross-entropy to achieve state of theart results [5, 6, 55, 25].Figure 1: Our SupCon loss consistently outperforms cross-entropy with standard data augmenta-In recent years, a resurgence of work in contrastive tions. We show top-1 accuracy for the ImageNetlearning has led to major advances in self-supervised dataset, on ResNet-50, ResNet-101 and ResNet 200, and compare against AutoAugment [5], Ranand CutMix [59].Equal contribution.dAugment [6]Work done while at Google Research.‡Corresponding author: sarna@google.com1PyTorch implementation: https://github.com/HobbitLong/SupContrast†34th Conference on Neural Information Processing Systems (NeurIPS 2020), Vancouver, Canada.
Figure 2: Supervised vs. self-supervised contrastive losses: The self-supervised contrastive loss (left, Eq. 1)contrasts a single positive for each anchor (i.e., an augmented version of the same image) against a set ofnegatives consisting of the entire remainder of the batch. The supervised contrastive loss (right) consideredin this paper (Eq. 2), however, contrasts the set of all samples from the same class as positives against thenegatives from the remainder of the batch. As demonstrated by the photo of the black and white puppy, takingclass label information into account results in an embedding space where elements of the same class are moreclosely aligned than in the self-supervised case.representation learning [54, 18, 38, 48, 22, 3, 15]. The common idea in these works is the following:pull together an anchor and a “positive” sample in embedding space, and push apart the anchorfrom many “negative” samples. Since no labels are available, a positive pair often consists of dataaugmentations of the sample, and negative pairs are formed by the anchor and randomly chosensamples from the minibatch. This is depicted in Fig. 2 (left). In [38, 48], connections are made ofthe contrastive loss to maximization of mutual information between different views of the data.In this work, we propose a loss for supervised learning that builds on the contrastive self-supervisedliterature by leveraging label information. Normalized embeddings from the same class are pulledcloser together than embeddings from different classes. Our technical novelty in this work is toconsider many positives per anchor in addition to many negatives (as opposed to self-supervisedcontrastive learning which uses only a single positive). These positives are drawn from samplesof the same class as the anchor, rather than being data augmentations of the anchor, as done inself-supervised learning. While this is a simple extension to the self-supervised setup, it is nonobvious how to setup the loss function correctly, and we analyze two alternatives. Fig. 2 (right) andFig. 1 (Supplementary) provide a visual explanation of our proposed loss. Our loss can be seen asa generalization of both the triplet [52] and N-pair losses [45]; the former uses only one positiveand one negative sample per anchor, and the latter uses one positive and many negatives. The use ofmany positives and many negatives for each anchor allows us to achieve state of the art performancewithout the need for hard negative mining, which can be difficult to tune properly. To the best ofour knowledge, this is the first contrastive loss to consistently perform better than cross-entropy onlarge-scale classification problems. Furthermore, it provides a unifying loss function that can beused for either self-supervised or supervised learning.Our resulting loss, SupCon, is simple to implement and stable to train, as our empirical results show.It achieves excellent top-1 accuracy on the ImageNet dataset on the ResNet-50 and ResNet-200architectures [17]. On ResNet-200 [5], we achieve a top-1 accuracy of 81.4%, which is a 0.8%improvement over the state of the art [30] cross-entropy loss on the same architecture (see Fig. 1).The gain in top-1 accuracy is accompanied by increased robustness as measured on the ImageNet-Cdataset [19]. Our main contributions are summarized below:1. We propose a novel extension to the contrastive loss function that allows for multiple positivesper anchor, thus adapting contrastive learning to the fully supervised setting. Analytically andempirically, we show that a naı̈ve extension performs much worse than our proposed version.2
2. We show that our loss provides consistent boosts in top-1 accuracy for a number of datasets. It isalso more robust to natural corruptions.3. We demonstrate analytically that the gradient of our loss function encourages learning from hardpositives and hard negatives.4. We show empirically that our loss is less sensitive than cross-entropy to a range of hyperparameters.2Related WorkOur work draws on existing literature in self-supervised representation learning, metric learningand supervised learning. Here we focus on the most relevant papers. The cross-entropy loss wasintroduced as a powerful loss function to train deep networks [40, 1, 29]. The key idea is simpleand intuitive: each class is assigned a target (usually 1-hot) vector. However, it is unclear whythese target labels should be the optimal ones and some work has tried to identify better target labelvectors, e.g. [56]. A number of papers have studied other drawbacks of the cross-entropy loss,such as sensitivity to noisy labels [63, 46], presence of adversarial examples [10, 36], and poormargins [2]. Alternative losses have been proposed, but the most effective ideas in practice havebeen approaches that change the reference label distribution, such as label smoothing [47, 35], dataaugmentations such as Mixup [60] and CutMix [59], and knowledge distillation [21].Powerful self-supervised representation learning approaches based on deep learning models haverecently been developed in the natural language domain [8, 57, 33]. In the image domain, pixelpredictive approaches have also been used to learn embeddings [9, 61, 62, 37]. These methodstry to predict missing parts of the input signal. However, a more effective approach has been toreplace a dense per-pixel predictive loss, with a loss in lower-dimensional representation space. Thestate of the art family of models for self-supervised representation learning using this paradigm arecollected under the umbrella of contrastive learning [54, 18, 22, 48, 43, 3, 50]. In these works,the losses are inspired by noise contrastive estimation [13, 34] or N-pair losses [45]. Typically, theloss is applied at the last layer of a deep network. At test time, the embeddings from a previouslayer are utilized for downstream transfer tasks, fine tuning or direct retrieval tasks. [15] introducesthe approximation of only back-propagating through part of the loss, and also the approximation ofusing stale representations in the form of a memory bank.Closely related to contrastive learning is the family of losses based on metric distance learning ortriplets [4, 52, 42]. These losses have been used to learn powerful representations, often in supervised settings, where labels are used to guide the choice of positive and negative pairs. The keydistinction between triplet losses and contrastive losses is the number of positive and negative pairsper data point; triplet losses use exactly one positive and one negative pair per anchor. In the supervised metric learning setting, the positive pair is chosen from the same class and the negative pairis chosen from other classes, nearly always requiring hard-negative mining for good performance[42]. Self-supervised contrastive losses similarly use just one positive pair for each anchor sample,selected using either co-occurrence [18, 22, 48] or data augmentation [3]. The major difference isthat many negative pairs are used for each anchor. These are usually chosen uniformly at randomusing some form of weak knowledge, such as patches from other images, or frames from other randomly chosen videos, relying on the assumption that this approach yields a very low probability offalse negatives.Resembling our supervised contrastive approach is the soft-nearest neighbors loss introduced in [41]and used in [53]. Like [53], we improve upon [41] by normalizing the embeddings and replacingeuclidean distance with inner products. We further improve on [53] by the increased use of dataaugmentation, a disposable contrastive head and two-stage training (contrastive followed by crossentropy), and crucially, changing the form of the loss function to significantly improve results (seeSection 3). [12] also uses a closely related loss formulation to ours to entangle representations atintermediate layers by maximizing the loss. Most similar to our method is the Compact Clusteringvia Label Propagation (CCLP) regularizer in Kamnitsas et. al. [24]. While CCLP focuses mostlyon the semi-supervised case, in the fully supervised case the regularizer reduces to almost exactlyour loss formulation. Important practical differences include our normalization of the contrastiveembedding onto the unit sphere, tuning of a temperature parameter in the contrastive objective, andstronger augmentation. Additionally, Kamnitsas et. al. use the contrastive embedding as an input toa classification head, which is trained jointly with the CCLP regularizer, while SupCon employs a3
two stage training and discards the contrastive head. Lastly, the scale of experiments in Kamnitsaset. al. is much smaller than in this work. Merging the findings of our paper and CCLP is a promisingdirection for semi-supervised learning research.3MethodOur method is structurally similar to that used in [48, 3] for self-supervised contrastive learning,with modifications for supervised classification. Given an input batch of data, we first apply dataaugmentation twice to obtain two copies of the batch. Both copies are forward propagated throughthe encoder network to obtain a 2048-dimensional normalized embedding. During training, thisrepresentation is further propagated through a projection network that is discarded at inference time.The supervised contrastive loss is computed on the outputs of the projection network. To use thetrained model for classification, we train a linear classifier on top of the frozen representations usinga cross-entropy loss. Fig. 1 in the Supplementary material provides a visual explanation.3.1Representation Learning FrameworkThe main components of our framework are: Data Augmentation module, Aug(·). For each input sample, x, we generate two random augmentations, x̃ Aug(x), each of which represents a different view of the data and contains somesubset of the information in the original sample. Sec. 4 gives details of the augmentations. Encoder Network, Enc(·), which maps x to a representation vector, r Enc(x) RDE . Bothaugmented samples are separately input to the same encoder, resulting in a pair of representationvectors. r is normalized to the unit hypersphere in RDE (DE 2048 in all our experiments inthe paper). Consistent with the findings of [42, 51], our analysis and experiments show that thisnormalization improves top-1 accuracy. Projection Network, P roj(·), which maps r to a vector z P roj(r) RDP . We instantiateP roj(·) as either a multi-layer perceptron [14] with a single hidden layer of size 2048 and outputvector of size DP 128 or just a single linear layer of size DP 128; we leave to future workthe investigation of optimal P roj(·) architectures. We again normalize the output of this networkto lie on the unit hypersphere, which enables using an inner product to measure distances in theprojection space. As in self-supervised contrastive learning [48, 3], we discard P roj(·) at the endof contrastive training. As a result, our inference-time models contain exactly the same numberof parameters as a cross-entropy model using the same encoder, Enc(·).3.2Contrastive Loss FunctionsGiven this framework, we now look at the family of contrastive losses, starting from the selfsupervised domain and analyzing the options for adapting it to the supervised domain, showing thatone formulation is superior. For a set of N randomly sampled sample/label pairs, {xk , y k }k 1.N ,the corresponding batch used for training consists of 2N pairs, {x̃ , ỹ } 1.2N , where x̃2k andx̃2k 1 are two random augmentations (a.k.a., “views”) of xk (k 1.N ) and ỹ 2k 1 ỹ 2k y k .For the remainder of this paper, we will refer to a set of N samples as a “batch” and the set of 2Naugmented samples as a “multiviewed batch”.3.2.1Self-Supervised Contrastive LossWithin a multiviewed batch, let i I {1.2N } be the index of an arbitrary augmented sample,and let j(i) be the index of the other augmented sample originating from the same source sample.In self-supervised contrastive learning (e.g., [3, 48, 18, 22]), the loss takes the following form. XX selfexp z i z j(i) /τselfPL Li log(1)exp (z i z a /τ )i Ii IDPa A(i)Here, z P roj(Enc(x̃ )) R , the symbol denotes the inner (dot) product, τ R is ascalar temperature parameter, and A(i) I \ {i}. The index i is called the anchor, index j(i) iscalled the positive, and the other 2(N 1) indices ({k A(i) \ {j(i)}) are called the negatives.4
Note that for each anchor i, there is 1 positive pair and 2N 2 negative pairs. The denominator hasa total of 2N 1 terms (the positive and negatives).3.2.2Supervised Contrastive LossesFor supervised learning, the contrastive loss in Eq. 1 is incapable of handling the case where, due tothe presence of labels, more than one sample is known to belong to the same class. Generalizationto an arbitrary numbers of positives, though, leads to a choice between multiple possible functions.Eqs. 2 and 3 present the two most straightforward ways to generalize Eq. 1 to incorporate supervision.X 1 XX supexp (z i z p /τ )LsupLout,i log P(2)out P (i) exp (z i z a /τ )i Ii ILsupin Xi ILsupin,i Xi I logp P (i) X1 P (i) p P (i)a A(i) exp (z i z p /τ )Pexp (z i z a /τ ) (3)a A(i)Here, P (i) {p A(i) : ỹ p ỹ i } is the set of indices of all positives in the multiviewed batchdistinct from i, and P (i) is its cardinality. In Eq. 2, the summation over positives is located outsidesupof the log (Lsupout ) while in Eq. 3, the summation is located inside of the log (Lin ). Both losses havethe following desirable properties: Generalization to an arbitrary number of positives. The major structural change of Eqs. 2and 3 over Eq. 1 is that now, for any anchor, all positives in a multiviewed batch (i.e., theaugmentation-based sample as well as any of the remaining samples with the same label) contribute to the numerator. For randomly-generated batches whose size is large with respect to thenumber of classes, multiple additional terms will be present (on average, N/C, where C is thenumber of classes). The supervised losses encourage the encoder to give closely aligned representations to all entries from the same class, resulting in a more robust clustering of the representationspace than that generated from Eq. 1, as is supported by our experiments in Sec. 4. Contrastive power increases with more negatives. Eqs. 2 and 3 both preserve the summationover negatives in the contrastive denominator of Eq. 1. This form is largely motivated by noisecontrastive estimation and N-pair losses [13, 45], wherein the ability to discriminate betweensignal and noise (negatives) is improved by adding more examples of negatives. This property isimportant for representation learning via self-supervised contrastive learning, with many papersshowing increased performance with increasing number of negatives [18, 15, 48, 3]. Intrinsic ability to perform hard positive/negative mining. When used with normalized representations, the loss in Eq. 1 induces a gradient structure that gives rise to implicit hard positive/negative mining. The gradient contributions from hard positives/negatives (i.e., ones againstwhich continuing to contrast the anchor greatly benefits the encoder) are large while those for easypositives/negatives (i.e., ones against which continuing to contrast the anchor only weakly benefitsthe encoder) are small. Furthermore, for hard positives, the effect increases (asymptotically) asthe number of negatives does. Eqs. 2 and 3 both preserve this useful property and generalize itto all positives. This implicit property allows the contrastive loss to sidestep the need for explicithard mining, which is a delicate but critical part of many losses, such as triplet loss [42]. Wenote that this implicit property applies to both supervised and self-supervised contrastive losses,but our derivation is the first to clearly show this property. We provide a full derivation of thisproperty from the loss gradient in the Supplementary material.Loss Top-1The two loss formulations are not, however, equivalent. Because log is a concave function, Jensen’s Inequality [23] imLsup78.7%supoutplies that Lsupout Lin . One might thus be tempted to conLsup67.4%supinclude that Lin is the superior supervised loss function (sinceit bounds Lsupout ). However, this conclusion is not supported Table 1: ImageNet Top-1 classificationanalytically. Table 1 compares the ImageNet [7] top-1 classifi- accuracy for supervised contrastivesupcation accuracy using Lsupout and Lin for different batch sizes losses on ResNet-50 for a batch size of(N ) on the ResNet-50 [17] architecture. The Lsupout supervised 6144.loss achieves significantly higher performance than Lsupthat this is due to the grain . We conjecturesupsupdient of Lsupin having structure less optimal for training than that of Lout . For Lout , the positives5
normalization factor (i.e., 1/ P (i) ) serves to remove bias present in the positives in a multiviewedbatch contributing to the loss. However, though Lsupin also contains the same normalization factor,it is located inside of the log. It thus contributes only an additive constant to the overall loss, whichdoes not affect the gradient. Without any normalization effects, the gradients of Lsupin are moresusceptible to bias in the positives, leading to sub-optimal training.An analysis of the gradients themselves supports this conclusion. As shown in the Supplementary,supthe gradient for either Lsupout,i or Lin,i with respect to the embedding z i has the following form. X X1 Lsupi z p (Pip Xip ) z n Pin(4) z iτ p P (i)n N (i)Here, N (i) {n A(i) : ỹPn 6 ỹ i } is the set of indices of all negatives in the multiviewed batch,and Pix exp (z i z x /τ ) / a A(i) exp (z i z a /τ ). The difference between the gradients for thetwo losses is in Xip . Pexp(zi zp /τ ), if Lsup Lsupiin,iexp(z i z p0 /τ )Xip p0 P (i)(5) 1, if Lsup Lsup i P (i) out,iinoutIf each z p is set to the (less biased) mean positive representation vector, z, Xipreduces to Xip:inXipz p z exp (z i z/τ )exp (z i z/τ )1outP Xip exp (z i z/τ ) P (i) · exp (z i z/τ ) P (i) (6)p0 P (i) Lsupi / z i ,From the form ofwe conclude that the stabilization due to using the mean of positivesbenefits training. Throughout the rest of the paper, we consider only Lsupout .3.2.3Connection to Triplet Loss and N-pairs LossSupervised contrastive learning is closely related to the triplet loss [52], one of the widely-used lossfunctions for supervised learning. In the Supplementary, we show that the triplet loss is a specialcase of the contrastive loss when one positive and one negative are used. When more than onenegative is used, we show that the SupCon loss becomes equivalent to the N-pairs loss [45].4ExperimentsWe evaluate our SupCon loss (Lsupout , Eq. 2) by measuring classification accuracy on a numberof common image classification benchmarks including CIFAR-10 and CIFAR-100 [27] and ImageNet [7]. We also benchmark our ImageNet models on robustness to common image corruptions[19] and show how performance varies with changes to hyperparameters and reduced data. Forthe encoder network (Enc(·)) we experimented with three commonly used encoder architectures:ResNet-50, ResNet-101, and ResNet-200 [17]. The normalized activations of the final poolinglayer (DE 2048) are used as the representation vector. We experimented with four differentimplementations of the Aug(·) data augmentation module: AutoAugment [5]; RandAugment [6];SimAugment [3], and Stacked RandAugment [49] (see details of our SimAugment and StackedRandAugment implementations in the Supplementary). AutoAugment outperforms all other dataaugmentation strategies on ResNet-50 for both SupCon and cross-entropy. Stacked RandAugmentperformed best for ResNet-200 for both loss functions. We provide more details in the Supplementary.4.1Classification AccuracyTable 2 shows that SupCon generalizes better than cross-entropy, margin classifiers (with use oflabels) and unsupervised contrastive learning techniques on CIFAR-10, CIFAR-100 and ImageNetdatasets. Table 3 shows results for ResNet-50 and ResNet-200 (we use ResNet-v1 [17]) for ImageNet. We achieve a new state of the art accuracy of 78.7% on ResNet-50 with AutoAugment (forcomparison, a number of the other top-performing methods are shown in Fig. 1). Note that we also6
DatasetSimCLR[3]Cross-EntropyMax-Margin 5.378.292.470.578.096.076.578.7Table 2: Top-1 classification accuracy on ResNet-50 [17] for various datasets. We compare cross-entropytraining, unsupervised representation learning (SimCLR [3]), max-margin classifiers [32] and SupCon (ours).We re-implemented and tuned hyperparameters for all baseline numbers except margin classifiers where wereport published results. Note that the CIFAR-10 and CIFAR-100 results are from our PyTorch implementationand ImageNet from our TensorFlow p-5Cross-Entropy (baseline)Cross-Entropy (baseline)Cross-Entropy (baseline)Cross-Entropy (our sNet-50MixUp [60]CutMix [59]AutoAugment [5]AutoAugment [30]AutoAugment ntropy (baseline)Cross-Entropy (our ent [5]Stacked RandAugment [49]Stacked RandAugment d RandAugment [49]80.294.7Table 3: Top-1/Top-5 accuracy results on ImageNet for AutoAugment [5] with ResNet-50 and for StackedRandAugment [49] with ResNet-101 and ResNet-200. The baseline numbers are taken from the referencedpapers, and we also re-implement cross-entropy.achieve a slight improvement over CutMix [59], which is considered to be a state of the art dataaugmentation strategy. Incorporating data augmentation strategies such as CutMix [59] and MixUp[60] into contrastive learning could potentially improve results further.We also experimented with memory based alternatives [15]. On ImageNet, with a memory sizeof 8192 (requiring only the storage of 128-dimensional vectors), a batch size of 256, and SGDoptimizer, running on 8 Nvidia V100 GPUs, SupCon is able to achieve 79.1% top-1 accuracy onResNet-50. This is in fact slightly better than the 78.7% accuracy with 6144 batch size (and nomemory); and with significantly reduced compute and memory footprint.Since SupCon uses 2 views per sample, its batch sizes are effectively twice the cross-entropy equivalent. We therefore also experimented with the cross-entropy ResNet-50 baselines using a batch sizeof 12,288. These only achieved 77.5% top-1 accuracy. We additionally experimented with increasing the number of training epochs for cross-entropy all the way to 1400, but this actually decreasedaccuracy (77.0%).We tested the N-pairs loss [45] in our framework with a batch size of 6144. N-pairs achieves only57.4% top-1 accuracy on ImageNet. We believe this is due to multiple factors missing from N-pairsloss compared to supervised contrastive: the use of multiple views; lower temperature; and manymore positives. We show some results of the impact of the number of positives per anchor in theSupplementary (Sec. 6), and the N-pairs result is inline with them. We also note that the originalN-pairs paper [45] has already shown the outperformance of N-pairs loss to triplet loss.4.2Robustness to Image Corruptions and Reduced Training DataDeep neural networks lack robustness to out of distribution data or natural corruptions such as noise,blur and JPEG compression. The benchmark ImageNet-C dataset [19] is used to measure trainedmodel performance on such corruptions. In Fig. 3(left), we compare the supervised contrastivemodels to cross-entropy using the Mean Corruption Error (mCE) and Relative Mean Corruption Error metrics [19]. Both metrics measure average degradation in performance compared to ImageNettest set, averaged over all possible corruptions and severity levels. Relative mCE is a better metricwhen we compare models with different Top-1 accuracy, while mCE is a better measure of absoluterobustness to corruptions. The SupCon models have lower mCE values across different corruptions,showing increased robustness. We also see from Fig. 3(right) that SupCon models demonstratelesser degradation in accuracy with increasing corruption severity.7
LossArchitecturerel. mCE mCECross-Entropy(baselines)AlexNet [28]VGG-19 BN [44]ResNet-18 [17]100.0122.9103.9100.081.684.7Cross-Entropy(our Supervised re 3: Training with supervised contrastive loss makes models more robust to corruptions in images. Left:Robustness as measured by Mean Corruption Error (mCE) and relative mCE over the ImageNet-C dataset[19] (lower is better). Right: Mean Accuracy as a function of corruption severity averaged over all variouscorruptions. (higher is better).Figure 4: Accuracy of cross-entropy and supervised contrastive loss as a function of hyperparameters andtraining data size, all measured on ImageNet with a ResNet-50 encoder. (From left to right) (a): Standardboxplot showing Top-1 accuracy vs changes in augmentation, optimizer and learning rates. (b): Top-1 accuracyas a function of batch size shows both losses benefit from larger batch sizes while Supervised Contrastive hashigher Top-1 accuracy even when trained with smaller batch sizes. (c): Top-1 accuracy as a function of SupConpretraining epochs. (d): Top-1 accuracy as a function of temperature during pretraining stage for SupCon.Food CIFAR10 CIFAR100 Birdsnap SUN397 Cars Aircraft VOC2007 DTD Pets Caltech-101 Flowers MeanSimCLR-50 [3] 88.20Xent-5087.38SupCon-50 85.3685.1773.20 89.2076.86 92.3574.60 0.0191.7884.2288.6886.2785.1876.76 93.4874.26 200Table 4: Transfer learning results. Numbers are mAP for VOC2007 [11]; mean-per-class accuracy for Aircraft,Pets, Caltech, and Flowers; and top-1 accuracy for all other datasets.4.3Hyperparameter StabilityWe experimented with hyperparameter stability by changing augmentations, optimizers and learningrates one at a time from the best combination for each of the methodologies. In Fig. 4(a), wecompare the top-1 accuracy of SupCon loss against cross-entropy across changes in augmentations(RandAugment [6], AutoAugment [5], SimAugment [3], Stacked RandAugment [49]); optimizers(LARS, SGD with Momentum and RMSProp); and learning rates. We observe significantly lowervariance in the output of the contrastive loss. Note that batch sizes for cross-entropy and supervisedcontrastive are the same, thus ruling out any batch-size effects. In Fig. 4(b), sweeping batch sizeand holding all other hyperparameters constant results in consistently better top-1 accuracy of thesupervised contrastive loss.4.4Transfer LearningWe evaluate the learned representation for fine-tuning on 12 natural imag
pervised training of deep image models. Modern batch contrastive approaches subsume or significantly outperform traditional contrastive losses such as triplet, max-margin and the N-pairs loss. In this work, we extend the self-supervised batch contrastive approach to the fully-supervised setting, allowing us to effec-tively leverage label .

