Transcription
Artificial IntelligenceIndex Report 2021CHAPTER 6:Diversity in AICHAPTER 6 PREVIEWArtificial IntelligenceIndex Report 20211
Artificial IntelligenceIndex Report 2021CHAPTER 6:DIVERSITY IN AICHAPTER 6:Chapter PreviewOverview3Chapter Highlights46.1 GENDER DIVERSITY IN AI5Women in Academic AI Settings5Women in the AI Workforce6Women in Machine Learning Workshops 7Workshop Participants7Demographics Breakdown86.2 RACIAL AND ETHNICDIVERSITY IN AI10New AI PhDs in the United Statesby Race/Ethnicity10New Computing PhDs in theUnited States by Race/Ethnicity11CS Tenure-Track Facultyby Race/Ethnicity12Black in AI126.3 GENDER IDENTITY ANDSEXUAL ORIENTATION IN AI13Queer in AI13Demographics Breakdown13Experience as Queer Practitioners15APPENDIX17ACCESS THE PUBLIC DATACHAPTER 6 PREVIEW2
Artificial IntelligenceIndex Report 2021CHAPTER 6:DIVERSITY IN AIOV E R V I E WOverviewWhile artificial intelligence (AI) systems have the potential to dramatically affect society,the people building AI systems are not representative of the people those systems aremeant to serve. The AI workforce remains predominantly male and lacking in diversity inboth academia and the industry, despite many years highlighting the disadvantages andrisks this engenders. The lack of diversity in race and ethnicity, gender identity, and sexualorientation not only risks creating an uneven distribution of power in the workforce, butalso, equally important, reinforces existing inequalities generated by AI systems, reducesthe scope of individuals and organizations for whom these systems work, and contributesto unjust outcomes.This chapter presents diversity statistics within the AI workforce and academia. It drawson collaborations with various organizations—in particular, Women in Machine Learning(WiML), Black in AI (BAI), and Queer in AI (QAI)— each of which aims to improve diversityin some dimension in the field. The data is neither comprehensive nor conclusive. Inpreparing this chapter, the AI Index team encountered significant challenges as a resultof the sparsity of publicly available demographic data. The lack of publicly availabledemographic data limits the degree to which statistical analyses can assess the impactof the lack of diversity in the AI workforce on society as well as broader technologydevelopment. The diversity issue in AI is well known, and making more data availablefrom both academia and industry is essential to measuring the scale of the problem andaddressing it.There are many dimensions of diversity that this chapter does not cover, including AIprofessionals with disabilities; nor does it consider diversity through an intersectionallens. Other dimensions will be addressed in future iterations of this report. Moreover,these diversity statistics tell only part of the story. The daily challenges of minorities andmarginalized groups working in AI, as well as the structural problems within organizationsthat contribute to the lack of diversity, require more extensive data collection and analysis.1 We thank Women in Machine Learning, Black in AI, and Queer in AI for their work to increase diversity in AI, for sharing their data, and for partnering with us.CHAPTER 6 PREVIEW3
Artificial IntelligenceIndex Report 2021CHAPTER 6:DIVERSITY IN AICHAPTERHIGHLIGHTSCHAPTER HIGHLIGHTS The percentages of female AI PhD graduates and tenure-track computer science(CS) faculty have remained low for more than a decade. Female graduates of AI PhDprograms in North America have accounted for less than 18% of all PhD graduates onaverage, according to an annual survey from the Computing Research Association(CRA). An AI Index survey suggests that female faculty make up just 16% of all tenuretrack CS faculty at several universities around the world. The CRA survey suggests that in 2019, among new U.S. resident AI PhD graduates,45% were white, while 22.4% were Asian, 3.2% were Hispanic, and 2.4% were AfricanAmerican. The percentage of white (non-Hispanic) new computing PhDs has changed littleover the last 10 years, accounting for 62.7% on average. The share of Black orAfrican American (non-Hispanic) and Hispanic computing PhDs in the same period issignificantly lower, with an average of 3.1% and 3.3%, respectively. The participation in Black in AI workshops, which are co-located with the Conferenceon Neural Information Processing Systems (NeurIPS), has grown significantly in recentyears. The numbers of attendees and submitted papers in 2019 are 2.6 times higher thanin 2017, while the number of accepted papers is 2.1 times higher. In a membership survey by Queer in AI in 2020, almost half the respondents said theyview the lack of inclusiveness in the field as an obstacle they have faced in becominga queer practitioner in the AI/ML field. More than 40% of members surveyed said theyhave experienced discrimination or harassment as a queer person at work or school.CHAPTER 6 PREVIEW4
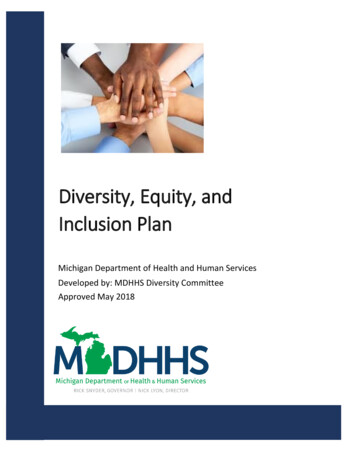
Artificial IntelligenceIndex Report 2021CHAPTER 6:DIVERSITY IN AI6.1 G E N D E RDIVERSITY IN AI6.1 GENDER DIVERSITY IN AIWO M E N I N ACA D E M I CAI SETTINGSTENURE-TRACK FACULTY at CS DEPARTMENTS ofTOP UNIVERSITIEStheWORLDby GENDER,TENURE-TRACKaroundFACULTYat CSDEPARTMENTSofChapter 4 introduced the AI Index survey that evaluatesTOPUNIVERSITIESaroundtheWORLDbyGENDER,AY 2019-20the state of AI education in CS departments at topAY 2019-20Source: AI Index,2020 Chart: 2021 AI Index ReportSource: AI Index, 2020 Chart: 2021 AI Index Reportuniversities around the world, along with the ComputerResearch Association’s annual Taulbee Survey on the110 (16.1%)enrollment, production, and employment of PhDs110(16.1%)FemaleFemalein information, computer science, and computerengineering in North America.Data from both surveys show that the percentage offemale AI and CS PhD graduates as well as tenure-track CSfaculty remains low. Female graduates of AI PhD programsand CS PhD programs have accounted for 18.3% of allPhD graduates on average within the past 10 years (Figure6.1.1). Among the 17 universities that completed the AIIndex survey of CS programs globally, female faculty makeup just 16.1% of all tenure-track faculty whose primaryresearch focus area is AI (Figure 6.1.2).575 (83.9%)Male575 (83.9%)MaleFigure 6.1.2FEMALE NEW AI and CS PHDS (% of TOTAL NEW AI and CS PHDS) in NORTH AMERICA, 2010-19Source: CRA Taulbee Survey, 2020 Chart: 2021 AI Index ReportFemale New AI PhDs (% of All New AI PhDs)30%25%22.1% AI20%20.3% gure 6.1.1CHAPTER 6 PREVIEW5
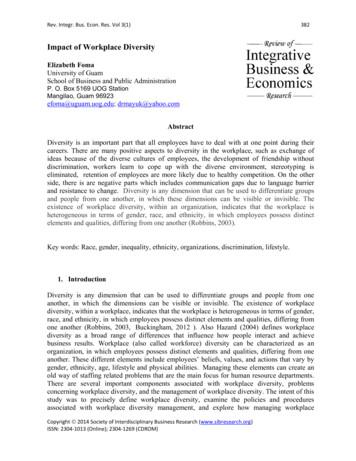
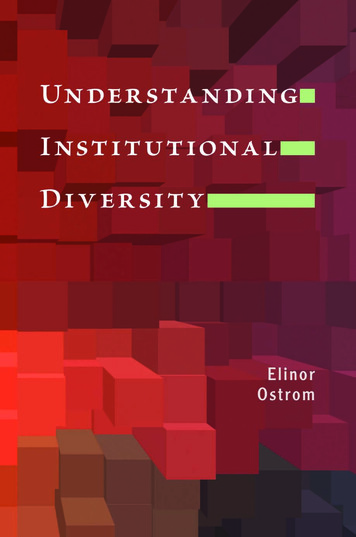
Artificial IntelligenceIndex Report 2021CHAPTER 6:DIVERSITY IN AI6.1 G E N D E RDIVERSITY IN AIWO M E N I N T H E A I WO R K F O R C EChapter 3 introduced the “global relative AI skillspenetration rate,” a measure that reflects the prevalenceof AI skills across occupations, or the intensity with whichpeople in certain occupations use AI skills. Figure 6.1.3shows AI skills penetration by country for female andmale labor pools in a set of select countries.2 The datasuggest that across the majority of these countries, theAI skills penetration rate for women is lower than thatfor men. Among the 12 countries we examined, India,South Korea, Singapore, and Australia are the closest toreaching equity in terms of the AI skills penetration rateof females and males.This data suggests thatacross the majority ofselect countries, theAI skills penetrationrate for women is lowerthan it is for men.RELATIVE AI SKILLS PENETRATION RATE by GENDER, 2015-20Source: LinkedIn, 2020 Chart: 2021 AI Index ReportIndiaUnited StatesSouth ted KingdomFemaleMaleSouth AfricaItaly0123Relative AI Skills Penetration RateFigure 6.1.32 Countries included are a select sample of eligible countries with at least 40% labor force coverage by LinkedIn and at least 10 AI hires in any given month. China and India were included in this samplebecause of their increasing importance in the global economy, but LinkedIn coverage in these countries does not reach 40% of the workforce. Insights for these countries may not provide as full a pictureas other countries, and should be interpreted accordingly.CHAPTER 6 PREVIEW6
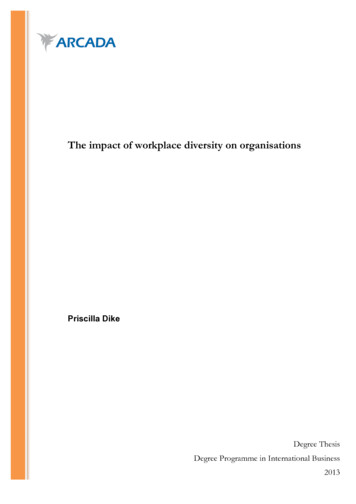
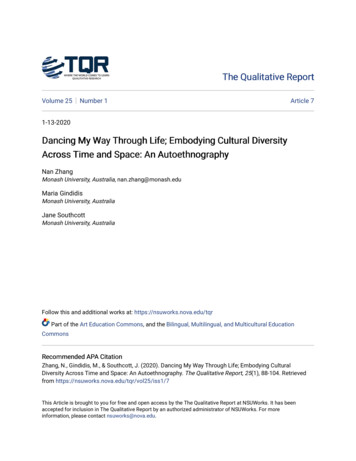
Artificial IntelligenceIndex Report 2021CHAPTER 6:DIVERSITY IN AI6.1 G E N D E RDIVERSITY IN AIWO M E N I N M AC H I N E L E A R N I N GWO R KS H O P SWomen in Machine Learning, founded in 2006 byHanna Wallach, Jenn Wortman, and Lisa Wainer, is anorganization that runs events and programs to supportwomen in the field of machine learning (ML). Thissection presents statistics from its annual technicalworkshops, which are held at NeurIPS. In 2020, WiMLalso hosted for the first time a full-day “Un-Workshop” atthe International Conference on Machine Learning 2020,which drew 812 participants.Workshop ParticipantsThe number of participants attending WiML workshops atNeurIPS has been steadily increasing since the workshopswere first offered in 2006. According to the organization,the WiML workshop in 2020 was completely virtualbecause of the pandemic and delivered on a new platform(Gather.Town); these two factors may make attendancenumbers harder to compare to those of previous years.Figure 6.1.4 shows an estimate of 925 attendees in 2020,based on the number of individuals who accessed thevirtual platform.In the past 10 years, WiML workshops have expandedtheir programs to include mentoring roundtables, wheremore senior participants offer one-on-one feedback andprofessional advice, in addition to the main session thatincludes keynotes and poster presentations. Similaropportunities may have contributed to the increase inattendance since 2014. Between 2016 and 2019, the WiMLworkshop attendance is on average about 10% of theoverall NeurIPS attendance.NUMBER of PARTICIPANTS at WIML WORKSHOP at NEURIPS, 2006-20Source: Women in Machine Learning, 2020 Chart: 2021 AI Index Report1,000925Number of 14201320122011201020092008200720060Figure 6.1.4CHAPTER 6 PREVIEW7
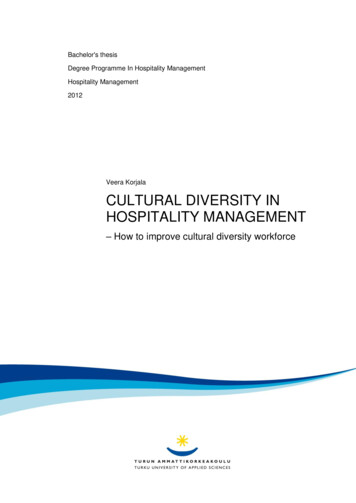
Artificial IntelligenceIndex Report 2021CHAPTER 6:DIVERSITY IN AIDemographics BreakdownThe following geographic, professional position, andgender breakdowns are based only on participants atthe 2020 WiML workshop at NeurIPS who consented tohaving the information aggregated and who spent atleast 10 minutes on the virtual platform through whichthe workshop was offered. Among the participants,89.5% were women and/or nonbinary, 10.4% were men(Figure 6.1.5), and a large majority were from NorthAmerica (Figure 6.1.6). Further, as shown in Figure 6.1.7,students—including PhD, master’s, and undergraduatestudents—make up more than half the participants(54.6%). Among participants who work in the industry,research scientist/engineer and data scientist/engineerare the most commonly held professional positions.PARTICIPANTS of WIML WORKSHOP at NEURIPS(% ofTOTAL) byofGENDER,2020 at NEURIPSPARTICIPANTSWIML WORKSHOPSource:in MachineLearning, 2020 Chart: 2021 AI Index Report(%Womenof TOTAL)by GENDER,2020Source: Women in Machine Learning, 2020 Chart: 2021 AI Index Report6.1 G E N D E RDIVERSITY IN AIAmong theparticipants, 89.5%were women and/or nonbinary, 10.4%were men, and a largemajority were fromNorth America. Further,students—includingPhD, master’s, andundergraduatestudents—make upmore than half theparticipants (54.6%).10.4%10.4%Man Man89.5%Woman and/or nonbinary89.5%Woman and/or nonbinaryFigure 6.1.5CHAPTER 6 PREVIEW8
Artificial IntelligenceIndex Report 2021CHAPTER 6:DIVERSITY IN AI6.1 G E N D E RDIVERSITY IN AIPARTICIPANTS of WIML WORKSHOP at NEURIPS (% of TOTAL) by CONTINENT of RESIDENCE, 2020Source: Women in Machine Learning, 2020 Chart: 2021 AI Index ReportNorth AmericaEuropeAsiaAfricaCentral, South America, and the CarribeanAustralia and OceaniaMiddle East0%10%20%30%40%50%60%% of ParticipantsFigure 6.1.6PARTICIPANTS of WIML WORKSHOP at NEURIPS (% of TOTAL) by TOP 10 PROFESSIONAL POSITIONS, 2020Source: Women in Machine Learning, 2020 Chart: 2021 AI Index ReportPhD StudentResearch Scientist/EngineerMSc StudentData scientist/EngineerUndergraduate StudentPostdoctoral ResearcherSoftware EngineerProfessor (Pre-Tenure)Professor (Post-Tenure)Program/Product Manager0%5%10%15%20%25%30%35%% of ParticipantsFigure 6.1.7CHAPTER 6 PREVIEW9
Artificial IntelligenceIndex Report 20216. 2 R AC I A LAND ETHNICDIVERSITY IN AICHAPTER 6:DIVERSITY IN AI6.2 RACIAL AND ETHNIC DIVERSITY IN AIN E W A I P H D S I N T H E U N I T E D S TAT E S BY R AC E / E T H N I C I T YAccording to the CRA Taulbee Survey, among the new AI PhDs in 2019 who are U.S. residents, the largestpercentage (45.6%) are white (non-Hispanic), followed by Asian (22.4%). By comparison, 2.4% were AfricanAmerican (non-Hispanic) and 3.2% were Hispanic (Figure 6.2.1).NEW U.S. RESIDENT AI PHDS (% of TOTAL) by RACE/ETHNICITY, 2019NEW U.S. RESIDENTAICRAPHDS(% Survey,of TOTAL)by RACE/ETHNICITY,Source:Taulbee2020 Chart:2021 AI Index Report 2019Source: CRA Taulbee Survey, 2020 Chart: 2021 AI Index Report22.4% Asian45.6% White(non-Hispanic)22.4% Asian45.6% White(non-Hispanic)2.4% Black or AfricanAmerican(non-Hispanic)3.2%Hispanic1.6% Multiracial(non-Hispanic)3.2%Hispanic1.6% Multiracial(non-Hispanic)24.8% Unknown24.8% UnknownCHAPTER 6 PREVIEW2.4% Black or AfricanAmerican(non-Hispanic)Figure 6.2.110
Artificial IntelligenceIndex Report 20216. 2 R AC I A LAND ETHNICDIVERSITY IN AICHAPTER 6:DIVERSITY IN AINEW COMPUTING PHDS INT H E U N I T E D S TAT E S BYR AC E / E T H N I C I T YThe CRA surveyindicates that thepercentage of white(non-Hispanic) newPhDs has changed littleover the last 10 years,accounting for 62.7%on average.Figure 6.2.2 shows all PhDs awarded in the United Statesto U.S. residents across departments of computer science(CS), computer engineering (CE), and information (I)between 2010 and 2019. The CRA survey indicates thatthe percentage of white (non-Hispanic) new PhDs haschanged little over the last 10 years, accounting for 62.7%on averag
Man PARTICIPANTS of WIML WORKSHOP at NEURIPS (% of TOTAL) by GENDER, 2020 Source: Women in Machine Learning, 2020 Chart: 2021 AI Index Report 89.5% Woman and/or nonbinary 10.4% Man PARTICIPANTS of WIML WORKSHOP at NEURIPS (% of TOTAL) by GENDER, 2020 Sou rce: Women in Machine Lea ning, 2020 Cha t: 2021 AI Index Repo Figure 6.1.5 Among the participants,