Transcription
Chemometrics and Intelligent Laboratory Systems 72 (2004) 57 – 71www.elsevier.com/locate/chemolabImage texture analysis: methods and comparisonsManish H. Bharati 1, J. Jay Liu, John F. MacGregor *Department of Chemical Engineering, McMaster University, 1280 Main Street West, Hamilton, Ontario, Canada L8S 4L7Received 5 May 2003; received in revised form 5 February 2004; accepted 9 February 2004Available online 6 May 2004AbstractSurface texture is an important quality characteristic of many products. This paper provides an overview of several different approaches toimage texture analysis and demonstrates their use on the problem of classifying a set of rolled steel sheets into various quality grades.Methods covered include traditional statistical approaches such as gray level co-occurrence matrix (GLCM) methods, multivariate statisticalapproaches based on PCA and PLS, and wavelet texture analysis.Traditional multivariate classification approaches, such as PLS-DA, applied directly to the images are shown to fail because of the loss ofspatial identity of the variables (pixels) in those approaches, and the lack of congruency of the images. However, approaches that re-introducespatial information, such as performing two-dimensional FFT on the images prior to applying multivariate methods can perform well. A newapproach that re-introduces spatial information through image shifting and stacking, followed by multivariate image analysis (MIA) ispresented and shown to work well. It can also be used to develop optimal spatial filters for extracting texture information. Wavelet textureanalysis (WTA) methods are discussed and insight into their space/frequency decomposition behavior is used to show why they are generallyconsidered to be state of the art in texture analysis.D 2004 Published by Elsevier B.V.Keywords: Texture analysis; Gray level co-occurrence matrix; Wavelet texture analysis; Principal component analysis; Partial least squares; Multivariate imageanalysis1. IntroductionAlthough one can intuitively associate several imageproperties such as smoothness, coarseness, depth, regularity,etc. with texture [1], there is no formal or complete definitionof texture. Many researchers have described texture usingvarious definitions. Russ [2] loosely defined image texture asa descriptor of local brightness variation from pixel to pixel ina small neighborhood through an image. Alternatively, texture can be described as an attribute representing the spatialarrangement of the gray levels of the pixels in a region of adigital image [3]. Texture analysis has played an importantrole in many areas including medical imaging, remote sensing and industrial inspection, and its tasks are mainly classification, segmentation, and synthesis [4– 6].The approaches for analyzing texture are very diverse,and differ from each other mainly by the method used for* Corresponding author. Tel.: 1-905-525-9140x24951; fax: 1-905521-1350.E-mail address: macgreg@mcmaster.ca (J.F. MacGregor).1Current address: Shell Global Solutions Inc., Westhollow TechnologyCenter, P.O. Box 1380, Houston, TX, USA.0169-7439/ - see front matter D 2004 Published by Elsevier B.V.doi:10.1016/j.chemolab.2004.02.005extracting textural features. Four categories can be defined:(1) statistical methods, (2) structural methods, (3) modelbased methods, and (4) transform-based methods.Statistical texture analysis techniques primarily describetexture of regions in an image through higher-ordermoments of their grayscale histograms [7]. Probably, themost frequently cited method for texture analysis is basedon extracting various textural features from a gray level cooccurrence matrix (GLCM) [8]. The GLCM approach isbased on the use of second-order statistics of the grayscaleimage histograms. Alternatively, the run length matrix(RLM) encompasses higher-order statistics of the gray levelhistogram. The RLM texture analysis approach characterizes coarse textures as having many pixels in a constant graylevel run and fine textures as having few pixels in such a run[9]. Besides traditional statistical texture analysis, multivariate statistical methods have also been proposed for texturalfeature extraction. Considering an image as a matrix, theSingular Value Decomposition (SVD) spectrum is a summary vector of image texture represented by its singularvalues. The SVD spectrum has been used as a texturalfeature vector for image classification [10,11].
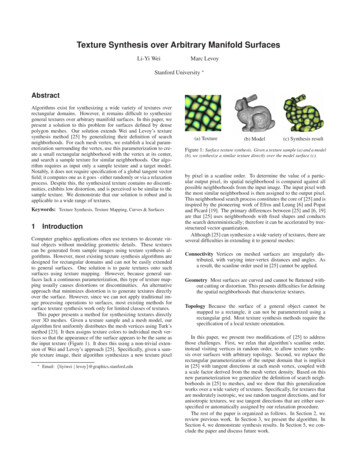
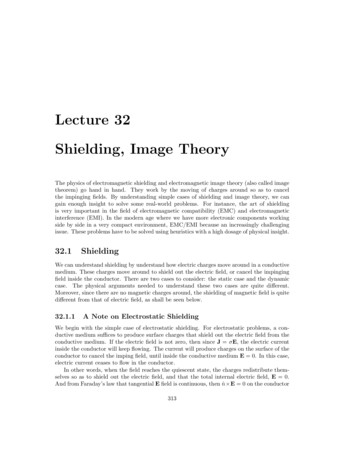
58M.H. Bharati et al. / Chemometrics and Intelligent Laboratory Systems 72 (2004) 57–71Structural texture analysis techniques describe a textureas the composition of well-defined texture elements such asregularly spaced parallel lines. The properties and placementrules of the texture elements define the image texture.Various structural texture analysis approaches have beenproposed, ranging from using different shapes of structuringelements [12] to conceiving real textures as distorted versions of ideal textures [13]. However, these methods appearto be limited in practicality since they can only describevery regular textures [1].Model-based texture analysis techniques generate anempirical model of each pixel in the image based on aweighted average of the pixel intensities in its neighborhood. The estimated parameters of the image models areused as textural feature descriptors. Examples of suchmodel-based texture descriptors are autoregressive (AR)models [14], Markov random fields (MRF) [15], and fractalmodels [16].Finally, transform-based texture analysis techniques convert the image into a new form using the spatial frequencyproperties of the pixel intensity variations. The success ofthese latter techniques lies in the type of transform used toextract textural characteristics from the image. Indhal andNæs [17] illustrated the use of spectra from 2-D Fast FourierTransform (FFT) magnitude images for textural featureextraction. Image classification using Multi-way PrincipalComponent Analysis (MPCA) on 2-D FFT magnitudeimages to extract features from various images was usedby Geladi [18]. The Gabor or Wavelet transforms have beenpreferred recently in image texture analysis due to theirspace-frequency decomposition abilities. Features derivedfrom a set of Gabor filters have been widely used in textureanalysis for image segmentation [19]. Wavelet transformmethods of feature extraction have been used to characterizetexture and to treat the problems of texture segmentationand classification [4 –6,20 – 22]. The Angle Measure Technique (AMT) has been used to extract textural features fromunfolded image pixel values in order to characterize andpredict externally measured reference textures using multivariate statistical techniques [11,23].The purpose of this paper is to provide an overview anddiscussion of several of the above approaches and tocontrast them by applying them to the classification of thetexture of steel surface images. Differences among theapproaches and the limitations of some of them are highlighted, and some new approaches are presented. The paperis organized as follows. In Section 2, a brief description ofthe image data set (used in this paper for illustration of themethods) is presented, and the classification objectives aredefined. Sections 3– 5 will outline various approaches fortexture analysis and will apply them to the example imagedata set. Conclusions are given in Section 6.2. Description of data set and classification objectivesPrior to shipping, steel quality is often monitored byperforming random quality control checks on finished steelrolls. The quality of a steel sheet is reflected in the numberand severity of pits on its surface. Good quality steelsurfaces have few pits that are quite shallow and randomlydistributed. When the pits become deeper, start to join, andresult in deep craters throughout the steel, the surfacequality is considered to be bad. Skilled graders visuallydetermine the degree of steel surface pitting based onvarious criteria developed from previous experience andby comparison with standard samples. Classification usingthese criteria is time consuming and requires very experienced graders. Thus, an automated image-based gradingsystem would be useful.For this study, a total of 35 images of steel surfaces wereobtained. Sheets with varying degrees of surface pits werecut from finished steel rolls. In order to highlight the surfacepits prior to imaging, each slab is pre-treated by pouringblack ink upon the surface. After the ink had filled into thepits, the steel slabs are lightly cleaned with a cloth. Thisresults in the steel surface pits being represented by blackareas. The stained steel slabs are then digitally imaged asgrayscale images.Fig. 1 shows examples of steel surface images withexcellent, good, medium and bad surface qualities. Anexample of bad surface quality (see Fig. 1d) contains various‘snake’-like patterns representing deep pits that have joinedto form craters. Fig. 1c illustrates an example of a mediumFig. 1. Examples of three types of steel surface grayscale images. (a) Excellent surface quality (E02), (b) good surface quality (G02), (c) medium surface quality(M06), and (d) bad surface quality (B12).
M.H. Bharati et al. / Chemometrics and Intelligent Laboratory Systems 72 (2004) 57–71quality surface, which contains more pronounced pits ascompared to the excellent and good quality samples. However, it does not contain the serpentine patterns exhibited bythe bad quality steel. In all the data set images, ink smudgemarks are also evident on the steel surfaces due to the manualcleaning of excessive ink with a cloth. The complete steelimage data set from the four pre-labeled surface qualityclasses is available from the McMaster Advanced ControlConsortium (MACC) FTP server [24]. Each image is an 8-bitgrayscale image with pixel dimensions of 479 508. Allimages have been pre-processed to enhance their contrast viaintensity histogram stretching [25]. Table 1 shows thedivision of 35 sample images into their respective prelabeled classes, as determined by experienced graders. However, it is important to note that the selected classes are notclearly separated, but rather represent a progression from badto excellent with the boundaries quite vague, particularlybetween the good and excellent classes.The objective of using this data set is to illustrateclassification based on the presented texture analysis techniques using the pre-labeled classes as a benchmark, and tocomment on some of their strengths and weaknesses. Noattempt is made to assess the performance of each methodbased on error rates of classification since the sample size(35 images) is inadequate for that purpose.Data classification using the latent variable spaces ofmultivariate statistical methods like PCA and PLS has beenwidely used in the chemometrics literature [26]. Unsupervised classification can be achieved through observing scoreclustering patterns in the latent space of a single PCA model.Supervised classification schemes based on building modelsfor the known classes are Soft Independent Modeling ofClass Analogy (SIMCA) approach [27] and Partial LeastSquares Discriminant Analysis (PLS-DA) [28]. Because thepurpose of this paper is to analyze different approaches fortextural feature extraction, PCA and PLS-DA are usedthroughout this paper as unsupervised and supervised classification methods, respectively.Table 1Pre-labeled classes of the complete steel surface grayscale image data setand basic statistics of pixel intensitiesExcellent surfaceGood surfaceMedium surfaceBad surfaceSample IDSample IDSample IDSample 0B11B12Underlined samples are used as test data in supervised classification.593. Texture analysis using gray level co-occurrencematrix featuresIn this section, the GLCM is presented as representativeof the statistical approaches to texture analysis. The GLCMof an image is an estimate of the second-order jointprobability, Pd(i, j) of the intensity values of two pixels (iand j), a distance d apart along a given direction h, i.e., theprobability that i and j have the same intensity. This jointprobability takes the form of a square array Pd, with row andcolumn dimensions equal to the number of discrete graylevels (intensities) in the image being examined. If anintensity image were entirely flat (i.e. contained no texture),the resulting GLCM would be completely diagonal. As theimage texture increases (i.e. as the local pixel intensityvariations increase), the off-diagonal values in the GLCMbecome larger.The pixel intensity resolution of the steel surface grayscale images used in this paper is 8-bit, which result inGLCMs with dimensions of 256 rows 256 columns for agiven displacement vector. Finding GLCMs for all distances(d) and angles (h) would require a prohibitive amount ofcomputation. Haralick et al. [8] suggested using GLCMscalculated from four displacement vectors with d 1, or 2pixels, and h 0j, 45j, 90j, and 135j. In this example, onlyone GLCM was calculated for each of the 35 grayscale steelsurface images using a single displacement vector withd 1, and h 135j [(xlag,ylag) (1,1)]. The scale of thedisplacement vector was intentionally chosen to be 1 forsake of consistency and for comparison with the MIA-basedtexture analysis method described in Section 4.2. Because ofthe quite symmetric nature of the steel surfaces, a singleangle was found to be adequate.Haralick et al. [8] proposed a quantitative analysis of theGLCM through 14 textural descriptors calculated from Pd,although typically only a few of these are widely used[7,29 –31]. In this paper, four of the most commonly useddescriptors (the angular second moment, contrast, correlation, and entropy) are used to extract textural features fromthe 35 GLCMs of the steel surface grayscale image data set.Angular Second Moment ¼n XnXfPd ði; jÞg2ð1Þi¼1 j¼1Contrast ¼n 1Xk¼0k2n XnXPd ði; jÞi¼1 j¼1Ai jA¼kn XnXCorrelation ¼Entropy ¼ i jPd ði; jÞ lx lyi¼1 j¼1rx ryn XnXi¼1 j¼1ð2ÞPd ði; jÞlogfPd ði; jÞgð3Þð4Þ
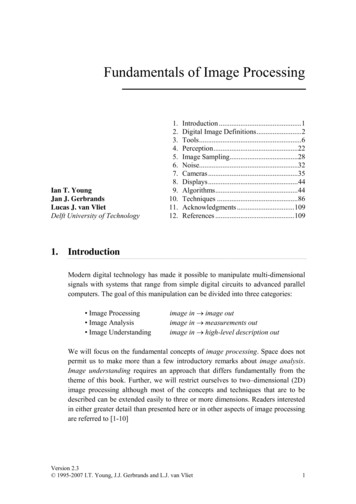
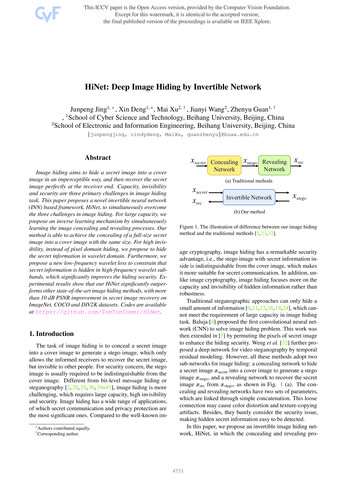
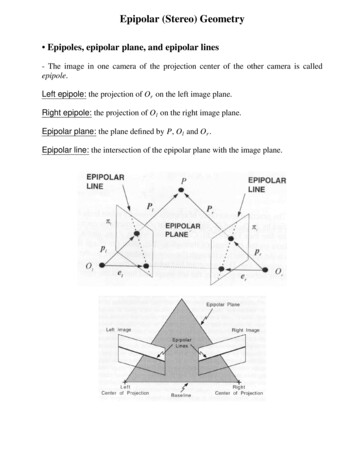
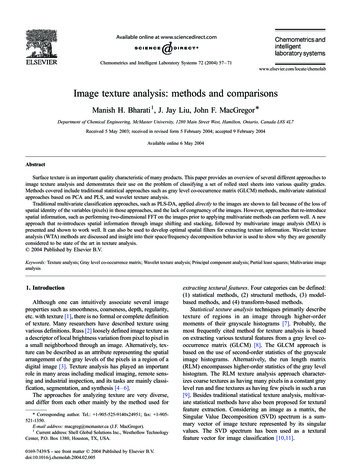
60M.H. Bharati et al. / Chemometrics and Intelligent Laboratory Systems 72 (2004) 57–71Fig. 2. Unsupervised classification of steel surface images in the latent space of GLCM features.where the means and variances in the x and y direction aregiven bylx ¼nnnnXXXXiPd ði; jÞ; ly ¼jPd ði; jÞi¼1j¼1j¼1ð5Þi¼14.1. Supervised classification of steel surface images usinga direct application of PLS-DA to image texturennXXrx ¼ði lx Þ2Pd ði; jÞ;i¼1j¼1nnXXry ¼ðj ly Þ2Pd ði; jÞj¼1because of their loss of spatial information, and to discussand illustrate modifications of the approach that regainspatial information and thereby allow for efficient texturalclassification.ð6Þi¼1Fig. 2 illustrates the achieved unsupervised classificationof the 35 steel surface images in the score space of PCA. Itcan be seen that excellent, good, and bad surfaces are notseparable at all, although the t1 axis separates the mediumsurfaces from the others quite well. (In Fig. 2, highlightingof the cluster boundary is done for visual purposes only.)Supervised classification using PLS-DA fails to show anyimprovement in separating the excellent, good, and badsurfaces.4. Direct multivariate statistical approaches to textureanalysisIn this section, we examine multivariate statisticalapproaches to extract textural information by applyingPCA and PLS to image texture directly. The intention isto show the limitations of these approaches that ariseA data matrix X is constructed, which contains n rowseach corresponding to the unfolded pixel data from one steelsurface image. Since the class belonging of each image isknown a priori, this information is provided through a Ymatrix of dummy (0,1) variables in order to train the PLSDA regression model (Fig. 3). The model is built between Xand Y for a training set of images comprising representativesamples from each class. Once trained, the PLS-DA modelcan be used on a validation set of new images in order topredict their class belongings. This approach has beenpresented [32] using an equivalent but more parsimoniousX matrix, with each row comprising a selected set ofwavelet coefficients to represent each image.Out of the 35 steel images, a training set of 25 images(ones without underline in Table 1) representing the foursurface qualities was chosen to develop the PLS-DA regression model. The developed PLS-DA model was then testedon a test set of the remaining 10 steel sample images(underlined ones in Table 1).Pixels from 25 steel surface grayscale images of thetraining set (each image has dimensions: 479 508 pixels)were unfolded into observations of the predictor array X
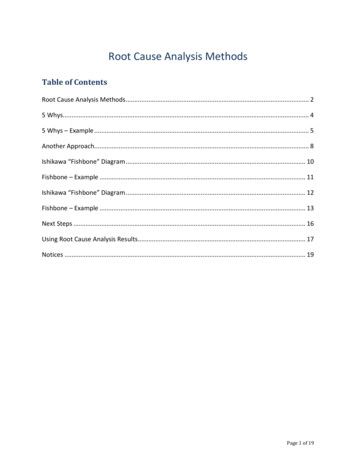
M.H. Bharati et al. / Chemometrics and Intelligent Laboratory Systems 72 (2004) 57–7161Fig. 3. Schematic of training a PLS-DA model to discriminate steel surface images.(with dimension: 25 rows 243,332 columns). As seen inFig. 3, the columns of X represent unique pixel locationsthrough the steel surface images. A kernel-based PLSalgorithm [33] was used to develop the PLS-DA regressionmodel between X and Y.Two (A 2) latent variables were found to be significantand the variance explained on the fitted samples was R2y 0.9. The latent variables (t1,t2) of the resulting PLS-DAmodel provide a low-dimensional multivariate descriptionof the images in the rows of X (which simultaneouslyaccounts for their class memberships provided in Y).Fig. 4 illustrates a scatter plot of the two score vectors (t1and t2) of the trained PLS-DA model using the steel surfacetraining set data. Solid points represent the training setsamples from four surface quality classes. According tothe manually highlighted point clusters in Fig. 4 (done onlyfor visual purposes), it can be seen that the discrimination ofthe training set steel sample images is very good.Fig. 4. Supervised classification of steel surface images using a direct application of PLS-DA to image texture.
62M.H. Bharati et al. / Chemometrics and Intelligent Laboratory Systems 72 (2004) 57–71A model developed from a training set is of little use if itcannot adequately classify new images, not included in theoriginal training set. Hence, the developed PLS-DA modelwas used on the 10 steel surface images from the test set. ThePLS-DA scores values (t1,t2) for these test images areindicated by cross (‘ ’) points in the t1 vs. t2 score plot inFig. 4. It can be seen from the figure that the PLS-DA modelfails miserably in classifying the new steel surface images.Although the PLS-DA classification in the training stageproduced tight and well separated score clusters (Fig. 4),none of the 10 validation set samples fell into their respectivepre-labeled classes and all had scores clustering around (0,0).The poor performance of the PLS-DA classification oftexture is not surprising because spatial information is lost inthese methods upon unfolding the grayscale steel surfaceimages into row vectors of X. Each column (variable) in Xrepresents a particular pixel location, whereas each row(observation) represents a unique steel surface image. UponPLS-DA decomposition of X, the resulting weight vectorsrelate the importance of different pixel locations (variables)to the classification provided in Y. However, unlike withchemical data or industrial data where a variable defined in Xdoes have a consistent meaning from observation to observation, the pixel values at the same locations in the differentimages (columns of X) do not have any meaningful relationship with one another. They represent pixel intensitiesfrom arbitrary locations on different steel surfaces. For allintensive purposes, the PLS-DA model would give similarresults (in terms of data fit and predictive ability) if one wereto construct X via unfolding each steel image by randomlyselecting the pixel locations in each image and forming rowvectors. This lack of congruency of the stacked imagesmakes such an analysis by PCA or PLS meaningless.Furthermore, any permutations of the columns of X (e.g.exchanging columns 1 and 125 in X) will result in exactly thesame model. In other words, multivariate projection methods(PCA and PLS) contain no spatial information on the relativelocation of the pixels with respect to one another.Since texture is a function of spatial variations inneighboring pixel intensities throughout an image, theabsence of spatial information in PCA or PLS models meansthey cannot be used directly for texture analysis. However,there are several ways in which spatial information can bereintroduced into PCA and PLS image models. These aredescribed in the following section.4.2. Classification using MIA of steel surface imagesaugmented with spatial informationThe lost of spatial information (upon unfolding images)could be regained to a certain extent if each individualtexture image were suitably augmented with different versions of itself using various techniques to form new variables of a multivariate image. The resulting data set may thenbe analyzed using MPCA and Multivariate Image Analysis(MIA) techniques [34]. In that case, the model would beforced to explain local variations of pixel intensities over apre-defined neighborhood.There are several ways of regaining spatial informationthrough augmenting the steel image. One approach is toapply multivariate statistical techniques to a suitable spatialtransform of the image data such as the two-dimensionalFast Fourier Transform (2-D FFT) spectrum. This approachis further discussed in the next section under transformbased methods.Other approaches are to augment each image with severalfiltered versions of the same image using any set of thespatial filters available in most image processing software,and then use MIA based on multi-way PCA or PLS to buildthe classification models. Such an approach was used byLied et al. [34] for texture-based discrimination of differentclasses within an image. Three different texture filters(Median filter, Laplace filter, and a compound filter with acombination of various filters) were used to filter the imageat each pixel location and the filtered versions of the imagewere used as new channels of a multivariate image. A stackof congruent images was created consisting of the originalimage with all its filtered versions aligned and stackedabove it. Hence at each pixel location, one had the originalgrayscale signal and directly above (or below) it the value ofvarious spatial filters applied at that pixel location. Classification of new images is then performed by segmentation(masking) in the feature (score) space of PCA.Difficulties in the above approach are to decide what‘potpourri’ of spatial filters to apply in order to obtain theaugmented image as well as the increase in the size of data.We therefore present an equivalent approach, but where thedata itself is automatically used to determine the optimalspatial filters that should be applied in order to obtain the bestclassification. In this approach, the spatial pixel intensitydistribution in the steel surface image is captured throughspatially shifting the image in different directions, and thenstacking the shifted images on top of each other to form athree-way pixel array, as shown in Fig. 5. The resulting threedimensional image data is a multivariate image where thethird dimension is the spatial shifting index. Each image insuch a stack would contain the same feature information, butat each pixel location, the vertical direction would containinformation at the pixel of interest, as well as at all spatiallocations surrounding it. Multi-way PCA will then findscores that are linear combinations of these spatially shiftedpixels defined by the loadings. Each score will thereforerepresent some form of spatial derivative filter that explainthe greatest variability in the training image.The only disadvantage in this scheme of image augmentation is that again one has a greatly expanded data set withmany more columns in the unfolded X matrix. In thisapproach, a single training image must be used, since asdiscussed earlier, there is no congruency among pixels ofdifferent images. Hence, the training image must containelements of all features that are important in the classification.Therefore, a composite image made up of digitally combining
M.H. Bharati et al. / Chemometrics and Intelligent Laboratory Systems 72 (2004) 57–7163Fig. 5. (a) A multivariate image created via spatial shifting in four adjacent directions and stacking the shifted images. (b) Eight possible directions in which animage could be shifted.several images (e.g., excellent, good, medium and bad steelimages) is usually used. Features are then obtained bysegmenting (masking) the PCA score plots (as commonlydone in MIA) into regions that define different texturecharacteristics. New images are then classified by evaluatingthe number of pixels falling into these feature masks. This isillustrated below for the steel surface examples.4.2.1. Texture analysis of steel images using MIA on shiftedand stacked imagesPerforming MIA of a multivariate image resulting fromspatially shifting and stacking an image (Fig. 5) allows thelatent variables of multi-way PCA to extract almost anytwo-dimensional spatial filter structure allowable by theamount (and direction) of shifting. The steel surface imagesample previously shown in Fig. 1d representing bad steelsurface quality is used in this study as the training image. Itcontains almost all features present in the 35 steel samples,and hence was deemed to provide a reasonable trainingimage. The original image was spatially shifted in eightadjacent directions (see Fig. 5b) by 1 pixel, and the shiftedimages were stacked above the original to form a ninevariable multivariate image. After shifting and stacking, theresulting three-way array was cropped at the edges todiscard all the non-overlapping sections. MPCA decomposition was then performed on the resulting multivariateimage array (Xbad) without any pre-scaling or mean centering of the data. The cumulative percent sum of squaresexplained by the first three PCs was 99.20%. Only the firstthree PCs have been used in subsequent analyses, with therest of the PCs (four to nine) being attributed to explainingnoise in the multivariate image. Table 2 shows thecorresponding weights of the first three loading vectors(p1,p2,p3) with respect to the nine variable images of X bad.The loading vector coefficients have been re-arranged as3 3 arrays to correspond with the respective spatiallocations of the shifted pixels in the original image.Since no pre-scaling of the image data was performed thefirst Principal Component (PC) explains mainly the averagepixel intensity over their local area in the multivariateimage. This is evident from the fact that all nine p1 loadingcoefficients are positive and almost equal (Table 2a). Theresulting T1 score image of the first PC turns out to be ablurred version of the original image due to the averagingnature of the p1 loading coefficients. This is due to the factthat PC1 extracts only the pixel contrast information fromthe multivariate image via averaging over a 3 3-pixelneighborhood around each pixel of the steel surface image.Thus it can be said that PC1 serves as a smoothing filter onthe original steel surface image.Upon deflating the X matrix by removing this meanintensity prediction of the first PC, the second and third PCsof MIA extract the remaining feature information. Fig. 6aand b illustrates the second and third PC score images T2and T3 of the original steel surface image, respectively. Aclose observation of the T2 image reveals that the 2nd PCpredominantly extracts horizontal and diagonal edge information (i.e. 45j and 135j) with respect to the center of theimage. On the other hand, it can be seen from the T3 scoreimage that the main feature extracted by PC3 is the verticaland diagonal surface pit edge information.The p2 and p3 loading vector coefficients are given inTable 2b and c, respectively. It can be seen that the secondPC is simply a vertical first derivative filter, and hence willextract mainly horizontal edge information. Similarly, theloadings of the third PC shown in Table 2c shows that p3 issimply a horizontal derivative filter which highlights mainlythe vertical edges of the surface pits as illustrated in the T3image reconstruction in Fig. 6b. The sum of the loadingcoefficients for p1 is approximately 1, and the sum of thecoefficients for both p2 and p3 is approximately 0. Thisagrees with the convolution kernels of a low pass smoothing
64M.H. Bharati et al. / Chemometrics and Intelligent Laboratory Systems 72 (2004) 57–71vectors against each other and observe the pixels as pointclusters (score space) in a color-coded two-dimensionalhistogram. Fig. 7 shows the PC12 (t1 vs. t2) and PC23 (t2vs. t3) score plot of the bad steel surface image.Further insight of the MIA score space can be gatheredupon interrogating score point clusters using a maskingstrategy [37] in the score space to delineate pixels havingsimilar features and then highlighting the pixels under thescore plot mask in the T1 score image. Fig. 8a illustratessuch a mask (shown as a gray rectangle) in the PC12 scoreplot of the training image that captures all pixels having lowt1 values. The corresponding masked pixels have beenhighlighted (as white) and overlaid on the T1 score image(shown in Fig. 8b). This low t1 mask clearly captures all thedeep pits in the image.Since the second and third PCs have been shown torepresent first-derivative filters in the vertical and horizontaldirections, respectively, the large positive or negative valuesof t2 and t3 will correspond to pixel locations where rapidintensity changes are occurring. Fig. 9a illustrates a maskFig. 6. (a) T2 image of bad steel surface quality image; (b) T3 image of badsteel surface quality image.filter and first-derivative edge detection filters in the imageprocessing
Statistical texture analysis techniques primarily describe texture of regions in an image through higher-order moments of their grayscale histograms [7]. Probably, the most frequently cited method for texture analysis is based on extracting various textural features from a gray level co-occurrence matrix (GLCM) [8]. The GLCM approach is