Transcription
2019 Healthy TexasMothers & Babies DataBookNovember 2019
Table of Contents1. Purpose . 22. Data Sources & Terms . 3Data Sources Used .3Data Terms .53. Birth Demographics . 9Maternal Race/Ethnicity . 10Maternal Age . 114. Infant Mortality & Morbidity . 15Infant Mortality Rate . 15Causes of Infant Death . 19Preterm Birth . 21Low Birth Weight . 24Perinatal Periods of Risk . 275. Infant Health Practices. 33Breastfeeding . 33Placing Infants on their Back to Sleep . 366. Prenatal Care . 377. Maternal Health . 40Smoking . 40Pre-Pregnancy Obesity . 42Hypertension & Diabetes . 46Maternal Mortality . 48Severe Maternal Morbidity . 50Neonatal Abstinence Syndrome . 528. Delivery . 559. Conclusion . 56Appendix A. More Information on Infant & Maternal Health in Texas . A-1Appendix B. Tables for Select Figures . B-11
1. PurposeThe 2019 Healthy Texas Mothers & Babies Data Book provides an overview of infantand maternal health in Texas. It is hoped that the trends and disparities in infantand maternal health outcomes highlighted in this report can help programs andpolicymakers make data-driven decisions about how to improve these outcomes inTexas. This data book is not meant to repeat results found in other places; rather,it is meant to bring different data sources together to be analyzed and reported in away that creates a cohesive view of the status of both infant and maternal health inTexas.Completion of this Data Book was supported by the Health Resources and ServicesAdministration (HRSA) of the U.S. Department of Health and Human Services(HHS) under grant number and title for grant amount (Grant Number B04MC33869,Maternal and Child Health Services, 33,958,965, 100 percent). This information orcontent and conclusions are those of the author and should not be construed as theofficial position or policy of, nor should any endorsements be inferred by HRSA,HHS or the U.S. Government.Texas Pregnancy Risk Assessment Monitoring System (PRAMS) is supported, inpart, through funding from the Centers for Disease Control and Prevention (CDC;Grant #5U01DP006204) and the Texas Maternal and Child Health Title V BlockGrant Program. The contents of this publication are solely the responsibility of theauthors and do not necessarily represent the views of the CDC.2
2. Data Sources & TermsData Sources UsedVital records data (information from Texas birth, death, fetal death, and linkedbirth-death files), as well as results from the Texas Pregnancy Risk AssessmentMonitoring System (PRAMS) survey, were used in this report.The Texas Department of State Health Services (DSHS) Vital Statistics Sectioncollects demographic data on all (or the vast majority of) births and deaths inTexas, as well as information on fetal deaths weighing 350 grams or more or, ifweight is unknown, occurring at 20 weeks of gestation or more. Vital records filesare a rich and comprehensive source of data; however, the quality of birthcertificate data is dependent on how accurately birth records are completed byhospital staff or providers. It is also thought that the birth file likely underreportsthe prevalence of several maternal health indicators, such as diabetes andpreeclampsia 1,2. In addition, 2017 and 2018 Texas birth and death file data areprovisional (are available for analysis before these datasets have been thoroughly‘cleaned’ and finalized), and as such, certain provisional data elements were notpresented due to potential data quality concerns. In this report, no geographicinformation was analyzed or reported using provisional 2018 data, and 2018provisional data were also not used when presenting maternal and infant deathoutcomes by race/ethnicity. Since final 2017 data were not available at the time ofthis report, these outcomes and maps were presented using provisional 2017 data.All other years of data used in this report are final.Data were suppressed in maps when there were between 1 and 4 cases in thenumerator, to prevent identification of affected individuals that could be possibleN. Haghighat, M. Hu, O. Laurent, J. Chung, P. Nguyen and J. Wu, "Comparison of birthcertificates and hospital-based birth data on pregnancy complications in Los Angeles andOrange County, California," BMC Pregnancy Childbirth, vol. 16, no. 93, 2016.12L. Vinikoor, L. Messer, B. Laraia and J. Kaufman, "Reliability of variables on the NorthCarolina birth certificate: a comparison with directly queried values from a cohort study,"Paediatr Perinat Epidemiol, vol. 24, no. 1, pp. 102-112, 2010.3
with such small numbers, thereby protecting the confidentiality and privacy of theseindividuals and their families.In Texas, the PRAMS survey provides the most comprehensive population-baseddata on maternal health before, during, and after pregnancy. Conducted inpartnership with the Centers for Disease Control and Prevention (CDC), DSHS hasbeen implementing PRAMS annually since 2002. The PRAMS survey asks questions(via mail or telephone) of mothers who have recently given birth on topics such asprenatal care, pregnancy intention, alcohol use, smoking, intimate partner violence,postpartum depression, breastfeeding, infant sleep position, and infant secondhandsmoke exposure. Unlike vital records data, which include information on almost allbirths and deaths in Texas, PRAMS data are obtained from a sample of women whoare residents of Texas and gave birth to a live infant. CDC provides Texas with asurvey data file that includes survey weights, and CDC ensures that analyses arerepresentative of women who have given birth to a live infant and are residents ofTexas. For example, the 1,756 women who completed the survey in 2017 wererepresentative of all 374,711 Texas residents who had a live birth. PRAMSdata/results are generalizable to women who are Texas residents with at least onelive birth within a specific year, whereas the birth file represents all live births inTexas. Because of this, along with potential sampling and reporting differences,PRAMS findings may differ from results obtained from vital statistics data. PRAMSresults are reported along with confidence intervals, and the width of the confidenceinterval – in other words, the distance between its upper and lower limits – is anindicator of the variability, and thus the reliability, of the results. Texas PRAMS dataare presented as estimated percentages or prevalence estimates to account forcomplex sampling and weighting. As with any self-reported survey, possibility ofrecall bias exists; that is, women may not answer the question correctly or leave itblank because they may not remember the event. However, the schedule of surveymailings begins 61 to 183 days after the birth of the infant to minimize this risk.Despite the few limitations described above, Texas vital records are invaluablesources of data on the status of infant and maternal health, and PRAMS providesmuch-needed information about maternal risk and health pre-pregnancy, duringpregnancy, and post-pregnancy that is not available elsewhere. Both Texas vitalrecords and PRAMS data are used by DSHS and other state agencies andstakeholders to inform, develop, and drive policies and programs to improve thehealth of mothers and babies, and to understand their emerging health needs.These sources provide a rich understanding of both infant and maternal health and4
serve as an important resource for risk factor analysis and for identification ofpossible avenues for prevention.Data TermsBaby-Friendly Hospital: A designation given to birthing facilities that offer anoptimal level of care for infant feeding (breastfeeding) and for mother/babybonding. To achieve accreditation as a Baby-Friendly Hospital, a facility mustdemonstrate a 75 percent exclusive breastfeeding rate or higher among mothers atdischarge, must adhere to the International Code of Marketing BreastmilkSubstitutes, and must successfully implement the Ten Steps to SuccessfulBreastfeeding, jointly developed by the World Health Organization (WHO) andUnited Nations International Children's Emergency Fund (UNICEF) 3.Body Mass Index: Body mass index (BMI) is a measure of weight-for-height thatis often used to classify adults as being underweight, of normal weight, overweight,or obese 4. In this report, maternal BMI is calculated using the mother’s prepregnancy weight and height. Consistent with National Center for Health Statistics(NCHS) standards, BMI categories are defined using the standard cutoffs for adults,even if the mother is younger than 22 years of age 5.Causes of Infant Death: Cause of death categories from the NCHS InstructionManual are used to calculate information regarding the leading causes of infantdeath in this report 6. Not all infant deaths in Texas are due to the leading causesBaby-Friendly USA, "Baby-Friendly Hospital Initiative," 2012. [Online]. Available:https://www.babyfriendlyusa.org/about/. [Accessed 16 November 2018].3World Health Organization, "About Adult BMI," 29 August 2017. [Online]. ing/bmi/adult bmi/index.html. [Accessed 16November 2018].4A. M. Branum, S. E. Kirmeyer and E. C. Gregory, "Prepregnancy Body Mass Index byMaternal Characteristics and State: Data From the Birth Certificate, 2014," 5 August 2016.[Online]. Available: https://www.cdc.gov/nchs/data/nvsr/nvsr65/nvsr65 06.pdf. [Accessed5 August 2016].5National Center for Health Statistics, "ICD–10 cause-of-death lists for tabulating mortalitystatistics (updated March 2011 to include WHO updates to ICD–10 for data year 2011),"2011. [Online]. Available:65
shown in the report. Causes of infant death are reported as the number of deathsper 10,000 live births.Gestational Age: Gestational age is used to calculate whether a birth is preterm,as well as to calculate when in pregnancy the mother first received prenatal care.However, exact gestational age is often unknown and must be estimated. Beginningwith final 2014 data, NCHS has changed the variable used to estimate gestation 7.The current standard, starting in 2014, uses the obstetric estimate of gestation onthe birth certificate, and not a combination of last menstrual period and theobstetric estimate, as had been done in the past. This current standard forcalculating gestational age is used throughout the report.Infant Mortality: Infant mortality rate (IMR) is defined as the number of infantswho died in a given year divided by the number of live births in that same year.This number is then multiplied by 1,000 to calculate the IMR. All of the births thatcomprise this rate are restricted to those women with Texas listed as their state ofresidence.Perinatal Periods of Risk: A comprehensive approach designed to helpcommunities use data to improve infant and maternal health outcomes. In additionto infant deaths, fetal deaths are also included in the perinatal periods of risk(PPOR) analysis to provide more information. The PPOR analysis divides fetal andinfant deaths into four risk periods (maternal health/prematurity, maternal care,newborn care, and infant health), based on birth weight and age of death. Anexcess feto-infant mortality rate (F-IMR) is then calculated for each of theseperiods, both for the state as a whole and for specific demographic studypopulations. The reference group for each of these calculations is a state-levelreference population of mothers with near-optimal birth outcomes onManual2011.pdf. [Accessed 4 August2017].J. Martin, M. Osterman, S. Kirmeyer and E. Gregory, "Measuring gestational age in vitalstatistics data: transitioning to the obstetric estimate," Natl Vital Stat Rep, vol. 64, no. 5,2015.7M. Peck, W. Sappenfield and J. Skala, "Perinatal periods of risk: a community approach forusing data to improve women and infants' health," Matern Child Health J, vol. 14, no. 6, pp.864-874, 2010.86
Race/Ethnicity: For information obtained from birth records, fetal death records,or from PRAMS, race/ethnicity information shown throughout this report refers tothe mother, not the infant. However, infant death data are classified according toinfant’s race/ethnicity. Women who identified themselves as only White or Blackand who did not indicate that they were Hispanic were classified as White or Black,respectively. Women who identified themselves as Hispanic were classified asHispanic, regardless of their race designation. Women of all other races, includingmultiracial women, were classified as “Other”, if the woman did not self-identify asHispanic. The “Other” category is not homogeneous, and there have been shifts inthe demographics of women within this category. Since 2004, there has been anincrease in the number of women identifying themselves as multiracial. Starting in2016, as a result of the nationwide implementation of the 2003 revision of the U.S.Standard Certificate of Live Birth, national vital statistics data can also be classifiedusing the above race/ethnicity group definitions.Maternal Mortality: In this report, the rate of confirmed maternal deathsoccurring while pregnant or within 365 days of the end of pregnancy is presented.This maternal death rate is defined as the number of confirmed maternal deathswhile pregnant or within 365 days of the end of pregnancy for every 100,000 livebirths. Maternal deaths were confirmed by matching each woman's death recordwith a live birth or fetal death event that occurred within 365 days of the date ofdeath.Severe Maternal Morbidity: Severe maternal morbidity (SMM) is a term used todescribe any unintended outcomes of labor and delivery that result in significantconsequences for a mother’s health 9. A hospital delivery was considered an SMMcase if the mother had one or more of the conditions or procedures indicated on alist of SMM-related medical codes, including conditions such as acute renal failure,cardiac arrest, eclampsia, and sepsis, and including procedures such as bloodtransfusion and hysterectomy. The CDC SMM definition was used in this report tomake ICD-9 more comparable to ICD-10 10.Centers for Disease Control and Prevention (CDC), "Severe Maternal Morbidity in theUnited States," November 2017. [Online]. aternalinfanthealth/severematernalmorbidity.html. [Accessed December 2017].9Centers for Disease Control and Prevention (CDC), "How Does CDC Identify SevereMaternal Morbidity?," September 2019. [Online]. Available:107
anthealth/smm/severe-morbidityICD.htm. [Accessed 16 October 2019].8
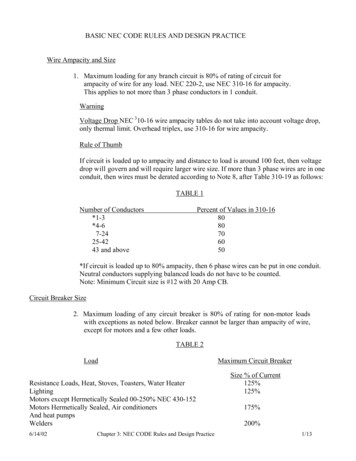
3. Birth DemographicsThe birth rate in Texas continued to decrease in 2018, after remaining stable from2011 to 2015 (see Figure 1). Texas has the fifth highest birth rate in the UnitedStates 11. In 2018, almost 390,000 babies were born in the state, and there werenearly 380,000 births to mothers that live in Texas.Figure 1 Birth Rate in Texas and The United States, 2009-2018J. Martin, B. Hamilton, M. Osterman, A. Driscoll and P. Drake, "Births: Final Data for2017," National Vital Statistics Report, vol. 67, no. 8, 2018.119
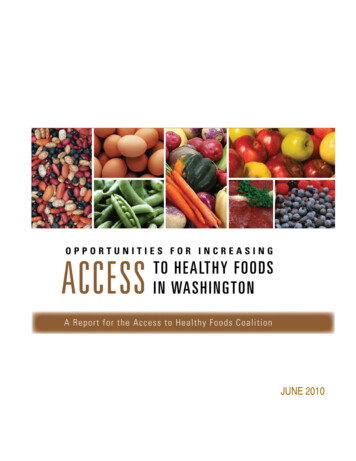
Maternal Race/EthnicityBirths to Hispanic women make up the largest percentage of all births in Texas,followed by births to White women, Black women, and women classified as ‘Other’race/ethnicity (see Figure 2).Although women who are classified as being of ‘Other’ race/ethnicity make up asmall proportion of the total number of Texas births, this race/ethnic group has hadthe largest increase in the percent of total live births over the past decade in Texas(see Figure 2). More than 30,000 births in 2018 were to mothers who classifiedthemselves as Asian, multiracial, or other race/ethnic designations. However, it isimportant to keep in mind that this group is quite heterogeneous (encompassingmany different races/ethnicities), which often limits the interpretability of results forthis particular race/ethnic category.Figure 2 Distribution of Race/Ethnic Groups Among All Live Births, 2009-201810
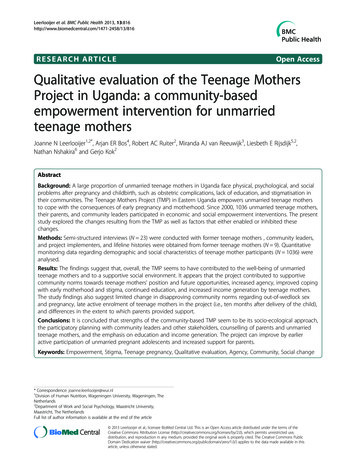
Maternal AgeAs in the United States as a whole, Texas has seen a shift in the maternal age ofwomen giving birth over time (see Figure 3) 12. The average maternal age at birth in2017 was 28.1 years of age, a significant increase from an average age of 26.1years in 2009.Figure 3 Maternal Age Distribution in 2009 and 2017T. Mathews and B. Hamilton, "Mean Age of Mothers is on the Rise: United States, 2000–2014," NCHS Data Brief, vol. 232, 2016.1211
The average age for women with a live birth in 2017 differed by region (see Figure4). Counties with major urban centers tended to have older average maternal ages.Figure 4 Average Age of a Woman with a Live Birth, 201712
The increase in average maternal age observed over the past decade is likely due inpart to a marked decrease in the teen birth rate. Texas, like the rest of the country,has reported dramatic decreases in the teen birth rate since 200912. This drop hasbeen particularly steep for Hispanic and Black youth (see Figure 5). Over the past10 years, the teen birth rate has declined by 58.2 percent among Hispanic youthand has declined by 54.4 percent among Black youth.Although Texas has experienced a steady decrease in the teen birth rate over thepast decade, as of 2017, Texas had the sixth highest teen birth rate in the UnitedStates (among females 15-19 years old)11.Figure 5: Teen (15 - 19 year old) Birth Rate per 1,000 Females by Race/Ethnicity,2009-201813
Additionally, several areas in Texas have high teen birth rates when compared tothe rest of the state (see Figure 6). Many counties in the border regions of the stateand in the Texas Panhandle have high teen birth rates.Figure 6 Teen Birth Rate per 1,000 Females Age 15-19 Years Old, 201714
4. Infant Mortality & MorbidityInfant Mortality RateIn 2018, the Texas infant mortality rate (IMR) reached a historic low of 5.5 deathsper 1,000 live births. The IMR in Texas has been at or below the national rate forthe past 10 years (see Figure 7). Moreover, since 2011, the state has consistentlybeen below (exceeded) the Healthy People 2020 (HP2020) target of 6.0 deaths per1,000 live births.Figure 7 Infant Mortality Rate in Texas and the US, 2009-201815
However, racial/ethnic disparities in IMR have persisted in Texas, and it is clear thatthe overall decrease in IMR observed in Texas over the past decade was not equallydistributed across all race/ethnic groups (see Figure 8). IMRs for Black mothershave been twice as high as IMRs for White and Hispanic mothers over much of thistimeframe.Figure 8 Infant Mortality Rate in Texas by Race/Ethnicity, 2009-201716
In addition to race/ethnic disparities, substantial regional differences in IMR persistwithin the state. In 2017, many Texas counties met the HP2020 target of 6 orfewer infant deaths per 1,000 live births (see Figure 9). In contrast, CherokeeCounty, Fannin County, Wichita County, and Medina County had the highest IMRs;more than 10 deaths per 1,000 live births were reported in these counties in 2017.Figure 9 Infant Mortality Rate per 1,000 Live Births, 201717
Differences in IMR also exist by maternal age. In 2017, a higher IMR was observedamong young mothers less than 20 years of age than among mothers of any otherage group, followed by mothers age 40 years or older (see Figure 10). Mothers inthese two age groups comprised 9.9 percent of all Texas resident births in 2017.Figure 10 Infant Mortality Rate by Age Group, 201718
Causes of Infant DeathCauses of infant death are presented in this 2019 Data Book using provisional 2017data before they are finalized, because final 2017 data were not available at thetime of this report. Overall, the leading cause of death for infants younger than oneyear in Texas is congenital malformation (birth defects; see Figure 11). Amonginfants older than 28 days, Sudden Infant Death Syndrome (SIDS) is the secondleading cause of death. The provisional 2017 SIDS rate is likely an underestimate ofthe final 2017 SIDS rate, because deaths due to SIDS have a longer reporting lagtime compared to deaths due to other infant causes of death 13.Figure 11 Leading Causes of Infant Death, 2009-2017L. Rosen, L. Womack, M. Spencer and F. Ahmad, "Timeliness of Infant Death Data forInfant Mortality Surveillance and Quarterly Provisional Estimates," Vital Statistics RapidRelease, no. 5, 2018.1319
Leading causes of infant death also differ by race/ethnicity. In 2017, the leadingcause of death among Black infants was short gestation and low birth weight,whereas congenital malformation was the leading cause of death among infants ofall other race/ethnic groups (see Figure 12).Figure 12 Leading Causes of Death by Race/Ethnicity, 201720
Preterm BirthPreterm births are those that occur prior to 37 weeks of gestation. Preterm birthrates in both Texas and the nation decreased during 2009 to 2015. However, in2018, the Texas preterm birth rate increased for the third year in a row, as did thenational rate of preterm birth. The preterm birth rate in Texas has consistentlybeen higher than the national average over the past 10 years (see Figure 13).Figure 13 Percent of Live Births Born Preterm (less than 37 weeks) in Texas andUnited States Using Obstetric Estimate of Gestation, 2009-201821
As with IMR, there are substantial racial/ethnic disparities in the preterm birth rate(see Figure 14). Black infants have a higher preterm birth rate than do infants ofany other race/ethnic group.Figure 14 Percent of Live Births Born Preterm (less than 37 weeks) in Texas byRace/Ethnicity Using Obstetric Estimate of Gestation, 2009-201822
Figure 15 shows the percentage of preterm births by county in Texas. There wereno clear geographic patterns or regional disparities for low birth weight rates withinthe state.Figure 15 Percent of Live Births Born Preterm (less than 37 weeks) in Texas UsingObstetric Estimate of Gestation, 201723
Low Birth WeightThe percentage of babies born with a low birth weight in Texas (weighing less than2500 grams) increased slightly in 2018. The rate of low birth weight infants inTexas is slightly higher than the national rate, and Texas is currently not meetingthe HP2020 target of 7.8 percent or fewer of all live births weighing less than 2500grams (see Figure 16).Figure 16 Percent of Births that are Low Birth Weight (less than 2500 g) in Texasand the United States, 2009-201824
As with IMR and preterm births, Black mothers have a disproportionately highpercentage of low birth weight infants (see Figure 17). The rate of low birth weightinfants is also higher among mothers in the ‘Other’ race/ethnic category thanamong White or Hispanic mothers.Figure 17 Percent of Births that are Low Birth Weight (less than 2500 g) in Texasby Race/Ethnicity, 2009-201825
Although some counties in Texas met the HP2020 target for percentage of low birthweight infants in 2017, many counties did not (see Figure 18). Regional differenceswere observed; many counties in south and east Texas had higher percentages oflow birth weight infants than the state as a whole.Figure 18 Percent of Infants born Low Birth Weight (less than 2500g), 201726
Perinatal Periods of RiskAlthough Texas has made significant progress in reducing infant mortality, datashow continued disparities in infant mortality and feto-infant mortality amongdifferent racial/ethnic groups, especially between Black and White women. Tobetter understand these disparities, a perinatal periods of risk analysis (PPOR) wasundertaken, which examines the risk of feto-infant mortality during differentperinatal periods. Based on birth weight and age at death, fetal and infant deathswere partitioned into four corresponding risk periods (see Figure 19)8.Figure 19 Perinatal Periods of Risk (PPOR) Risk Periods: Points of InterventionEach of these periods has different risk factors and causes of death, and hence,different opportunities for prevention; therefore, the four risk periods representdistinct points of intervention in the health care continuum (see Figure 19)8.Phase I AnalysisTexas and specific study populations (i.e., Black, White, Hispanic, or teens) werecompared to a state-level reference group generally known to have better fetoinfant mortality outcomes (i.e., non-Hispanic White women who are at least 20years of age and have 13 years of education). In the following analysis, thesestudy populations are not mutually exclusive. The feto-infant mortality rate (F-IMR)is calculated as the number of fetal and infant deaths per 1,000 live births and fetaldeaths. The 2015 F-IMRs were 6.2 per 1,000 for White mothers, 12.2 per 1,000 forBlack mothers, 6.9 per 1,000 for Hispanic mothers, and 9.0 per 1,000 for teenmothers. The excess F-IMR is the difference in F-IMR between the study populationand the reference group. In 2015, Black mothers experienced a total of 7.1 excess27
fetal and infant deaths per 1,000 live births and fetal deaths. Total excess F-IMRsfor White mothers, Hispanic mothers, and teen mothers were 1.1 per 1,000, 1.9per 1,000, and 4.0 per 1,000, respectively (see Figure 20).Figure 20 Excess Feto-Infant Mortality Rates (F-IMR), 2015Black women had the highest excess F-IMR for all four risk periods (see Figure 20),with 59 percent of all Black fetal and infant deaths being potentially preventabledeaths (i.e. excess fetal and infant deaths). Moreover, 42 percent of the overallexcess Black fetal and infant deaths occurred in the Maternal Health/Prematurityrisk period. For teen mothers, 77 percent of excess feto-infant deaths occurred inthe Maternal Health and Infant Health risk periods.28
Phase II AnalysisFor fetal and infant deaths in the Maternal Health/Prematurity risk period, aKitagawa analysis was conducted for each study population to examine whetherexcess feto-infant mortality was primarily due to a greater number of very low birthweight (VLBW) births in the study population compared to the reference population(a difference in birth weight distribution), or to a higher mortality rate among VLBWinfants than seen in the reference population (a difference in birth weight specificmortality) 14. In other words, did the excess feto-infant mortality emerge because ofthe greater number of VLBW infants in the study population compared to thereference group, or because VLBW infants died at higher rates compared to thereference group? The percentage of excess deaths attributable to a difference inbirth weight distribution compared with the percentage attributable to a differencein birth weight specific mortality rates are shown in Figure 21 for each studypopulation.Figure 21 Percent of Excess Death Attributable to Birth Weight (BW) Distributionvs. Birth Weight (BW) Specific Mortality, 201514C. Stampfel, C. Kroelinger, M. Dudgeon, D. Goodman, L. Ramos and W. Barfield,"Developing a standard approach to examine infant mortality: findings from the State InfantMortality Collaborative (SIMC)," Matern Child Health J, vol. 16, pp. 360-369, 2012.29
For all subpopulations examined, the majority of excess MaternalHealth/Prematurity risk period deaths were attributable to a greater number ofVLBW births in these groups when compared to the reference population. Notably,Black infants (0 percent) had lower mortality rates among VLBW births than thereference population; for this subgroup, all excess deaths (100 percent) werepotentially attributable to a greater number of VLBW births (see Figure 21). For allof these study populations, and especially for infants born to Black mothers,interventions aimed at reducing the number of VLBW births are likely to be mosteffective at closing the gap in feto-infant mortality. For infants born to Whitemothers, Hispanic mothers, and teen mothers, some proportion of excess fetoinfant death was also attributable to a higher mortality rate among VLBW birthsthan the reference population.To examine differences in birth weight distribution during the MaternalHealth/Prematur
The 2019 Healthy Texas Mothers & Babies Data Book provides an overview of infant and maternal health in Texas. It is hoped that the trends and disparities in infant and maternal health outcomes highlighted in this report can help programs and policymakers make data-driven decisions about how to improve these outcomes in Texas.