Transcription
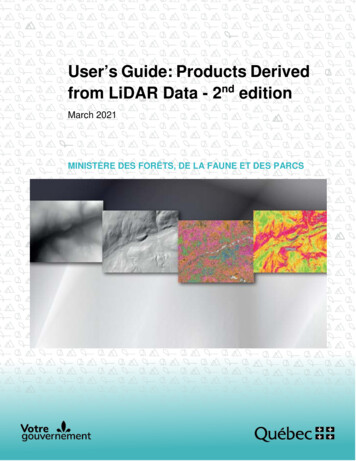
User’s Guide: Products Derivedfrom LiDAR Data - 2nd editionMarch 2021MINISTÈRE DES FORÊTS, DE LA FAUNE ET DES PARCS
For additional information, please contact the ministère des Forêts, de la Faune et des Parcs duQuébec:Direction des inventaires forestiers5700, 4e Avenue Ouest, local A-108Québec City (Québec) G1H 6R1Telephone: 418 627-8669Toll-free: 1 877 .gouv.qc.ca/les-forets/inventaire-ecoforestier/ Gouvernement du QuébecMinistère des Forêts, de la Faune et des ParcsLegal Deposit Bibliothèque et archives nationales du Québec, 2021ISBN 978-2-550-88939-7 (2nd edition, 2021)ISBN 978-2-550-77405-1 (1st edition, 2016)
WRITTEN BYAntoine Lebœuf, F.Eng., Ph. D. 1Marie-Soleil Fradette, F.Eng., M. Sc.1Isabelle Pomerleau, F.Eng. 1WRITTEN IN COLLABORATION WITHMarc-Olivier Lemonde, F.Eng., M.Sc. 1Jean-François Bourdon, F.Eng. 1ILLUSTRATIONS AND MAPSAntoine Lebœuf, F.Eng., Ph. D.1Jean Mercier, F.Tech.1Valérie Roy, Geomatics Technician 1Valérie Teasdale, Biol., M. Sc., Trainee,Bachelor’s Degree in Forest Developmentand Environment 2Dave Munger, Geomatics and LiDAR Analyst 3Marc-Olivier Lemonde, F.Eng., M. Sc.1Mélanie Major, F.Eng., M. Sc.1Anne Theodorescu, F.Eng. 1PAGE LAYOUTGeneviève Barry, Secretary1Josiane Savard, Secretary1TRANSLATION AND REVISIONBrenna Douglas, Geomatics Technician 4Christine Gardner, Independent TranslatorLaurence Carignan 5Mélanie Major, F.Eng., M. Sc.1Anne Theodorescu, F.Eng.114Direction des inventaires forestiers, MFFPUniversité Laval3Direction de la gestion des forêts du Saguenay– Lac-Saint-Jean, MFFP2Direction de la prestation de servicesspécialisés, MERN5Direction des communications, MFFP-MERN
Table of ContentsIntroduction. 11LiDAR derived products . 21.1Digital Terrain Model (DTM). 21.2Hillshade (Shaded Relief) . 21.3Canopy Height Model (CHM). 31.4Slope Model (Slopes) . 42Availability of LiDAR Derived Products . 53Access to LiDAR Derived Products . 64Raster Data in ArcGIS . 74.14.1.1View Raster Data . 74.1.2Change the Symbology and Select Classes . 84.1.3Create a Transparent Layer of a DTM combined with a Hillshade . 104.1.4Create a Hillshade from a DTM . 124.1.5Create a Slope Model . 154.1.6Assemble Several Rasters . 184.1.7Clip Raster Data in a Given Sector . 194.25Basic Features . 7Advanced Features . 224.2.1Create Contour Lines . 224.2.2Reclassify Rasters . 244.2.3Convert a Raster Image to Vector Format (Polygons) . 254.2.4Create a Focal CHM . 264.2.5Topographic Wetness Index . 27Raster Data in QGIS. 295.1Download and Install the software . 295.2Basic Features . 305.2.1View Raster Data and Download Predefined Symbologies . 305.2.2Change the Symbology and Select Classes . 345.2.3Create a Transparent Layer of a DTM combined with a Hillshade . 35Ministère des Forêts, de la Faune et des ParcsI
5.2.4Create a Hillshade from a DTM . 365.2.5Create a Slope Model . 385.2.6Assemble Several Rasters . 405.2.7Clip Raster Data in a Given Sector . 415.3Advanced Features . 435.3.1Create Contour Lines . 435.3.2Reclassify Rasters . 455.3.3Convert a Raster Image to Vector Format (Polygons) . 475.3.4Create a Focal CHM . 515.3.5Topographic Wetness Index . 526Conclusion. 557References . 56Ministère des Forêts, de la Faune et des ParcsII
User’s Guide: Products Derived from LiDAR Data - 2nd editionINTRODUCTIONIt has often been shown that the information obtained from aerial LiDAR 6 surveys generatessignificant economic benefits for the forest industry and for several other Québec governmentactivity sectors (Lebœuf et al., 2015 7). Nevertheless, the use of raw LiDAR data remains complexand requires extensive experience and advanced computing tools. To facilitate the use of this dataand optimize the benefits of LiDAR data use, the ministère des Forêts, de la Faune et des Parcs(MFFP) has therefore generated and made available a range of user-friendly products derivedfrom LiDAR data.The purpose of this document is therefore to:i)ii)iii)iv)present the basic products derived from LiDAR data that are available as open sourcedata;explain the basic tools that facilitate their use in ArcGIS;explain the basic tools that facilitate their use in QGIS;present the tools that can be used to develop new derived products (e.g. generatecontour lines, convert rasters to polygons, fill lakes, delimit drainage basins (watersheds),reclassify rasters, generate a focal CHM, generate a topographic wetness index, etc.).LiDAR: Light Detection and Ranging.Available online: e/Analyse retombees LiDARFinale.pdf67Ministère des Forêts, de la Faune et des Parcs1
User’s Guide: Products Derived from LiDAR Data - 2nd edition1 LIDAR DERIVED PRODUCTSThe four basic products derived from LiDAR data are the: 1) Digital Terrain Model (DTM),2) Hillshade (Shaded Relief), 3) Canopy Height Model and 4) Slope Model. These products are inraster format and can easily be viewed in most basic GIS software packages, including ArcGIS andQGIS.The following is a list of technical characteristics common to the four products presented in thisdocument:Geodetic reference datumGeodetic reference systemProjectionProduction methodData-viewing softwareGRS 80 EllipsoidNAD 83 SCRSModified Transverse Mercator (MTM)Processed using Lastools, R, Gdal and ArcGISArcGIS, QGIS, MapInfo, etc.1.1 DIGITAL TERRAIN MODEL (DTM)This raster file provides real numerical values representingaltitudes in metres relative to the mean sea level. The raster file’spixel elevation values correspond to the linear interpolation of thenetwork of irregular triangles created from the ground points. Thespatial resolution of this raster is 1 metre.The DTM is a basic product derived from LiDAR. It serves primarilyto create the Hillshade and Slopes. It is also used for hydrologicalmodels, road construction, flood risk management, visuallandscape analyses, and so on.1.2 HILLSHADE (SHADED RELIEF)This raster file simulates the three-dimensional appearance of arelief map. It therefore does not contain altitude values. Shadowand light are shades of grey associated with integers from 0 to 255(from black to white). The spatial resolution of this raster is2 metres.A hillshade presents a very detailed image of the terrain and canbe used for the identification and interpretation of surficialdeposits, drainage, wetlands, etc.Ministère des Forêts, de la Faune et des Parcs2
User’s Guide: Products Derived from LiDAR Data - 2nd edition1.3 CANOPY HEIGHT MODEL (CHM)This raster file provides numerical values representing forestcanopy heights or the heights of other raised elements (e.g.buildings). It corresponds to the difference between the digitalsurface model and the digital terrain model. The“MHC nofeuillet.lyr” file represents a symbology (range of colours)for height in metres. The spatial resolution of this raster is 1 metre.The CHM can be used to measure height, density and stand structure, and to construct statisticalrelationships in order to map volumes, basal areas, etc.It should be noted that different elements must be taken into account before using the CHM toevaluate the height of trees or vegetation:1. Tree heights are generally slightly underestimated by LiDAR. The disparity is greater inconiferous forests than in deciduous forests. It is also greater when the point density islower. For example, a study done in the “reserve faunique des Laurentides” showed anunderestimation of -0.98 metres based on 431 tree measurements and a LiDAR datumwith a density of 7.1 points/m2 (Sadeghi et al., 2016). On the other hand, given thatseveral factors have to be taken into account (forest type, point density, forest cover,etc.), it is strongly suggested that users carry out their own field measurementcampaigns to determine if any adjustments to the data set are necessary.2. The CHM can accurately determine the height of trees and vegetation. Based on the topsof fir and spruce trees, the CHM may initially make it appear that the crowns are muchsmaller in width than they actually are, because sometimes only one pixel, located onthe highest point of the tree (e.g. 20 m), shows the actual height of the tree. The othersurrounding pixels indicate lower values for the crowns (e.g. 15 m).3. Finally, it should be noted that a certain expertise is required to integrate tree heightsderived from a CHM to forest stand polygons. It is necessary to take the local maxima(maximum height of each crown) from the CHM and choose from a multitude ofcalculation methods to integrate the various heights (example: 95 th percentile, modalheight, etc.).Ministère des Forêts, de la Faune et des Parcs3
User’s Guide: Products Derived from LiDAR Data - 2nd edition1.4 SLOPE MODEL (SLOPES)This raster file provides real numeric values representingslopes. The product is generated from the digital terrainmodel. The file “Pentes nofeuillet.lyr” represents asymbology (range of colours) for slope classes: A [0 to 3 %],B ] 83 to 8 %], C ]8 to 15 %], D ]15 to 30 %], E ]30 to 40 %], F ]40 to50 %], X1 ]50 to 70 %], X2 ]70 % and ].The slopes map can be used as a support tool for forest operationsor roads construction.8The open bracket shows that the value is excluded from the class.Ministère des Forêts, de la Faune et des Parcs4
User’s Guide: Products Derived from LiDAR Data - 2nd edition2 AVAILABILITY OF LIDAR DERIVED PRODUCTSThe first areas benefiting from LiDAR derived products in 2016 were the Saguenay – Lac-SaintJean region (UA 024-51), Mauricie region (UA 041-51) and the entire Outaouais region. In thefollowing years, several other regions of Québec were also able to benefit from these products.LiDAR products are expected to be available for all of southern Québec by the end of 2022. Forinformation on the areas for which products will be released in the future, please refer to theLiDAR product availability schedule onibilite produits derives LiDAR.pdfMinistère des Forêts, de la Faune et des Parcs5
User’s Guide: Products Derived from LiDAR Data - 2nd edition3 ACCESS TO LIDAR DERIVED PRODUCTSLiDAR derived products are available free of charge and can be viewed or downloaded throughthree different ways.A) Through the Forêt ouverte interactive map, users can view different basic LiDAR products anddownload them free of charge. To do this:1.2.3.4.5.6.Access the interactive map: https://www.foretouverte.gouv.qc.ca;In the menu, click on the “Cartes prédéfinies (Map themes)” tab.Choose the “LiDAR” theme.View the layers of your choice by clicking on the eye (it must be green).If the eye next to a layer is grey, zoom in.To download LiDAR derived products, display the layer “LiDAR — Téléchargement (pleinequalité)” and click on the map sheet you wish to download.7. If layers are superimposed, select the “LiDAR — Téléchargement (pleine qualité)” layer inthe new window that opens at the bottom of the screen.8. Select a product by clicking on the “Accéder” button.B) You can also view and download the data in a GIS (geographic information system) from thefollowing Web map service fcgi?C) It is also possible to download these products directly from the Données Québec website (thegouvernement du Québec collaborative, open data internet portal). To do this:1. Refer to the "Données Québec” LiDAR fact sheet. This fact sheet also contains otherinformation pertaining to the use of these products, including metadata (year ofacquisition, point density and presence of leaves).2. Directly access the data directory, where data is categorized by map fusion/DonneeGratuite/Foret/IMAGERIE/Produits derives LiDAR/.Ministère des Forêts, de la Faune et des Parcs6
User’s Guide: Products Derived from LiDAR Data - 2nd edition4 RASTER DATA IN ARCGISThis section covers basic operations used to facilitate the use of LiDAR derived products with thecommercial software package ArcGIS. While these techniques can all be used with other GISsoftware, the procedures will differ from one to another (operations for QGIS are described inChapter 5). Also, take note that the proposed “.lyr” symbology will not work with other GISapplications.4.1 BASIC FEATURES4.1.1 View Raster DataOnce you have downloaded the LiDAR derived products (see chapter 3), you can open the files inArcGIS by clicking on the “Add Data” button.In the following window, select the “.tif” file of the map sheet you wish to view, or select the “.lyr”file to view the symbology proposed with the data (Note: MHC CHM, MNT DTM,MNT Ombre Hillshade and Pentes Slopes).Ministère des Forêts, de la Faune et des Parcs7
User’s Guide: Products Derived from LiDAR Data - 2nd editionThe proposed symbology will appear if you selected a “.lyr” file.4.1.2Change the Symbology and Select ClassesTo modify the proposed symbology, place the cursor over the layer name, right-click and selectthe layer’s properties. The following window will appear. In the “Symbology” tab, click on“Classified” to change the number of classes. Then click on “Classify ” to change the class breakvalues.Ministère des Forêts, de la Faune et des Parcs8
User’s Guide: Products Derived from LiDAR Data - 2nd editionThe following window will open where you can change the class break values.To save the new symbology, place the cursor on the layer name, right-click and select “Save aslayer file”. You can then import this new “.lyr” symbology using the “Import” icon, as shown onthe following image.Ministère des Forêts, de la Faune et des Parcs9
User’s Guide: Products Derived from LiDAR Data - 2nd edition4.1.3 Create a Transparent Layer of a DTM Combined With a HillshadeCombining a DTM and a Hillshade can be used to interpret certain terrain features. First, you mustmodify the DTM’s symbology. To do so, position the cursor on the layer name and right-click toselect the layer’s properties.Next, in the “Symbology” tab, select the “Stretched” category and choose a color ramp. You canalso import the DTM’s “.lyr” to apply the predefined symbology (see section 4.1.1).Ministère des Forêts, de la Faune et des Parcs10
User’s Guide: Products Derived from LiDAR Data - 2nd editionNext, go to the “Display” tab of the layer’s properties window and apply a 50 % transparency.When you overlap the DTM with the Hillshade, interpretation of the two combined layersprovides information about both altitude and terrain.Ministère des Forêts, de la Faune et des Parcs11
User’s Guide: Products Derived from LiDAR Data - 2nd edition4.1.4 Create a Hillshade from a DTMThe proposed Hillshade was designed with ArcGIS’s default azimuth value of 315 . In some cases,depending on the direction of the glaciers, it may be appropriate to generate a hillshade atanother azimuth for the relief of certain terrain structures to stand out, such as eskers.To generate a new hillshade, you must add the DTM to ArcGIS. Next, open the image analysiswindow by clicking on “Windows” and then “Image analysis”.When the window appears, check the DTM to be edited. In the “Processing” section, select thedesired colour gradient (black and white in the following example) and click on the “Hillshade”icon:The hillshade will appear in ArcGIS.Ministère des Forêts, de la Faune et des Parcs12
User’s Guide: Products Derived from LiDAR Data - 2nd editionTo change the azimuth of the hillshade, place the cursor on the name of the newly generatedlayer and right-click to select the layer’s properties. Select the “Functions” tab, place the cursoron the hillshade function, right-click and then click on “Properties”.The following window, in which you can change the azimuth and Z factor in the “Hillshade” tab,will appear. We recommend that the Z factor be set to 2. It is preferable to set the azimuth to avalue perpendicular to the land structures to be detected, as shown in the two examples below,where the angle of 320 makes it possible to identify a steep slope, something that cannot bedone using an angle of 270 . A southern azimuth angle (e.g. 180 ) should not be used because thetopography will be reversed, as in the third example below.Ministère des Forêts, de la Faune et des Parcs13
User’s Guide: Products Derived from LiDAR Data - 2nd editionSteep slopeExample 1: Hillshade with a 270 azimuth and a Z factor of 2.Steep slopeExample 2: Hillshade with a 320 azimuth and a Z factor of 2.Example 3: Hillshade wtih a 180 azimuth (south) showing reversed topography.Ministère des Forêts, de la Faune et des Parcs14
User’s Guide: Products Derived from LiDAR Data - 2nd edition4.1.5 Create a Slope ModelTo create a slope model, a DTM must be added to the map’s table of contents. Next, click on“Windows” in the toolbar and select “Image Analysis”. When the window opens, select the DTMon which you wish to work and then click the “Add a function” button (in yellow in the imagebelow) in the “Processing” section.Ministère des Forêts, de la Faune et des Parcs15
User’s Guide: Products Derived from LiDAR Data - 2nd editionA new window will open. Place the cursor on the DTM, then right-click and select “InsertFunction”. Select “Slope Function” from the list of functions.A new window will open where you should select PERCENT RISE as the output measure. Leavethe Z factor at 1 and click on OK.Then click on OK in the “Function Template Editor” window, and you will obtain a black-and-whiteslope model. You can change the symbology (see section 4.1.2) or apply a “.lyr” file containing thedesired symbology (see section 4.1.1 or next page). You can downlowd the proposed “.lyr” forslopes from the “Symbologie.zip” file ion/DonneeGratuite/Foret/IMAGERIE/Produits derives LiDAR/Ministère des Forêts, de la Faune et des Parcs16
User’s Guide: Products Derived from LiDAR Data - 2nd editionTo change the symbology, right-click on the layer you have created and select “Properties” toopen its properties. In the “Symbology” tab, click on the “Import” button (in yellow in the imagebelow), then select the “.lyr” file containing the symbology (e.g. “Pentes 32I12NE.lyr”) and clickon OK.This will give a slope layer with the desired symbology, similar to the image below. In the proposedsymbology for slopes, the upper value of each class is included, e.g. the 0 to 3 % includes the value3.000000 %, and the 3 to 8 % class starts at 3.000001 % and includes the value 8.000000 %.Ministère des Forêts, de la Faune et des Parcs17
User’s Guide: Products Derived from LiDAR Data - 2nd edition4.1.6 Assemble Several RastersTo assemble multiple raster images together, you can use the “Mosaic to New Raster” tool byclicking on “Data Management Tools Raster Raster Dataset Mosaic To New Raster” inArcToolbox. Assembly is best done using a limited number of map sheets. With more than 10 mapsheets, the generated raster will probably be too large to use.1. Input Rasters: Select the .tif images, not the .lyr files.2. Output Location: Select the file in which the new raster will be saved.3. Raster Dataset Name with Extension: Assign the name of the output raster with the .tifextension.4. Spatial Reference for Raster (optional): Select the reference for one of the data layers.5. Pixel Type (optional): Select 8 BIT UNSIGNED for a hillshade and 32 BIT FLOAT for otherproducts.6. Cell size: Select the desired resolution (1 m is used in this example).7. Number of Bands: Select 1.Ministère des Forêts, de la Faune et des Parcs18
User’s Guide: Products Derived from LiDAR Data - 2nd edition8. Mosaic Operator (optional): Select “Maximum”, because the overlapping pixels aregenerally similar. However, other types of operators would have little impact on theresult.9. Mosaic Colormap Mode (optional): Select “First”.4.1.7 Clip Raster Data in a Given AreaTo clip a raster, first select the raster to be clipped. Then select “Customize” ”Toolbars” and“Draw”. Use the rectangle tool to create a rectangle for clipping.Ministère des Forêts, de la Faune et des Parcs19
User’s Guide: Products Derived from LiDAR Data - 2nd editionOpen the image analysis window by clicking on “Windows” ”Image Analysis”. In the imageanalysis window, click on the “Clip” tool.Ministère des Forêts, de la Faune et des Parcs20
User’s Guide: Products Derived from LiDAR Data - 2nd editionLastly, right-click on the name of the clipped image and then on “Data Export Data”. This willenable you to save the new clipped raster.Ministère des Forêts, de la Faune et des Parcs21
User’s Guide: Products Derived from LiDAR Data - 2nd edition4.2 ADVANCED FEATURESOther products can be created from basic LiDAR derived products using territorial analysis. Bothapplications previously mentioned (ArcGIS and QGIS) offer tools that can be used to obtaincontour lines, convert rasters to polygons, fill lakes, delimit drainage basins (watersheds),reclassify rasters, generate a focal CHM, generate a topographic wetness index, etc.4.2.1 Create Contour LinesRequires the 3D Analyst licence (see the licence-free process with QGIS in section 5.3.1).To create contour lines, you will need one or more DTMs for the region for which you want thecontour lines. The DTMs should ideally be clipped (see section 4.1.7) or combined to obtain thedesired area only, since this will increase processing speed. Once the area is ready, openArcToolbox and select “3D Analyst Tools” Raster-surface Contour”. The following window willopen.In the new window, select your “Input raster”, select the output location (“Output polylinefeatures” field) and enter the required distance between each line in the “Contour interval” field.Ministère des Forêts, de la Faune et des Parcs22
User’s Guide: Products Derived from LiDAR Data - 2nd editionThis will give a result similar to the following image.The colour of the lines can be changed by right-clicking on the layer and selecting the “Symbology”tab of the “Layer Properties” window. Labels can also be displayed using the “Labels” tab in the“Layer Properties” window. Check “Label features in this layer” and select the “Label Field” youwish to display.Ministère des Forêts, de la Faune et des Parcs23
User’s Guide: Products Derived from LiDAR Data - 2nd edition4.2.2 Reclassify RastersIt can be useful to reclassify rasters, among other things to convert a raster file into a vector layer.This operation requires the “Spatial Analyst” extension and is carried out using the Hillshade layer.First, the desired Hillshade must be added to the project’s table of contents. Next, openArcToolbox and select “Spatial Analyst Tools Reclass Reclassify”. The following window willopen.Next, select the raster on which you wish to work and select “Value” in the “Reclass field”. Toreclassify the values, click on the “Classify” button in the reclassification section. The list of valueswill then appear in the field on the left-hand side, and a predefined classification will be offered.You can change it as you wish. Once the classification values have been chosen, select a locationfor your output raster and click on OK. Your new raster will be added to your map’s table ofcontents.MNT Ombre 22C04NEValueMinistère des Forêts, de la Faune et des Parcs24
User’s Guide: Products Derived from LiDAR Data - 2nd edition4.2.3 Convert a Raster Image to Vector Format (Polygons)Converting a raster image to vector format allows LiDAR data to be used on certain types of GPSdevices that are unable to read raster files. Please note that the process is very time-consuming,so make sure you have clipped the area you want (see la section 4.1.7) before starting the process.In addition, we recommend reclassifying the raster (see section 4.2.2) to avoid producing apolygon for each pixel, which would make the layer too big to use.To convert a raster, start by adding the raster you wish to convert to the project table of contents.Then, from Arc Toolbox, select “Conversion Tools From Raster Raster to Polygon”. Next, selectthe desired input raster, select a location for the output polygon file, and click on OK.Ministère des Forêts, de la Faune et des Parcs25
User’s Guide: Products Derived from LiDAR Data - 2nd edition4.2.4 Create a Focal CHMA focal CHM can be created from a CHM. The focal CHM better indicates the maximum canopyheight value for coniferous trees, making it easier to interpret stand height. However, the focalCHM artificially expands canopy diameter and thereby significantly overestimates cover density.To create a focal CHM, start by adding the desired CHM to the project table of contents. Next,in Arc Toolbox, select “Spatial Analyst Tools Neighborhood Focal Statistics”. The followingwindow will open. In this new window, select the CHM you want as the input raster and select alocation for your output raster. Next, select “Circle” in the “Neigborhood” drop-down menu and“MAXIMUM” in the “Statistics type (optional)” drop-down menu. For a CHM of a coniferous ormixed forest, you should test several radius values, but the value 3 generally gives good resultsand provides a better view of the maximum coniferous stem value.After processing, you will obtain a raster similar to the following image.Standard CHMMinistère des Forêts, de la Faune et des ParcsFocal CHM26
User’s Guide: Products Derived from LiDAR Data - 2nd edition4.2.5 Topographic Wetness IndexThe topographic wetness index (TWI) is used to assess the ground’s capacity to retain moisture.It takes into account water accumulation and slopes at a specific location.You must first download the SAGA file from: https://sourceforge.net/projects/saga-gis/.Next, install the necessary SAGA toolboxes. To do this, right-click on “Arc Toolbox” and select“Add a toolbox”. Then select the folder in which you saved your SAGA file (it must be unzippedfirst). In the SAGA file, select “ArcSAGA Toolboxes” and install the “Terrain Analysis Preprocessing” and “Terrain Analysis - Hydrology” toolboxes.Once the toolboxes have been installed, the first process is to fill surface depressions. To do this,select “Preprocessing Fill sink XXL”. In the new window, select the DTM you want in the “DEM”Ministère des Forêts, de la Faune et des Parcs27
User’s Guide: Products Derived from LiDAR Data - 2nd editionfield, then select the location of the output file (“Filled DEM” field) and enter 0.01 asthe “Minimum Slope [Degree] (opti
Finale.pdf. User's Guide: Products Derived from LiDAR Data - 2. nd. . and light are shades of grey associated with integers from 0 to 255 (from black to white). The spatial resolution of this raster is . download them free of charge. To do this: 1. Access the interactive map: https://www.foretouverte.gouv.qc.ca;