Transcription
Psychosocial and Lifestyle Questionnaire2006 - 2010Documentation ReportCore Section LBJacqui Smith, Gwenith Fisher, Lindsay Ryan, Philippa Clarke, Jim House and David WeirThe HRS Psychosocial Working GroupSurvey Research CenterInstitute for Social ResearchUniversity of MichiganAnn Arbor, MichiganFebruary 20131
Table of ContentsIntroduction . 4Overview . 42004 Survey Methodology. 72006 Survey Methodology. 72008 Survey Methodology. 82010 Survey Methodology. 8Weighting . 8Special Methodological Issues to Consider . 9Response Scales . 9Recoding Responses and Negative Wording of Survey Items . 9Who Completed the Questionnaire? . 9The Content and Format of this User Guide . 10Note on Construct Question Numbers . 10Q1. Social Participation - Social Engagement . 11Q2. Retrospective Social Participation . . 12Q3. Life Satisfaction . 13Q4. – Q18. Social Network - Social Integration - Quality of Relationships - Social Support . 14Q19a - Q19e. Cynical Hostility 17Q19f - Q19k. Optimism / Pessimism . . 18Q19l - Q19o. Hopelessness . 19Q20. Loneliness . 20Q21. Neighborhood Disorder / Neighborhood Social Cohesion . . 21Q22 - Q23. Sense of Control - Self-Efficacy - Agency - Mastery . . 22Q24 - Q26. Domain Specific Control (Efficacy) . 23Q27. Positive and Negative Affect . 24Q28. Religiosity / Spirituality . . 26Q29. Self-Perceptions of Aging: Subjective Age and Aging Satisfaction . 27Q30. Everyday Discrimination . . 29Q31. Attributions of Everyday Discrimination . 30Q32. Social Effort / Reward Balance . 31Q32a. Quality of Relationships with parents in Early Life 32Q33. The "Big 5" Personality Traits . 33Q34. Personality Sub-Facet Traits: Conscientiousness and Impulsiveness . 35Q34a. Need for Cognition . 38Q35. Psychological Well-Being. 38Q36. Major Experiences of Lifetime Discrimination . 40Q37a. Lifetime Traumas . 41Q37b. Quality of Relationship with Mother Early in Life . 42Q37c. Lifetime Traumas Before the Age of 18 . 42Q38. Recent Stressful Life Events . 43Q39. Satisfaction with Domains of Life . 442
Q40. Experience of Financial Strain . 44Q40a. Ongoing Chronic Stressors. 45Q41. Anxiety . 46Q42. Anger . 47Q43 - Q44. Subjective Social Status (Ladder) . 48Q45. Currently Working . 49Q46. Job Lock . 49Q47. Perceived Ability to Work . 49Q48. Work/Non-work Interference and Enhancement . 50Q49. Chronic Work Discrimination . 51Q50a - Q50o. Job Stressors and Job Satisfaction . 52Q50p - Q50t. Work Environment . 53Q50u - Q50w. Coworker Support . . 54Q50x - Q50za. Supervisor Support . 542006 Scales or Specific Items Not Included in 2010 or 2008 Survey Content . 56Q2. Community Meeting Attendance . 56Q29. Frequency of Prayer . 56Q35. Psychological Well-Being (Two subscales) . 56Q46-47. Work/Family Priorities . 58Additional HRS Documentation for Psychosocial Data . 59Other Related Studies . 59English Longitudinal Study of Ageing (ELSA). 59Survey of Health, Ageing, and Retirement in Europe (SHARE) . 59Appendix A: Psychosocial Measure Concordance among 2006, 2008,and 2010 Questionnaires . 603
IntroductionOverviewIn 2004, HRS piloted a new feature for data collection in the form of self-administeredquestionnaires that were left with respondents upon the completion of an in-person CoreInterview. Since 2006, this mode of data collection has been utilized to obtain information aboutparticipants' evaluations of their life circumstances, subjective wellbeing, and lifestyle. Thispsychosocial information is obtained in each biennial wave from a rotating (random) 50% of thecore panel participants who complete the enhanced face-to-face interview (EFTF). Longitudinaldata will be available at four-year intervals: the 2010 wave provides the first longitudinalpsychosocial data from the 2006 participants. Some longitudinal data is also available for the2004 participants in subsequent waves. Electronic versions of the HRS Participant(Psychosocial) Lifestyle Questionnaires used in the 2004 pilot, and the 2006, 2008, and 2010waves are available on the HRS website (Documentation/Questionnaires - scroll down to the endof the Biennial Content to Psychosocial - Section LB). Because the questionnaire was left withrespondents at the end of the EFTF interview for them to complete and mail back to studyoffices, the questionnaire came to be known and is referred to on the HRS website as the LeaveBehind (LB). We use the terms Participant Lifestyle Questionnaire and Leave-Behind (or LB) inthis report to refer to the self-administered psychosocial data collection.BackgroundSince its inception in 1992, the HRS survey has focused on the health, economics, anddemographics of aging and the retirement process. Initially, the assessment of psychosocialissues in aging was not a goal of the HRS. In 2003, the NIA-HRS Data Monitoring Committeecommissioned a report by Professor Carol Ryff of the University of Wisconsin, which describedthe research opportunities from expansion into this area. That report is online view-RyffPsychosocialVariables.pdfThe launch of the English Longitudinal Study of Ageing (ELSA) in 2002 provided a startingpoint model for psychosocial data collection in HRS. The HRS then formed a Working Groupunder the direction of Jim House to consider content and methods toward four aims: 1) todetermine the extent to which psychosocial measures may improve understanding of causes andeffects of health, well-being, and retirement in middle and later life, 2) to improve understandingof social disparities in health, 3) to increase utilization of HRS data by researchers in additionalsocial science fields, including social epidemiology, social gerontology, and psychology, and 4)to facilitate the cross-cultural comparison of data from the English Longitudinal Study of Ageing(ELSA; http://www.ifs.org.uk/elsa/index.php) and the Survey of Health, Aging, and Retirementin Europe (SHARE; http://www.share-project.org/).In 2004, the HRS Psychosocial Working Group developed a pilot Participant LifestyleQuestionnaire and administered it as a leave-behind self-administered questionnaire to a pilotsample of about 4,000 respondents. In 2005, the scientific review of the HRS renewal proposalstrongly endorsed this new content and recommended an approach more strongly grounded inpsychological theory than that taken by ELSA. In conjunction with a subcommittee of the NIA4
HRS Data Monitoring Committee (Lisa Berkman, John Cacioppo, Nicholas Christakis, andCarol Ryff), the HRS consulted widely with experts in the psychology of aging and conducted aworkshop at the Annual Meeting of the Gerontological Society of America in Orlando, FL onNovember 18, 2005. The purpose of this meeting was to review the data collected from the pilotstudy, and discuss plans for a revised survey to be administered in 2006.Participants at the November 18, 2005 Psychosocial Workshop included:Toni Antonucci, University of MichiganElizabeth Breeze, University College, LondonDeborah Carr, Rutgers UniversityPhilippa Clarke, University of MichiganSheldon Cohen, Carnegie Mellon UniversityEileen Crimmins, University of Southern CaliforniaGwenith Fisher, University of MichiganRobert Hauser, University of WisconsinTess Hauser, University of WisconsinJim House, University of MichiganJames Jackson, University of MichiganMargie Lachman, Brandeis UniversityJohn J. McArdle, University of Southern CaliforniaCarol Ryff, University of WisconsinRichard Schulz, University of PittsburghJacqui Smith, Max Planck Institute of Human Development, now University of MichiganRon Spiro, VA Boston Healthcare System and Boston UniversityDavid Weir, University of MichiganRobert Willis, University of MichiganSince 2007, the content of the Psychosocial Questionnaire has been regularly discussed andrevised by the HRS Co-PIs. The co-authors of this study guide are especially grateful for thevaluable assistance provided by Rachel King and Jennifer Morack in various phases ofpreparation.5
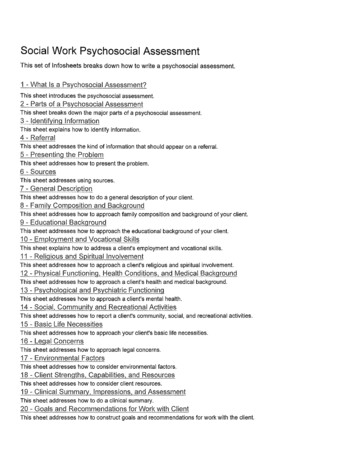
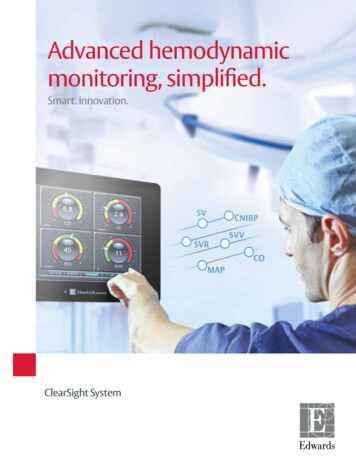
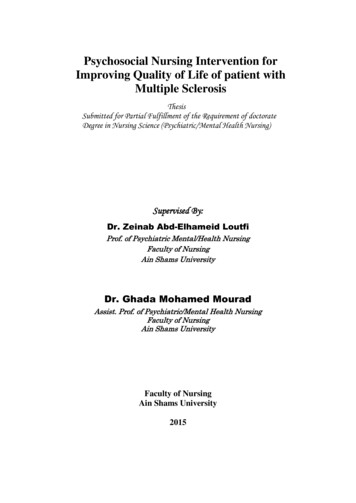
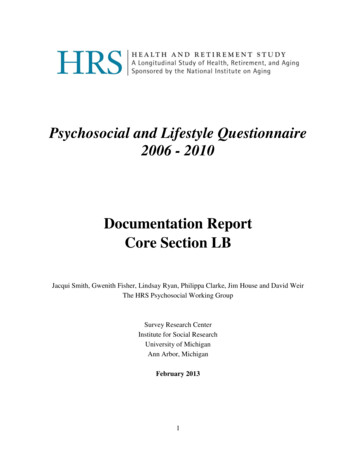
Overview of Psychosocial Content and Timeline 2004-2010After the 2004 pilot, the psychosocial questionnaire content was revised and updated in 2006.The psychosocial and lifestyle questionnaires from 2006 to 2010 now cover six substantiveareas that interest researchers across many disciplines: namely 1) subjective well-being; 2)lifestyle and experience of stress; 3) quality of social ties; 4) personality traits; 5) work-relatedbeliefs; 6) self-related beliefs. Figure 1 provides an outline of the constructs assessed in each ofthese areas. With the exception of some additions, the content in the 2008 and 2010 waves hasnot changed substantially since 2006. Specific information about the scales together with theirpsychometrics and sources is included below in this documentation report. Information aboutcross-wave concordance is provided below for each construct and is summarized in Appendix A.Figure 1: Overview of Content in the HRS Psychosocial and Lifestyle Questionnaire: 2006-2010Subjective WellbeingLife satisfactionDomain satisfaction*Depressive symptomsPositive affectNegative affectPurpose in lifePersonal growthFinancial strainLifestyle & StressActivities in daily life*Social participationNeighborhood cohesionReligiosityDiscriminationLifetime traumasEarly life experiencesStressful life eventsOngoing stress experiencesQuality of Social TiesSocial network compositionQuality of relationships:Positive and negative supportreceived fromspouse/child/kin/friendsEarly parental relationships*Frequency of contact with friends,children, *Cynical hostilityAnxietyAngerWork-related BeliefsWork stressWork discriminationWork satisfactionPerceived Capacity to work*Effort-reward balanceWork supportWork/family prioritiesWork/life balanceSelf-related BeliefsPersonal mastery (control)Perceived constraintsDomain-specific controlHopelessnessSubjective age*Self-perceptions of aging*Subjective social statusOptimism/PessimismNeed for cognition** Items added in 2008 /2010Figure 2 illustrates the current and planned longitudinal timeline for the collection ofpsychosocial constructs in HRS. The top row indicates the information available in the coreinterview protocol. Prior to 2006, HRS included limited information on psychosocial topics inthe core biennial survey. The primary measure was a 2-item screening for 12-month incidence ofmajor depression at study entry together with an 8-item version of the CES-D measure ofdepressive symptoms collected biennially in the Core (section D). As of 2008, all participants inthe core are also asked a single item of global well-being (Section B). In addition, from 2006onward, participants scheduled for the in-person interview (Enhanced Face-To-Face -EFTF) aregiven the self-administered Participant Lifestyle Questionnaire to complete and return by mail.Each wave, a random 50% of the longitudinal panel are scheduled for an in-person interview. In6
Figure 2, we notated the two 50% panel splits as A (begins in 2006) and B (begins in 2008). Thefirst longitudinal psychosocial data were collected from the same people in the initial 50%random subsample (A). Longitudinal data was collected in 2012 from the second 50% panel (B).This rotational design will continue in future waves. After 2012, some psychosocial constructsthat require a one-time collection (e.g., retrospective information about early life trauma andrelationships with parents) might only be collected only for new cohorts.Figure 2: Timeline for Collection of Psychosocial Data in HRSPLANNEDCore SamplePrior2004200620082010201220142016 * ABABABLB Sample * AB Indicators of depression Various small sample modules Single life satisfaction item First random 50% subsample Second random 50% subsampleSurvey Methodology2004 Survey MethodologyIn the 2004 wave of HRS, two questionnaires were administered to separate random subsamplesof living, non-institutionalized respondents who completed the EFTF interview. One was aParticipant Questionnaire on Work and Health which consisted of a series of work disabilityvignettes and was targeted toward respondents under 75 years of age. The other was a ParticipantLifestyle Questionnaire that contained questions on psychosocial topics and was administered torespondents of all ages. Respondents were asked to complete the questionnaires and mail themback to the main field office at the University of Michigan.Administration of the leave-behind questionnaires began around April 27 and continued throughthe end of the 2004 field period. Questionnaire assignments were made by Primary SamplingUnit (PSU) in such a way as to provide roughly equal numbers of respondents for each of thetwo leave-behind questionnaires. In households containing two respondents, both respondentsreceived the same type of questionnaire.Response rate: Among respondents who completed a core interview in 2004 and wereeligible for the psychosocial leave-behind, the response rate is 76.8%. Factoring in the 2004 coreresponse rate of 88.9%, the overall response rate is 68.3%.2006 Survey MethodologyIn 2006, the updated and revised Participant Lifestyle Questionnaire was administered, but thedisability questionnaire (the Participant Questionnaire on Work and Health) was not repeated. As7
in 2004, HRS respondents received a questionnaire if they were selected into the random 50%subsample for the EFTF interview as long as they were alive and either they or a proxycompleted at least part of the interview in person (designated as subsample A in the Figure 2timeline). Telephone follow-ups were conducted with respondents who had not returned aquestionnaire after the second reminder notice.Response rate: In 2006, the response rate for the leave behind questionnaire was about90% among those who completed the EFTF interview. Among all those assigned to theenhanced interview who completed any sort of interview, the response rate was about 82%percent. Factoring in the 2006 core response rate of 90% for those assigned to the EFTFinterview, the overall response rate was about 74 percent.2008 Survey MethodologyFor the 2008 wave, the psychosocial questionnaire was revised based on a review of the 2006content and data. In 2008, HRS respondents who had not completed the EFTF interview in 2006rotated into this mode of data collection (random 50% subsample B in Figure 2). Participantsreceived a questionnaire if they were selected for the EFTF interview as long as they were aliveand either they or a proxy completed at least part of the interview in person. Telephone followups were conducted with respondents who had not returned a questionnaire after the secondreminder notice.Response rate: In 2008, the response rate for the leave behind was just under 89% amongthose who completed the EFTF interview. Among all those assigned to get the enhancedinterview who completed any sort of interview, the response rate was about 80 percent. Factoringin the 2008 core response rate of 88.4% for those assigned to EFTF, the overall response ratewas about 71 percent.2010 Survey MethodologyFor the 2010 wave, the psychosocial questionnaire was minimally revised based on a review of2006 and 2008 content and data. In 2010, HRS respondents who had completed the EFTFinterview in 2006 again rotated into this mode of data collection. This rotation design providesthe first longitudinal data for the random 50% subsample (A) as shown in Figure 2. Participantsreceived a questionnaire if they were selected for the EFTF interview as long as they were aliveand either they or a proxy completed at least part of the interview in person. Telephone followups were conducted with respondents who had not returned a questionnaire after the secondreminder notice.Response rate: Information about the 2010 response rate for the leave behind for both thelongitudinal panel and new cohort will be available when the cross-wave tracker file is updated.WeightingBecause not all HRS respondents were asked to complete a psychosocial questionnaire, separaterespondent-level survey weights are constructed to adjust for the sample selection. The 2004,2006 and 2008 are available in the current cross-wave tracker file. Weights for 2010 will beincluded in future cross-wave tracker file updates.The psychosocial leave behind respondent weight developed for each wave is the product of a)the HRS respondent-level weight for the respective wave (e.g., 2006, 2008, etc.) and b) a nonresponse adjustment factor. The non-response adjustment factor was obtained from a propensity8
model predicting the probability of completing the psychosocial leave-behind questionnaireamong all eligible cases. The propensity model was estimated by logistic regression andweighted by the HRS respondent-level weight. Predictor variables included age, sex,race/ethnicity, language of interview, coupleness, education, work status, self-rated health, adichotomous indicator of chronic disease, vision rating, cognitive status, proxy status, and twogeneral indicators of cooperativeness: whether the respondent completed an interview in theprior wave and total number of interviewer calls required to complete the interview in that wave.The inverse of the fitted probabilities of completion formed the non-response adjustment factor.The resulting weight was trimmed at the fifth and ninety-fifth percentiles. This weight is definedfor respondents who completed the psychosocial leave-behind questionnaire. The psychosocialsample weights developed for subsequent waves were done using the 2006 method and responsepropensity model. We recommend using the psychosocial weight when analyzing data from thepsychosocial questionnaire to account for the complex sample structure. The decision to useweights or not of course depends on the research question and discipline.Special Methodological Issues to ConsiderResponse ScalesThe Participant Lifestyle Questionnaire is comprised of a variety of items and scales that aredescribed in more detail later in this document. Note that the response categories in thequestionnaire vary across scales, and it is very important to consult the codebooks andquestionnaires (available on the HRS website) for the response scales for each item. Thewording of scales is intended to maximize comparability with response scales used in othersurveys (e.g., ELSA, SHARE, MIDUS) and with previous research literature.Recoding Responses and Negative Wording of Survey ItemsMany of the items within measures in the questionnaire will need to be recoded so that highervalues correspond with higher levels on a given item or measure. For example, the positiveaffect items in Question 27 are asked using a scale as follows: 1 All of the time, 2 Most of thetime, 3 some of the time, 4 A little of the time, and 5 None of the time. By recoding the valuesso that 1 None of the time, 2 a little of the time, etc., higher values will correspond to higherlevels of positive affect.Similarly, items vary in terms of being positively and negatively worded. This is a practicefrequently employed in the assessment of psychosocial issues to combat response sets (e.g.,when a respondent circles the same answer for every question). The values for negativelyworded items need to be reversed to obtain a positive composite score. For example, Question22d to assess control reads “I have little control over the things that happen to me.” The valueson this item will need to be recoded in order to be consistent with other items where highervalues indicate having more control when creating a composite score. This documentation reportprovides information on when to reverse-code items.Who Completed the Questionnaire?Question 51 was asked at the end of the survey as an indicator of whether or not a proxyrespondent was used to complete the questionnaire: “Were the questions in this booklet answered9
by the person whose name is written on the front cover?” Approximately 1-2% of psychosocialquestionnaires are completed by proxy respondents. In many cases where the participant is veryold, a caregiver acts as a scribe especially if the participant is vision impaired or finds it difficultto hold a pen due to arthritis.Note on TerminologyThe terms used in this report to describe each construct are prevalent in the sociology andpsychology literatures and consistent with the original item/scale source. Sometimes you mayfind papers from researchers who use a different general term a describe a construct built fromthe same items or who form composite scores from different sets of items. For this reason, wesuggest that users search for specific items as well as overall topics in the questionnaire.The Content and Format of this User GuideThis User Guide provides information about the psychosocial constructs included in the waves2006, 2008, and 2010. For each construct, we provide citations for the source(s) of the items, listthe items in the questionnaire, report the response coding and inter-item consistency (reliability)information, and as far as possible include citations for several papers to illustrate how theconstruct has been used in the literature.Note on Construct Question NumbersWhile most constructs, scales, and question numbering are the same across these waves, thereare some differences. In order to provide a method for easy comparison across the three wavesof the psychosocial questionnaires covered in this guide, each main construct is listed using the2010 question numbering. If the question numbering was identical in the questionnaires forearlier waves (e.g.,2006 and 2008), we list these waves in parentheses to the right. Instances ofinconsistent question numbers or when a construct was not included in a prior wave are noteddirectly below the construct label. You can also refer to Appendix A at the end of this documentfor a table summary of content concordance across 2006, 2008, and 2010.10
Q1. Social Participation - Social Engagement (2006, 2008, & 2010)The 20 items included in 2010 cover a wide range of activities and ask frequency ofparticipation. Earlier questionnaires covered reduced lists of activities: only 18 items of these 20were in 2008 for example. The small set of activities covered in 2006 have mostly beenintegrated into different sections of the 2008 and 2010 questionnaires. Composite scores fortypes and frequencies of activities can be constructed using the 2008 and 2010 items. However,because some activity wordings are slightly different between 2008 and 2010, and with theaddition of 2 new activities in 2010 (namely Q01b activities with grandchildren and Q01j watchTV), please pay close attention to the variable names as they may not match across the twosurveys. The 2006 items are Y/N, 2008 changed to a 6-point Likert scale (Daily to Not in the lastmonth), and 2010 changed to a 7-point scale adding the category Never/Not relevant.Sources:Hultsch, D.F., Hertzog, C., Dixon, R.A., & Small, B.J. (1999). Use it or lose it: Engagedlifestyle as a buffer of cognitive decline in aging. Psychology and Aging, 14, 245-263.Jopp, D. S., & Hertzog, C. (2010). Assessing adult leisure activities: An extension of aself-report activity questionnaire. Psychological Assessment, 22(1), 108-120.Levin, J.S. (2003). Private Religious Practices. In N. W. Group (Ed.), Multidimensionalmeasurement of religiousness/spirituality for use in health research: A report of the FetzerInstitute/National Institute on Aging Working Group (2nd ed., pp. 39-42). Kalamazoo,MI: John E. Fetzer Institute.Parslow, R.A., Jorm, A.F., Christensen, H., & Mackinnon, A. (2006). An instrument tomeasure engagement in life: Factor analysis and associations with sociodemographic,health, and cognition measures. Gerontology, 52, 188-198.Salthouse, T.A., Berish, D.E., & Miles, J.D. (2002). The role of cognitive stimulation onthe relations between age and cognitive functioning. Psychology and Aging, 17, 548-557.Items:20 items (Q01a-Q01t)(These first questions are about the activities in your life now. Please tell us HOW OFTEN YOUDO EACH ACTIVITY.)Q01aCare for a sick or disabled adult?Q01bDo activities with grandchildren, nieces/nephews, or neighborhood children?(2010 only)Q01cDo volunteer work with children or young people? (Q01b in 2008)Q01dDo any other volunteer or charity work? (Q01c in 2008)Q01eAttend an educational or training course? (Q01d in 2008)Q01fGo to a sport, social, or other club? (Q01e in 2008)Q01gAttend meetings or non-religious organizations, such as political, community, orother interest groups? (Q01f in 2008)Q01hPray privately in places other than church or a synagogue? (Q01g in 2008)Q01iRead books, magazines, or newspapers? (Q01h in 2008)11
Q01jQ01kQ01lQ01mQ01nQ01oQ01pQ01qQ01rQ01sQ01tWatch television? (2010 only)Do word games such as crossword puzzles or Scrabble? (Q01i in 2008)Play cards or games such as chess? (Q01j in 2008)Do writing (such as letters, stories, or journal entries)? (Q01k in 2008)Use a computer for e-mail, Internet or other tasks? (Q01l in 2008)Do home or car maintenance or gardening? (Q01m in 2008)Bake or cook something special? (Q01n in 2008)Make clothes, knit, embroider, etc.? (Q01o in 2008)Work on a hobby or project? (Q01p in 2008)Play sports or exercise? (Q01q in 2008)Walk for 20 minutes or more? (Q01r in 2008)Coding:1 Daily, 2 Several times a week, 3 Once a week, 4 Several times a month,5 At least once a month, 6 Not in the last month, 7 Never/Not Relevant (2010only). Note regarding Missing responses in 2008: If participants responded to atleast 2 activities we suggest recoding missings in other activities as 6 or 7. Noteregarding coding in 2006: Response scale was 1
Life satisfaction Domain satisfaction* Depressive symptoms Positive affect Negative affect Purpose in life Personal growth Financial strain children, family Lifestyle & Stress Activities in daily life* Social participation Neighborhood cohesion Religiosity Discrimination Lifetime traumas Early life experiences Stressful life events